| Param | Original file | Final file |
|---|---|---|
| Filename | modeM0/AS1A10_058T08_9000004528_31275cztM0_level2.evt | modeM0/AS1A10_058T08_9000004528_31275cztM0_level2_quad_clean.evt |
| Size (bytes) | 221,918,400 | 53,187,840 |
| Size | 211.6 MB | 50.7 MB |
| Events in quadrant A | 1,307,023 | 355,840 |
| Events in quadrant B | 2,208,574 | 356,544 |
| Events in quadrant C | 1,475,179 | 343,789 |
| Events in quadrant D | 1,527,717 | 343,898 |
| Mode M9 | |||
|---|---|---|---|
| Quadrant | BADHDUFLAG | Total packets | Discarded packets |
| A | 0 | 8 | 0 |
| B | 0 | 8 | 0 |
| C | 0 | 8 | 0 |
| D | 0 | 8 | 0 |
| Mode M0 | |||
|---|---|---|---|
| Quadrant | BADHDUFLAG | Total packets | Discarded packets |
| A | 0 | 6050 | 1 |
| B | 0 | 8962 | 1 |
| C | 0 | 6371 | 1 |
| D | 0 | 6718 | 1 |
| Mode SS | |||
|---|---|---|---|
| Quadrant | BADHDUFLAG | Total packets | Discarded packets |
| A | 0 | 60 | 0 |
| B | 0 | 60 | 0 |
| C | 0 | 60 | 0 |
| D | 0 | 60 | 0 |
| Quadrant | Total seconds | Saturated seconds | Saturation percentage |
|---|---|---|---|
| A | 2953 | 25 | 0.846597% |
| B | 2953 | 58 | 1.964104% |
| C | 2953 | 77 | 2.607518% |
| D | 2953 | 24 | 0.812733% |
Noise dominated data is calculated using 1-second bins in cleaned event files. If a bin has >2000 counts, and if more than 50% of those come from <1% of pixels, then it is considered to be noise-dominated and hence unusable.
| Quadrant | # 1 sec bins | Bins with >0 counts | Bins with >2000 counts | High rate bins dominated by noise | Noise dominated (total time) | Noise dominated (detector-on time) | Marked lightcurve |
|---|---|---|---|---|---|---|---|
| A | 3733 | 2954 | 0 | 0 | 0.00% | 0.00% | 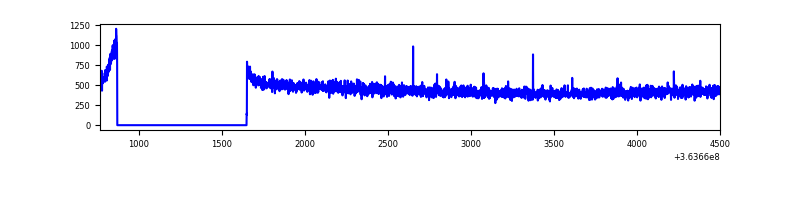 |
| B | 3733 | 2954 | 1 | 1 | 0.03% | 0.03% | 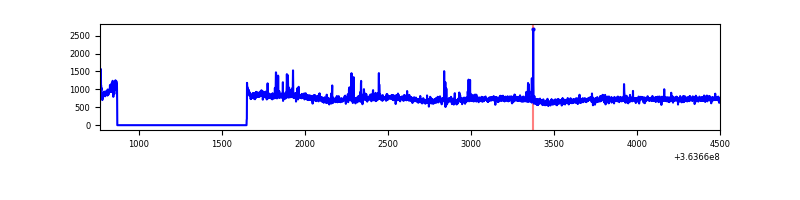 |
| C | 3733 | 2954 | 8 | 8 | 0.21% | 0.27% |  |
| D | 3733 | 2954 | 2 | 2 | 0.05% | 0.07% | 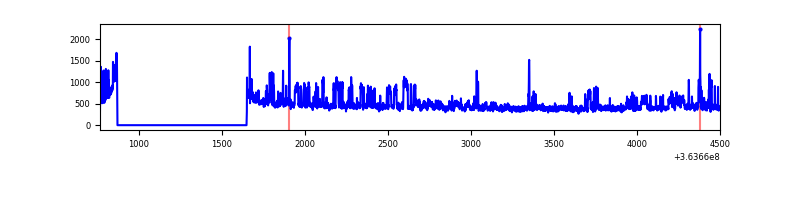 |
Top three noisy pixels from each quadrant. If the there are fewer than three noisy pixels in the level2.evt file, extra rows are filled as -1
| Pixel properties | Quadrant properties | ||||||
|---|---|---|---|---|---|---|---|
| Quadrant | DetID | PixID | Counts | Sigma | Mean | Median | Sigma |
| A | 13 | 254 | 5416 | 72.83 | 338 | 331 | 69.8 |
| A | 3 | 137 | 3440 | 44.53 | 338 | 331 | 69.8 |
| A | 0 | 226 | 2849 | 36.07 | 338 | 331 | 69.8 |
| B | 6 | 159 | 835347 | 12416.16 | 337 | 328 | 67.3 |
| B | 4 | 80 | 36647 | 540.04 | 337 | 328 | 67.3 |
| B | 0 | 230 | 11408 | 164.75 | 337 | 328 | 67.3 |
| C | 0 | 10 | 95868 | 1215.39 | 326 | 327 | 78.6 |
| C | 14 | 238 | 55102 | 696.8 | 326 | 327 | 78.6 |
| C | 3 | 233 | 43201 | 545.41 | 326 | 327 | 78.6 |
| D | 8 | 195 | 255154 | 3251.32 | 326 | 319 | 78.4 |
| D | 2 | 250 | 20141 | 252.9 | 326 | 319 | 78.4 |
| D | 12 | 233 | 11015 | 136.47 | 326 | 319 | 78.4 |
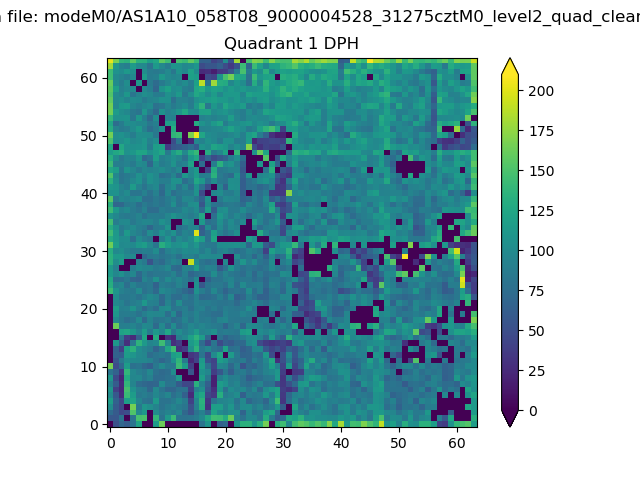
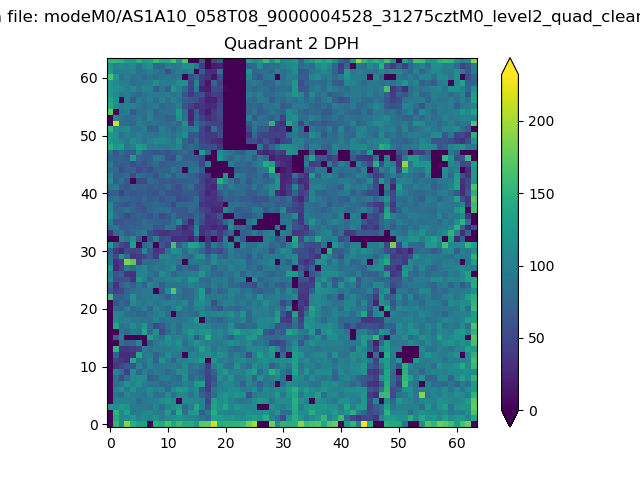
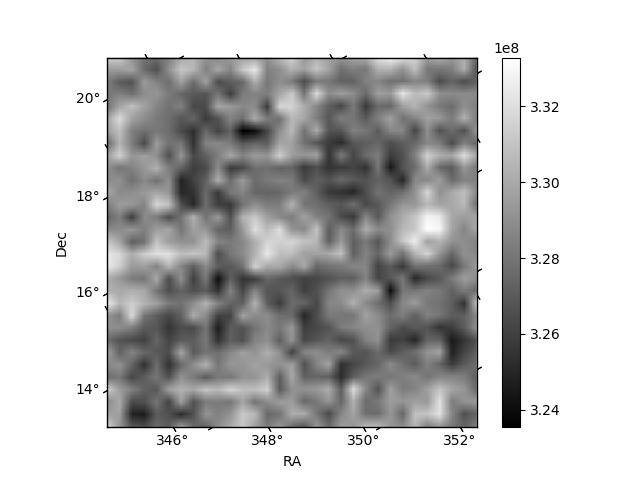
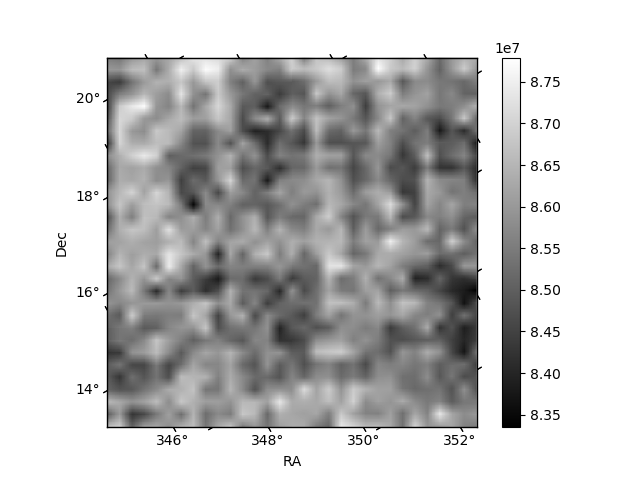
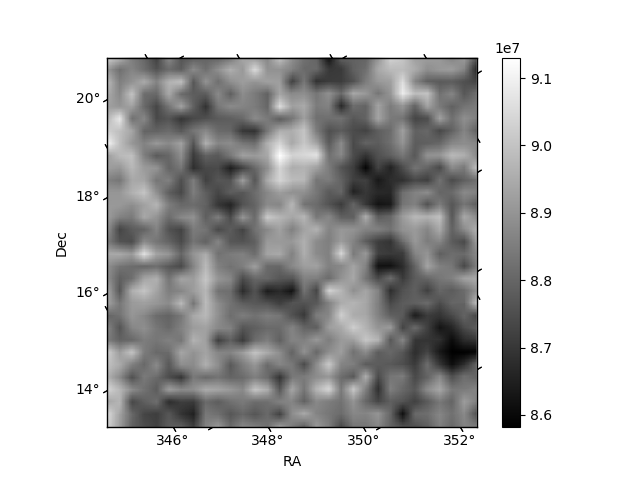
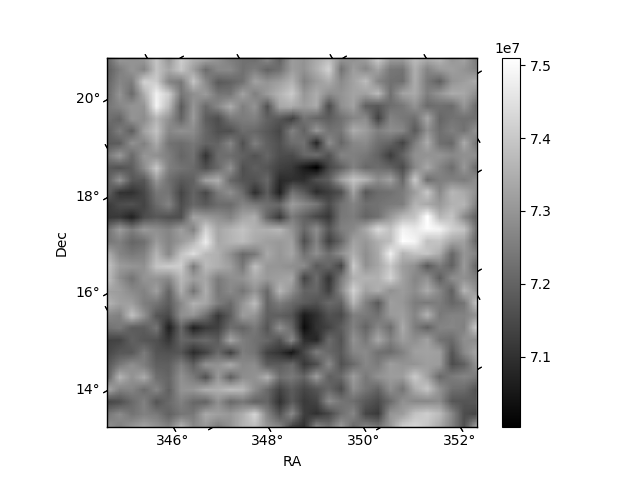
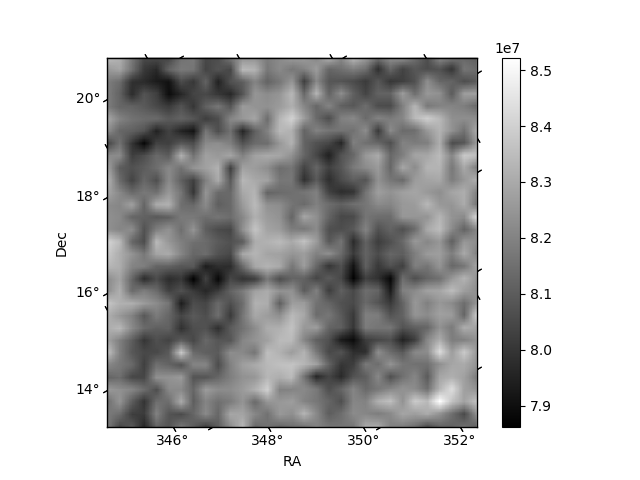
Histogram calculated using DETX and DETY for each event in the final _common_clean file
| Quadrant A | 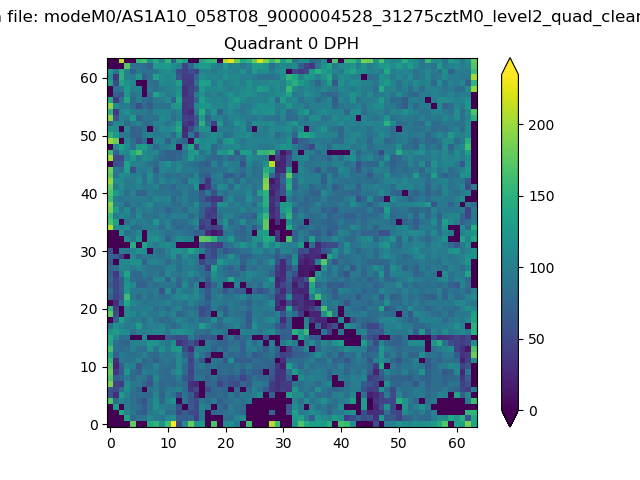 |
 |
Quadrant B |
|---|---|---|---|
| Quadrant D | 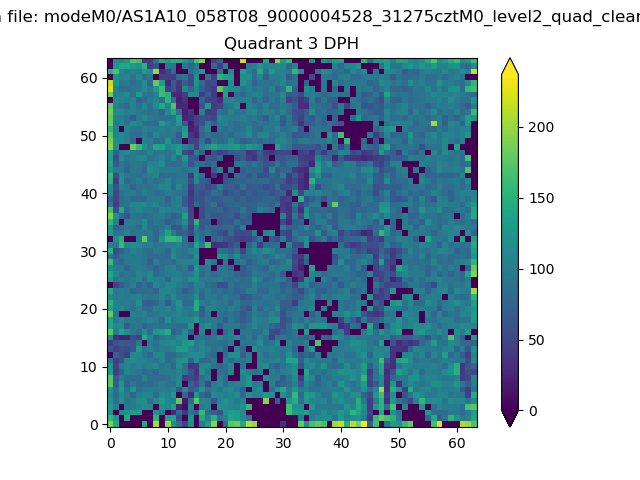 |
 |
Quadrant C |
| Plot type | Count rate plots | Images |
|---|---|---|
| Comparison with Poisson distribution Blue bars denote a histogram of data divided into 1 sec bins. Red curve is a Poisson curve with rate = median count rate of data. |
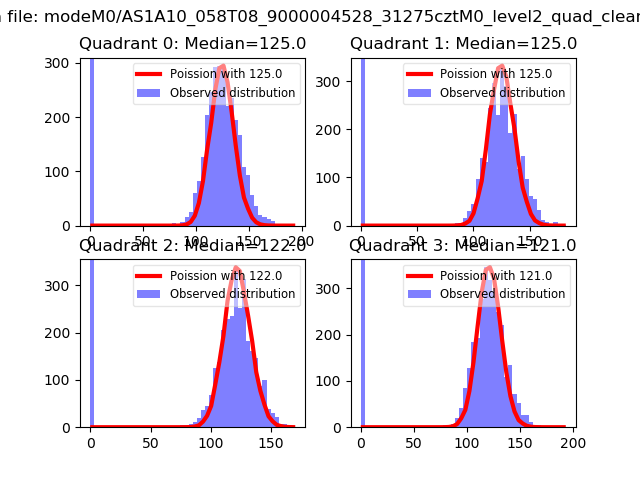 |
 |
| Quadrant-wise count rates Data is divided into 100 sec bins |
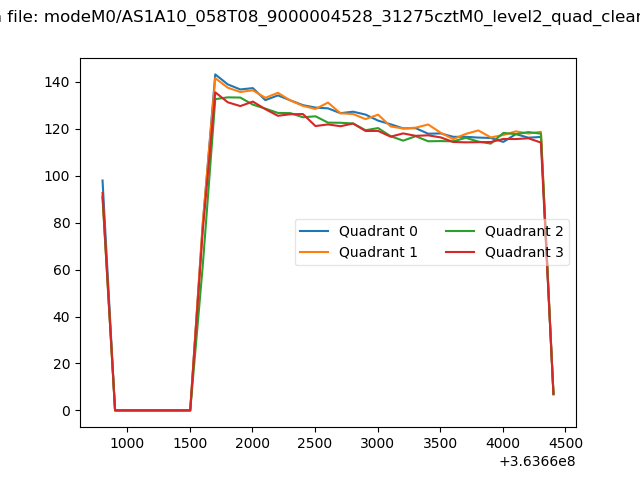 |
|
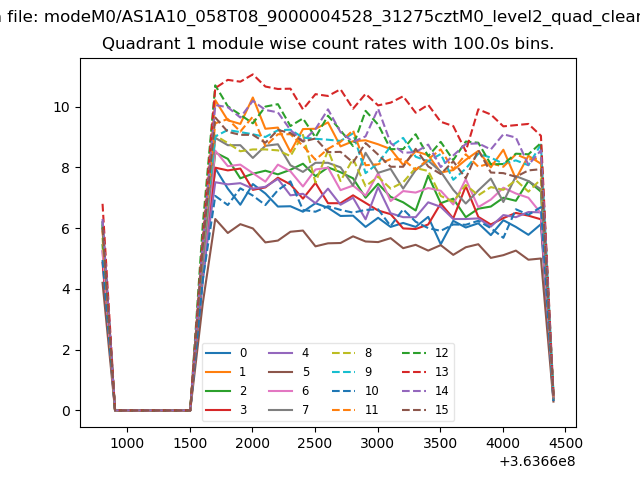
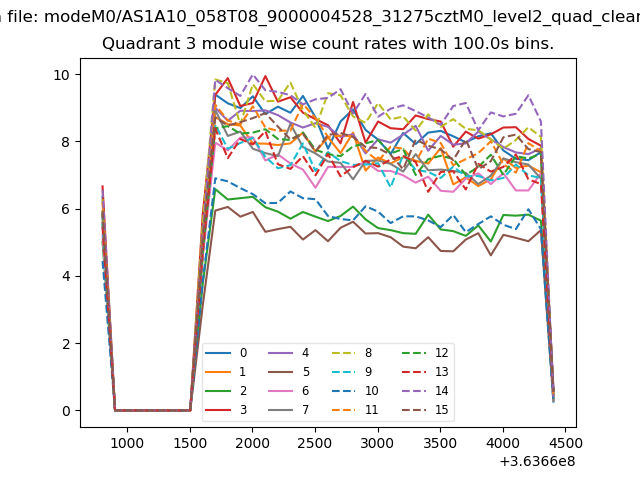
| Module-wise count rates for Quadrant A Data is divided into 100 sec bins |
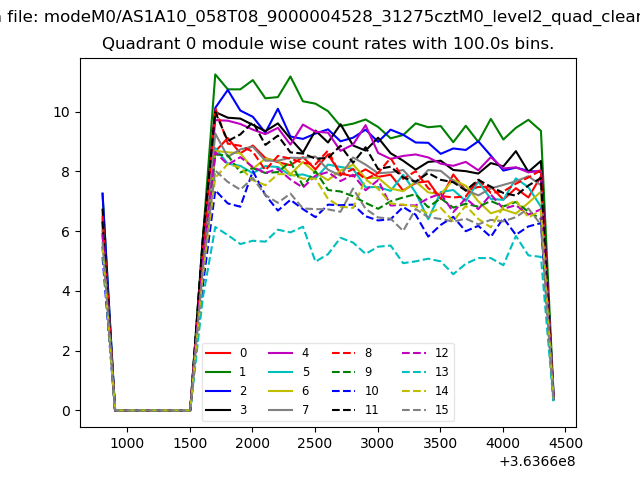 |
 |
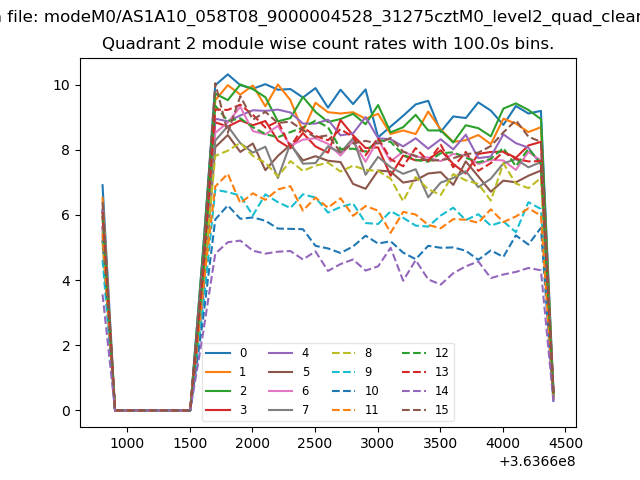
| Module-wise count rates for Quadrant B Data is divided into 100 sec bins |
 |
 |
| Module-wise count rates for Quadrant C Data is divided into 100 sec bins |
 |
 |
| Module-wise count rates for Quadrant D Data is divided into 100 sec bins |
 |
 |
| Parameter | Plot |
|---|---|
| CZT HV Monitor |  |
| D_VDD | 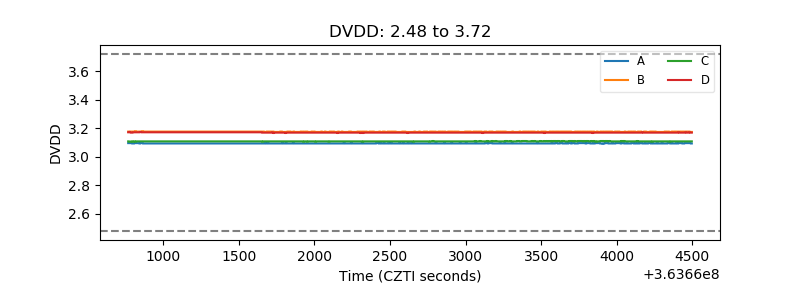 |
| Temperature 1 |  |
| Veto HV Monitor | 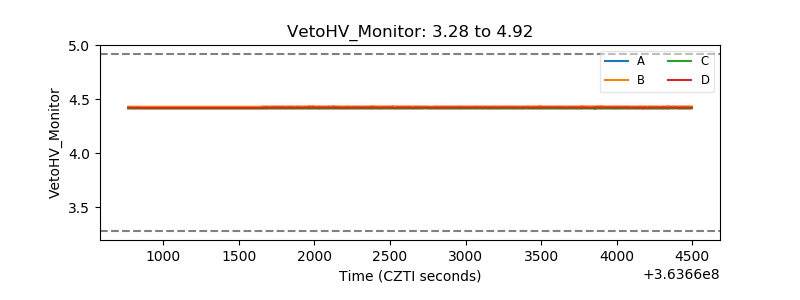 |
| Veto LLD | 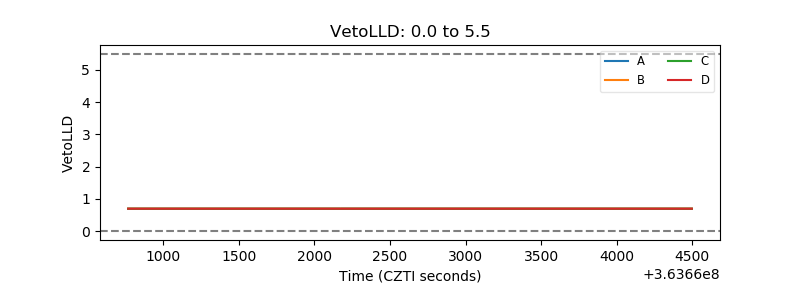 |
| Alpha Counter | 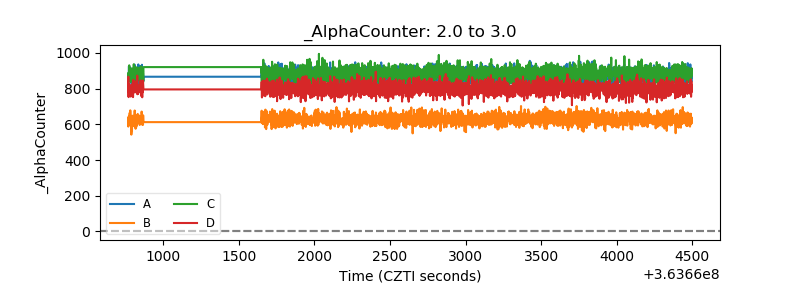 |
| _CPM_Rate | 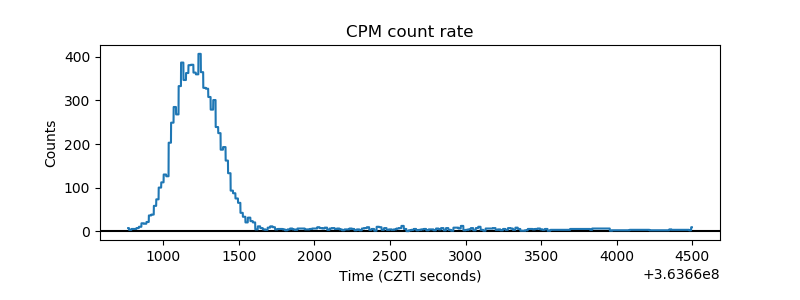 |
| CZT Counter | 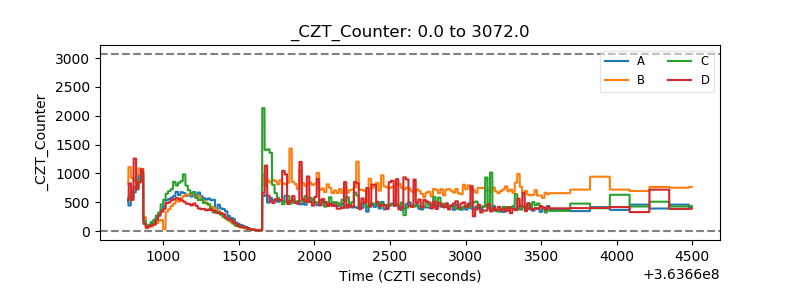 |
| +2.5 Volts monitor |  |
| +5 Volts monitor |  |
| _ROLL_ROT | 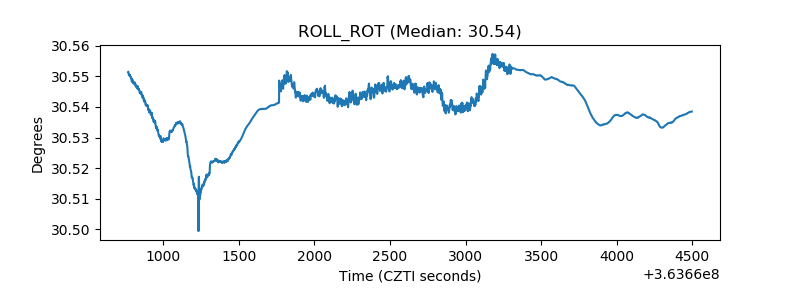 |
| _Roll_DEC |  |
| _Roll_RA | 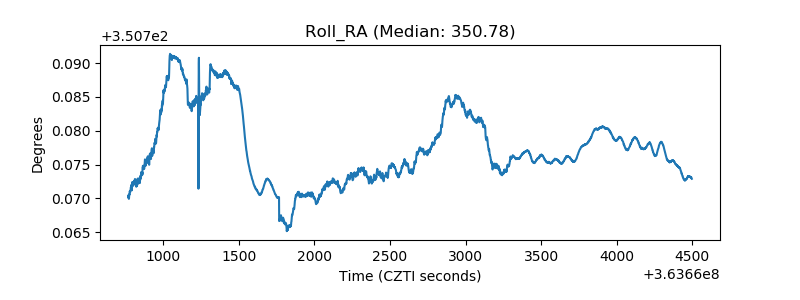 |
| Veto Counter | 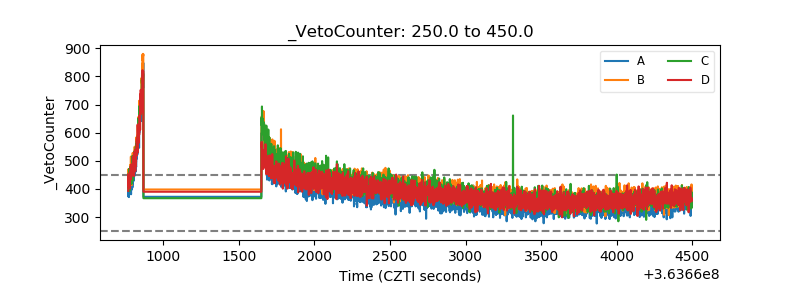 |