| Param | Original file | Final file |
|---|---|---|
| Filename | modeM0/AS1T04_021T01_9000004526cztM0_level2.fits | modeM0/AS1T04_021T01_9000004526cztM0_level2_quad_clean.evt |
| Size (bytes) | 319,812,480 | 233,133,120 |
| Size | 305.0 MB | 222.3 MB |
| Events in quadrant A | 2,082,414 | 1,348,946 |
| Events in quadrant B | 1,885,824 | 1,271,365 |
| Events in quadrant C | 1,930,384 | 1,238,943 |
| Events in quadrant D | 1,756,580 | 1,169,506 |
| Mode M0 | |||
|---|---|---|---|
| Quadrant | BADHDUFLAG | Total packets | Discarded packets |
| A | 0 | 63995 | 0 |
| B | 0 | 95433 | 0 |
| C | 0 | 76524 | 0 |
| D | 0 | 77352 | 0 |
| Mode M9 | |||
|---|---|---|---|
| Quadrant | BADHDUFLAG | Total packets | Discarded packets |
| A | 0 | 71 | 0 |
| B | 0 | 71 | 0 |
| C | 0 | 71 | 0 |
| D | 0 | 71 | 0 |
| Mode SS | |||
|---|---|---|---|
| Quadrant | BADHDUFLAG | Total packets | Discarded packets |
| A | 0 | 606 | 0 |
| B | 0 | 599 | 0 |
| C | 0 | 604 | 0 |
| D | 0 | 604 | 0 |
| Quadrant | Total seconds | Saturated seconds | Saturation percentage |
|---|---|---|---|
| A | 29558 | 516 | 1.745720% |
| B | 29508 | 1393 | 4.720754% |
| C | 29512 | 1507 | 5.106397% |
| D | 29525 | 695 | 2.353937% |
Noise dominated data is calculated using 1-second bins in cleaned event files. If a bin has >2000 counts, and if more than 50% of those come from <1% of pixels, then it is considered to be noise-dominated and hence unusable.
| Quadrant | # 1 sec bins | Bins with >0 counts | Bins with >2000 counts | High rate bins dominated by noise | Noise dominated (total time) | Noise dominated (detector-on time) | Marked lightcurve |
|---|---|---|---|---|---|---|---|
| A | 38059 | 29664 | 0 | 0 | 0.00% | 0.00% |  |
| B | 38059 | 29640 | 0 | 0 | 0.00% | 0.00% |  |
| C | 38059 | 29636 | 0 | 0 | 0.00% | 0.00% |  |
| D | 38059 | 29645 | 0 | 0 | 0.00% | 0.00% |  |
Top three noisy pixels from each quadrant. If the there are fewer than three noisy pixels in the level2.evt file, extra rows are filled as -1
| Pixel properties | Quadrant properties | ||||||
|---|---|---|---|---|---|---|---|
| Quadrant | DetID | PixID | Counts | Sigma | Mean | Median | Sigma |
| A | 0 | 29 | 2021 | 11.49 | 542 | 516 | 131.0 |
| A | 7 | 110 | 1605 | 8.32 | 542 | 516 | 131.0 |
| A | 0 | 30 | 1543 | 7.84 | 542 | 516 | 131.0 |
| B | 2 | 9 | 1504 | 10.33 | 501 | 482 | 98.9 |
| B | 5 | 255 | 1288 | 8.15 | 501 | 482 | 98.9 |
| B | 5 | 128 | 1249 | 7.76 | 501 | 482 | 98.9 |
| C | 12 | 241 | 1328 | 6.57 | 511 | 483 | 128.6 |
| C | 7 | 111 | 1312 | 6.45 | 511 | 483 | 128.6 |
| C | 3 | 187 | 1285 | 6.24 | 511 | 483 | 128.6 |
| D | 10 | 189 | 1318 | 6.56 | 502 | 463 | 130.3 |
| D | 4 | 246 | 1283 | 6.29 | 502 | 463 | 130.3 |
| D | 10 | 113 | 1243 | 5.99 | 502 | 463 | 130.3 |
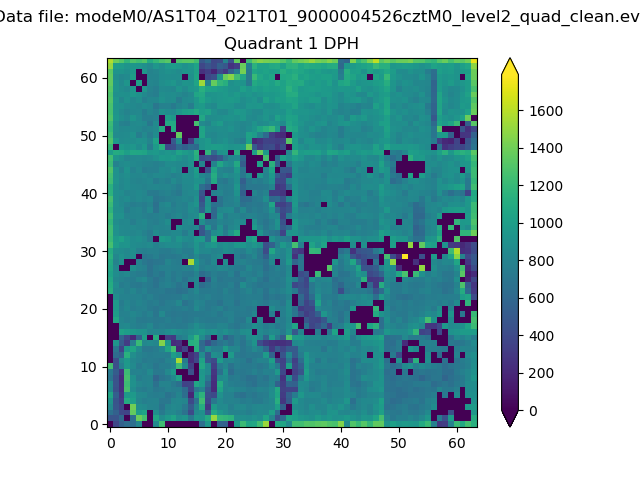
Histogram calculated using DETX and DETY for each event in the final _common_clean file
| Quadrant A |  |
 |
Quadrant B |
|---|---|---|---|
| Quadrant D |  |
 |
Quadrant C |
| Plot type | Count rate plots | Images |
|---|---|---|
| Comparison with Poisson distribution Blue bars denote a histogram of data divided into 1 sec bins. Red curve is a Poisson curve with rate = median count rate of data. |
 |
 |
| Quadrant-wise count rates Data is divided into 100 sec bins |
 |
|
| Module-wise count rates for Quadrant A Data is divided into 100 sec bins |
 |
 |
| Module-wise count rates for Quadrant B Data is divided into 100 sec bins |
 |
 |
| Module-wise count rates for Quadrant C Data is divided into 100 sec bins |
 |
 |
| Module-wise count rates for Quadrant D Data is divided into 100 sec bins |
 |
 |
| Parameter | Plot |
|---|---|
| CZT HV Monitor |  |
| D_VDD |  |
| Temperature 1 |  |
| Veto HV Monitor |  |
| Veto LLD |  |
| Alpha Counter |  |
| _CPM_Rate |  |
| CZT Counter |  |
| +2.5 Volts monitor |  |
| +5 Volts monitor |  |
| _ROLL_ROT |  |
| _Roll_DEC |  |
| _Roll_RA |  |
| Veto Counter |  |