| Param | Original file | Final file |
|---|---|---|
| Filename | modeM0/AS1T04_021T01_9000004526_31265cztM0_level2.evt | modeM0/AS1T04_021T01_9000004526_31265cztM0_level2_quad_clean.evt |
| Size (bytes) | 232,372,800 | 33,727,680 |
| Size | 221.6 MB | 32.2 MB |
| Events in quadrant A | 1,405,234 | 220,029 |
| Events in quadrant B | 2,109,899 | 212,066 |
| Events in quadrant C | 1,560,386 | 208,867 |
| Events in quadrant D | 1,796,557 | 206,587 |
| Mode M0 | |||
|---|---|---|---|
| Quadrant | BADHDUFLAG | Total packets | Discarded packets |
| A | 0 | 6177 | 320 |
| B | 0 | 8446 | 583 |
| C | 0 | 6871 | 550 |
| D | 0 | 7544 | 517 |
| Mode M9 | |||
|---|---|---|---|
| Quadrant | BADHDUFLAG | Total packets | Discarded packets |
| A | 0 | 13 | 0 |
| B | 0 | 15 | 2 |
| C | 0 | 13 | 0 |
| D | 0 | 14 | 1 |
| Mode SS | |||
|---|---|---|---|
| Quadrant | BADHDUFLAG | Total packets | Discarded packets |
| A | 0 | 54 | 0 |
| B | 0 | 53 | 6 |
| C | 0 | 54 | 2 |
| D | 0 | 54 | 2 |
| Quadrant | Total seconds | Saturated seconds | Saturation percentage |
|---|---|---|---|
| A | 2438 | 67 | 2.748154% |
| B | 2388 | 126 | 5.276382% |
| C | 2391 | 149 | 6.231702% |
| D | 2406 | 134 | 5.569410% |
Noise dominated data is calculated using 1-second bins in cleaned event files. If a bin has >2000 counts, and if more than 50% of those come from <1% of pixels, then it is considered to be noise-dominated and hence unusable.
| Quadrant | # 1 sec bins | Bins with >0 counts | Bins with >2000 counts | High rate bins dominated by noise | Noise dominated (total time) | Noise dominated (detector-on time) | Marked lightcurve |
|---|---|---|---|---|---|---|---|
| A | 3859 | 2545 | 0 | 0 | 0.00% | 0.00% | 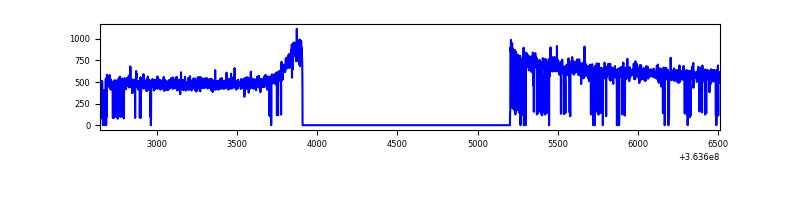 |
| B | 3865 | 2528 | 2 | 2 | 0.05% | 0.08% | 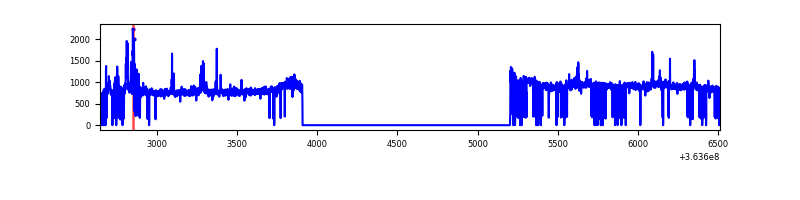 |
| C | 3864 | 2525 | 16 | 16 | 0.41% | 0.63% | 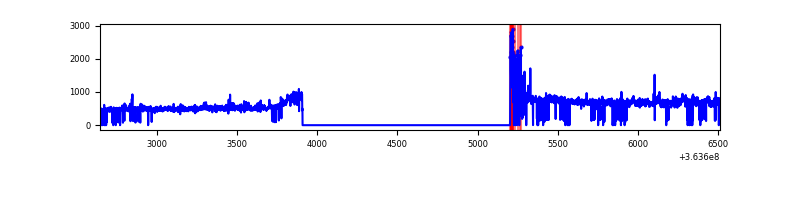 |
| D | 3866 | 2528 | 89 | 89 | 2.30% | 3.52% | 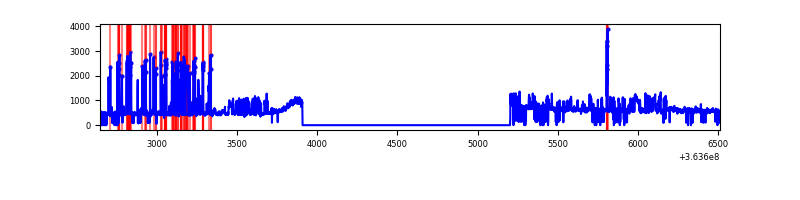 |
Top three noisy pixels from each quadrant. If the there are fewer than three noisy pixels in the level2.evt file, extra rows are filled as -1
| Pixel properties | Quadrant properties | ||||||
|---|---|---|---|---|---|---|---|
| Quadrant | DetID | PixID | Counts | Sigma | Mean | Median | Sigma |
| A | 13 | 254 | 4341 | 54.44 | 364 | 358 | 73.2 |
| A | 3 | 137 | 3255 | 39.6 | 364 | 358 | 73.2 |
| A | 0 | 226 | 3181 | 38.59 | 364 | 358 | 73.2 |
| B | 6 | 159 | 636975 | 9489.11 | 350 | 342 | 67.1 |
| B | 0 | 245 | 55466 | 821.63 | 350 | 342 | 67.1 |
| B | 0 | 190 | 23950 | 351.88 | 350 | 342 | 67.1 |
| C | 3 | 233 | 94070 | 1205.68 | 335 | 338 | 77.7 |
| C | 0 | 10 | 86827 | 1112.51 | 335 | 338 | 77.7 |
| C | 14 | 238 | 56577 | 723.41 | 335 | 338 | 77.7 |
| D | 8 | 195 | 448460 | 5186.54 | 346 | 338 | 86.4 |
| D | 12 | 79 | 17841 | 202.58 | 346 | 338 | 86.4 |
| D | 2 | 234 | 9221 | 102.81 | 346 | 338 | 86.4 |
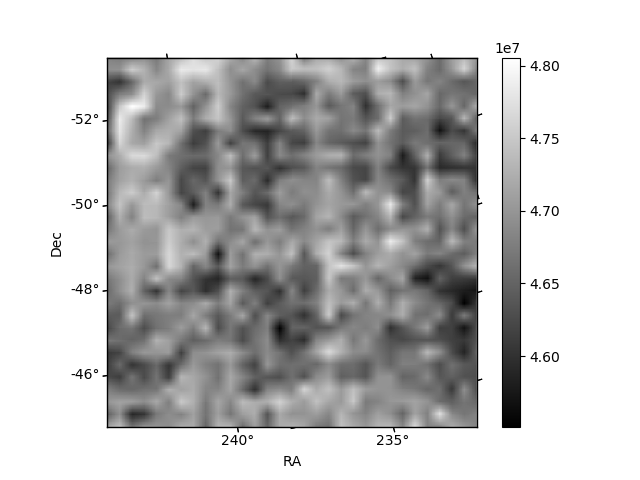
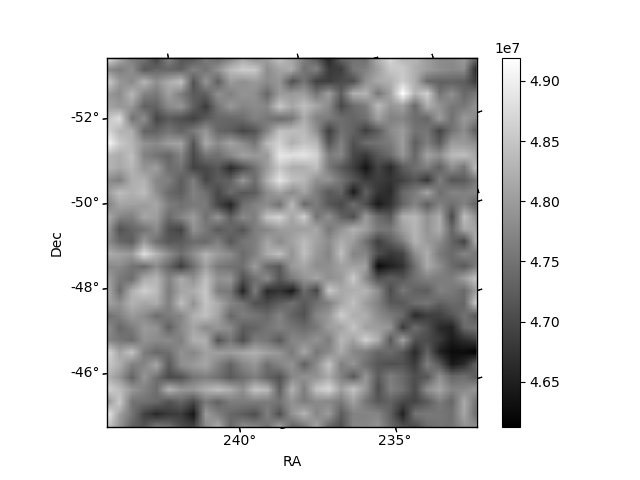
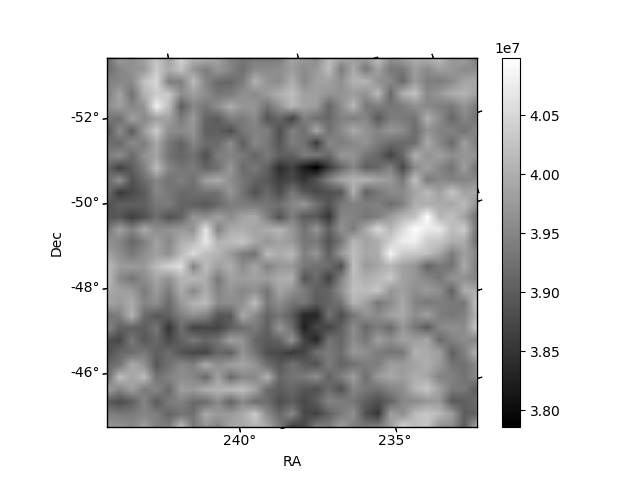
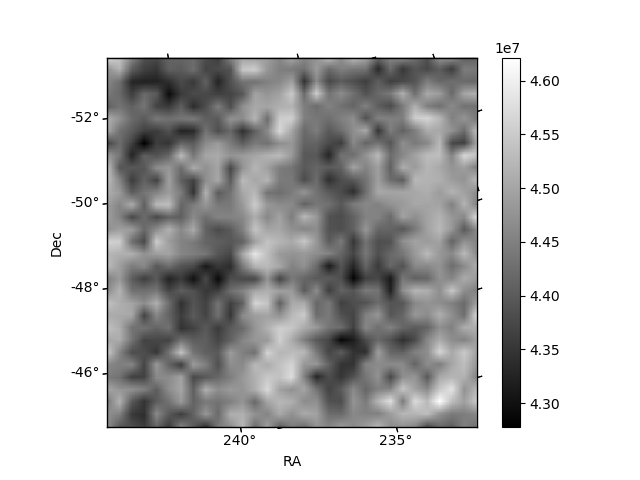
Histogram calculated using DETX and DETY for each event in the final _common_clean file
| Quadrant A |  |
 |
Quadrant B |
|---|---|---|---|
| Quadrant D |  |
 |
Quadrant C |
| Plot type | Count rate plots | Images |
|---|---|---|
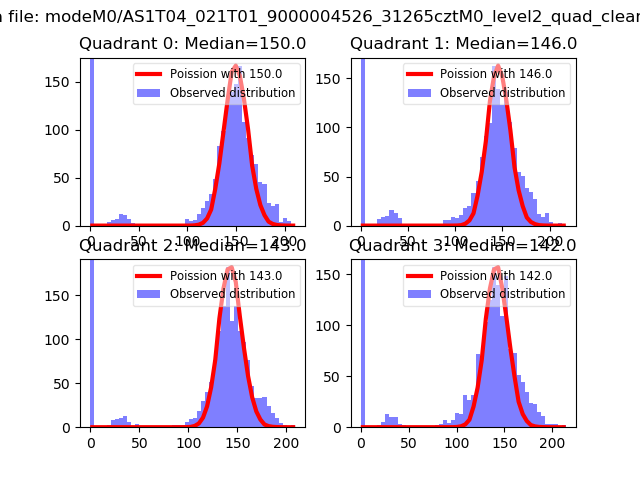
| Comparison with Poisson distribution Blue bars denote a histogram of data divided into 1 sec bins. Red curve is a Poisson curve with rate = median count rate of data. |
 |
 |
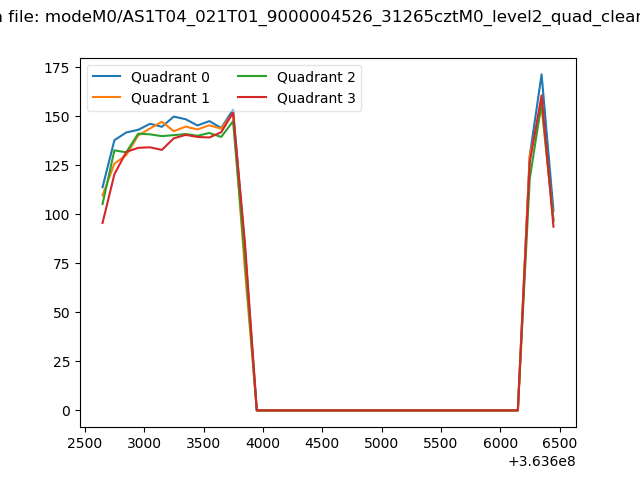
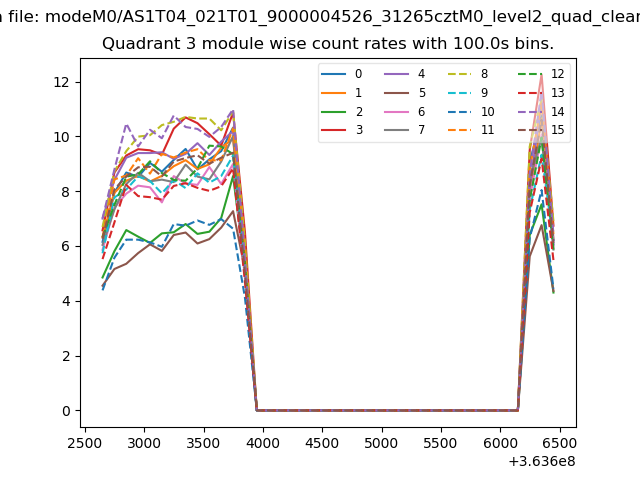
| Quadrant-wise count rates Data is divided into 100 sec bins |
 |
|
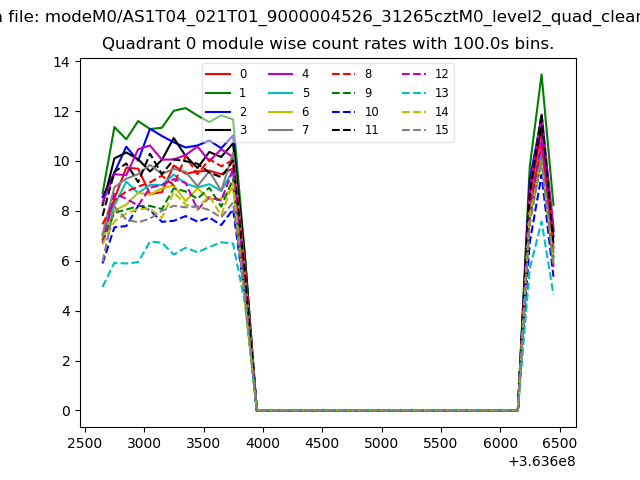
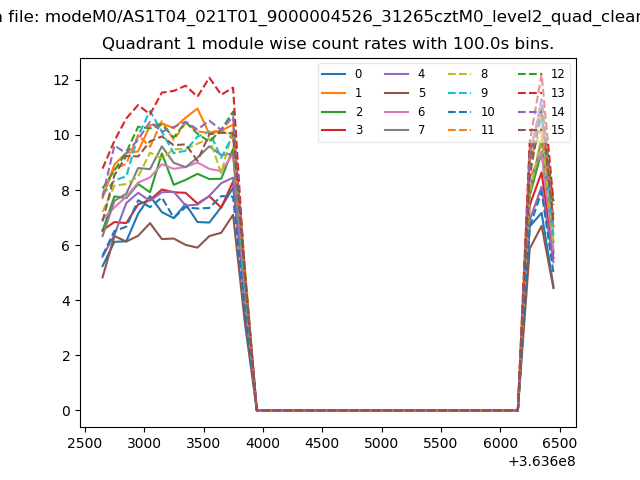
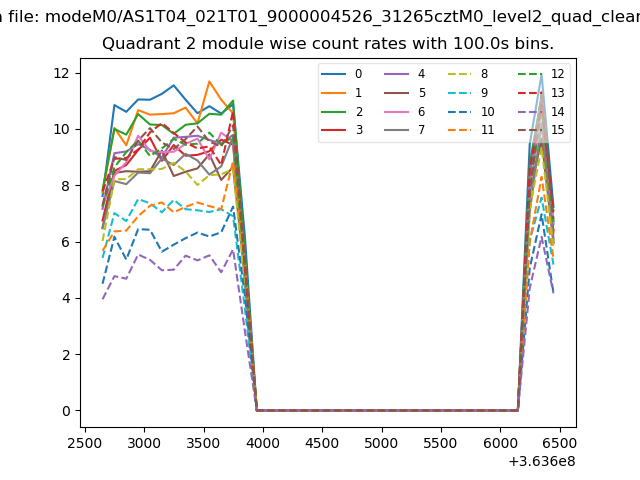
| Module-wise count rates for Quadrant A Data is divided into 100 sec bins |
 |
 |
| Module-wise count rates for Quadrant B Data is divided into 100 sec bins |
 |
 |
| Module-wise count rates for Quadrant C Data is divided into 100 sec bins |
 |
 |
| Module-wise count rates for Quadrant D Data is divided into 100 sec bins |
 |
 |
| Parameter | Plot |
|---|---|
| CZT HV Monitor | 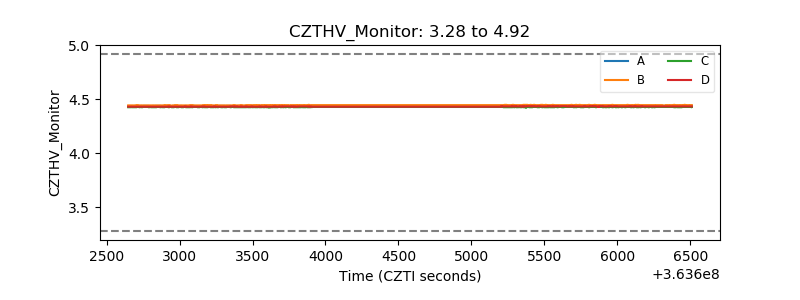 |
| D_VDD | 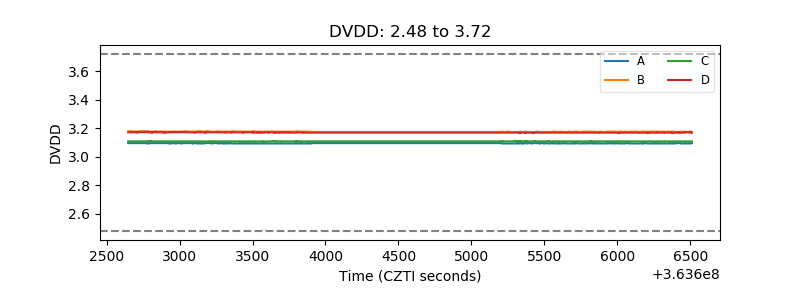 |
| Temperature 1 | 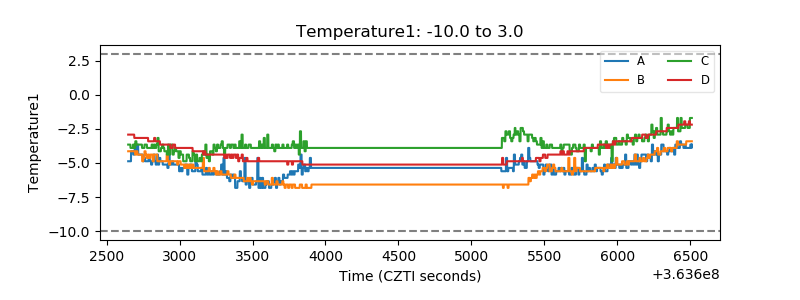 |
| Veto HV Monitor | 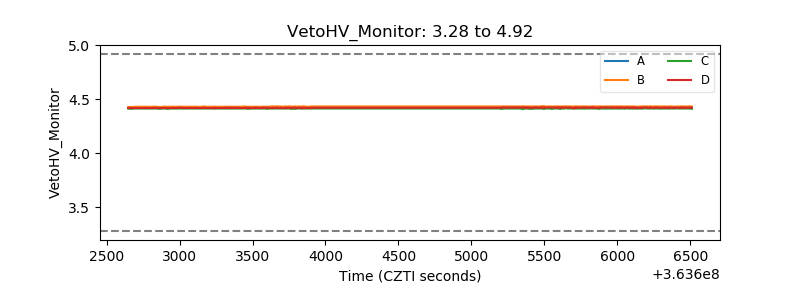 |
| Veto LLD | 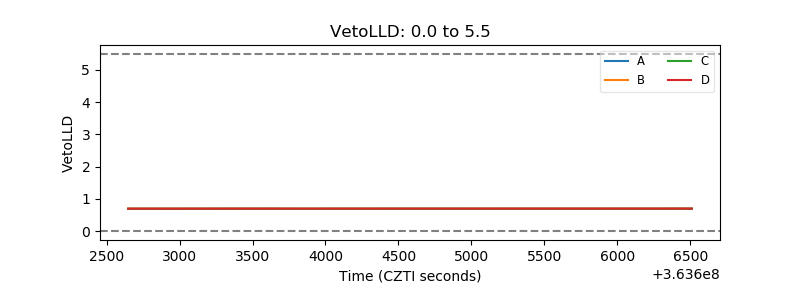 |
| Alpha Counter | 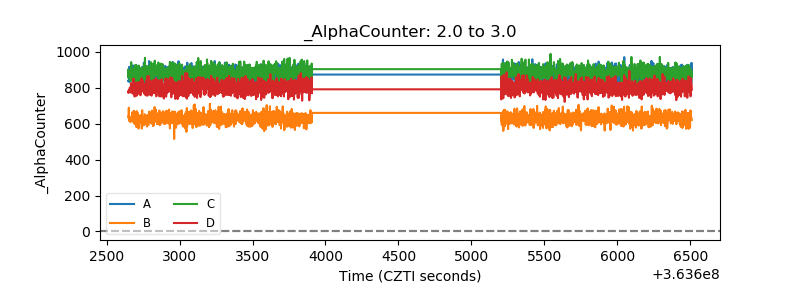 |
| _CPM_Rate | 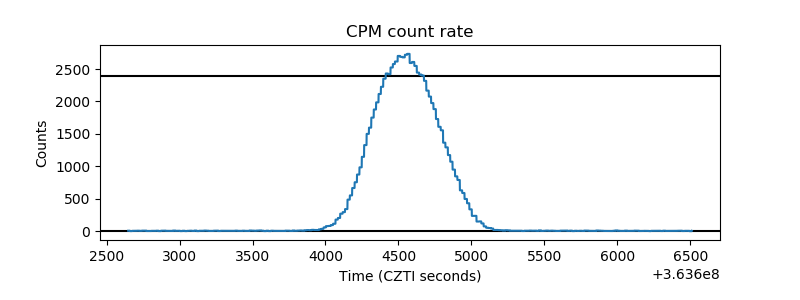 |
| CZT Counter | 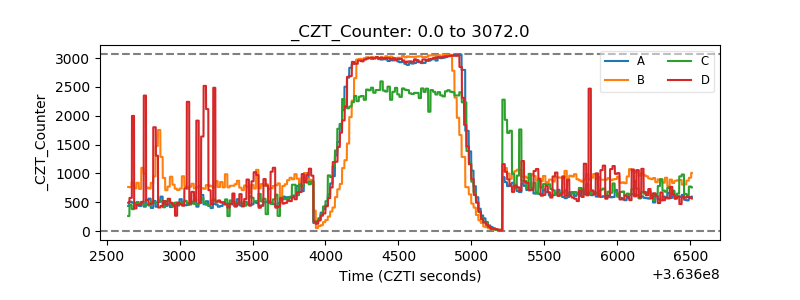 |
| +2.5 Volts monitor |  |
| +5 Volts monitor |  |
| _ROLL_ROT | 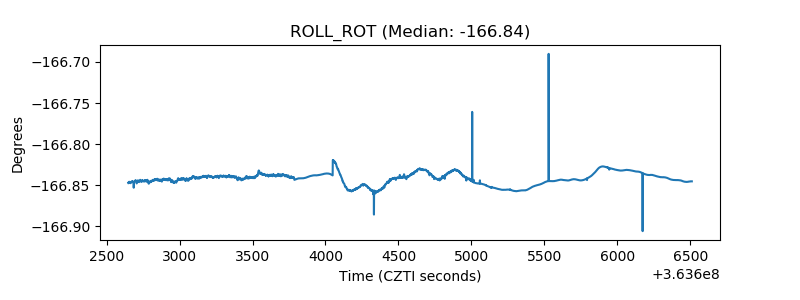 |
| _Roll_DEC | 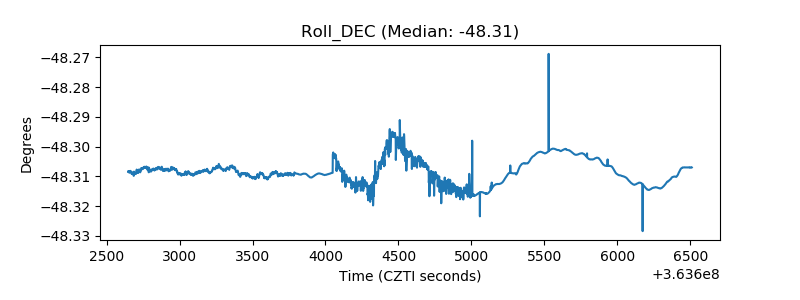 |
| _Roll_RA | 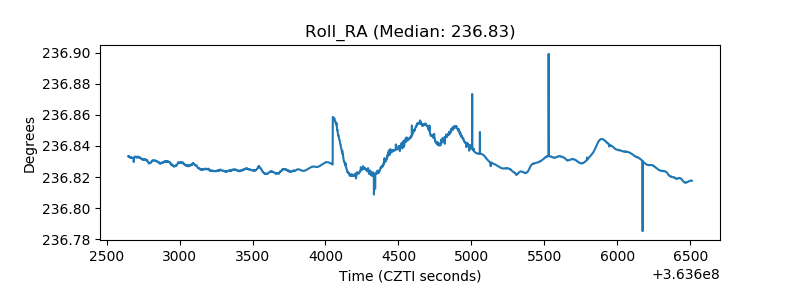 |
| Veto Counter |  |