| Param | Original file | Final file |
|---|---|---|
| Filename | modeM0/AS1T04_021T01_9000004526_31266cztM0_level2.evt | modeM0/AS1T04_021T01_9000004526_31266cztM0_level2_quad_clean.evt |
| Size (bytes) | 594,316,800 | 107,403,840 |
| Size | 566.8 MB | 102.4 MB |
| Events in quadrant A | 3,543,806 | 723,719 |
| Events in quadrant B | 5,374,108 | 713,236 |
| Events in quadrant C | 4,231,338 | 693,421 |
| Events in quadrant D | 4,426,685 | 685,633 |
| Mode M0 | |||
|---|---|---|---|
| Quadrant | BADHDUFLAG | Total packets | Discarded packets |
| A | 0 | 14566 | 2 |
| B | 0 | 20083 | 2 |
| C | 0 | 17009 | 2 |
| D | 0 | 17507 | 4 |
| Mode M9 | |||
|---|---|---|---|
| Quadrant | BADHDUFLAG | Total packets | Discarded packets |
| A | 0 | 15 | 0 |
| B | 0 | 16 | 0 |
| C | 0 | 16 | 0 |
| D | 0 | 16 | 0 |
| Mode SS | |||
|---|---|---|---|
| Quadrant | BADHDUFLAG | Total packets | Discarded packets |
| A | 0 | 128 | 0 |
| B | 0 | 128 | 0 |
| C | 0 | 128 | 0 |
| D | 0 | 128 | 0 |
| Quadrant | Total seconds | Saturated seconds | Saturation percentage |
|---|---|---|---|
| A | 6252 | 109 | 1.743442% |
| B | 6252 | 218 | 3.486884% |
| C | 6252 | 345 | 5.518234% |
| D | 6251 | 165 | 2.639578% |
Noise dominated data is calculated using 1-second bins in cleaned event files. If a bin has >2000 counts, and if more than 50% of those come from <1% of pixels, then it is considered to be noise-dominated and hence unusable.
| Quadrant | # 1 sec bins | Bins with >0 counts | Bins with >2000 counts | High rate bins dominated by noise | Noise dominated (total time) | Noise dominated (detector-on time) | Marked lightcurve |
|---|---|---|---|---|---|---|---|
| A | 7552 | 6253 | 0 | 0 | 0.00% | 0.00% | 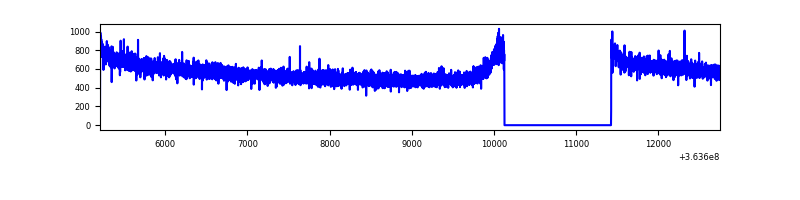 |
| B | 7552 | 6253 | 11 | 11 | 0.15% | 0.18% | 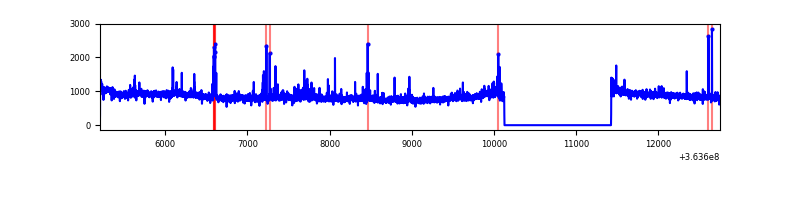 |
| C | 7552 | 6253 | 53 | 53 | 0.70% | 0.85% |  |
| D | 7551 | 6252 | 49 | 49 | 0.65% | 0.78% | 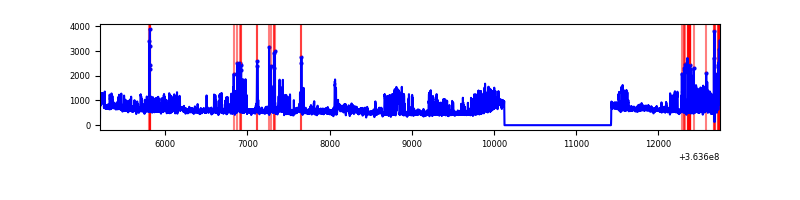 |
Top three noisy pixels from each quadrant. If the there are fewer than three noisy pixels in the level2.evt file, extra rows are filled as -1
| Pixel properties | Quadrant properties | ||||||
|---|---|---|---|---|---|---|---|
| Quadrant | DetID | PixID | Counts | Sigma | Mean | Median | Sigma |
| A | 13 | 254 | 11106 | 56.85 | 919 | 907 | 179.4 |
| A | 3 | 137 | 8192 | 40.61 | 919 | 907 | 179.4 |
| A | 0 | 226 | 7754 | 38.17 | 919 | 907 | 179.4 |
| B | 6 | 159 | 1668431 | 10164.09 | 894 | 876 | 164.1 |
| B | 4 | 80 | 61554 | 369.84 | 894 | 876 | 164.1 |
| B | 0 | 190 | 40741 | 242.99 | 894 | 876 | 164.1 |
| C | 3 | 233 | 440290 | 2257.67 | 859 | 868 | 194.6 |
| C | 0 | 10 | 228276 | 1168.38 | 859 | 868 | 194.6 |
| C | 14 | 238 | 147848 | 755.16 | 859 | 868 | 194.6 |
| D | 8 | 195 | 855178 | 3824.11 | 884 | 868 | 223.4 |
| D | 2 | 250 | 96378 | 427.53 | 884 | 868 | 223.4 |
| D | 12 | 233 | 94686 | 419.95 | 884 | 868 | 223.4 |
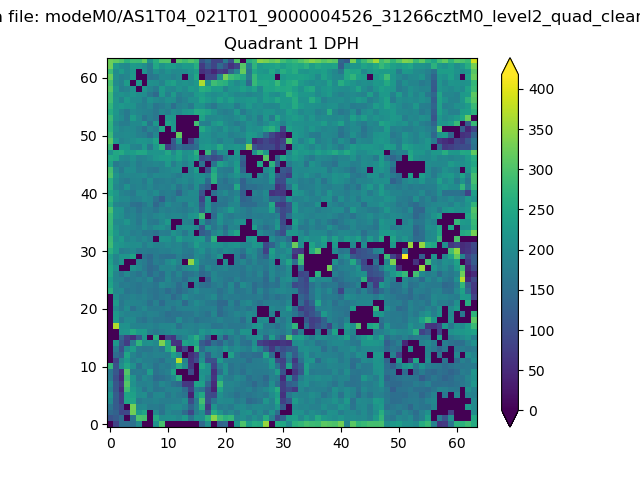
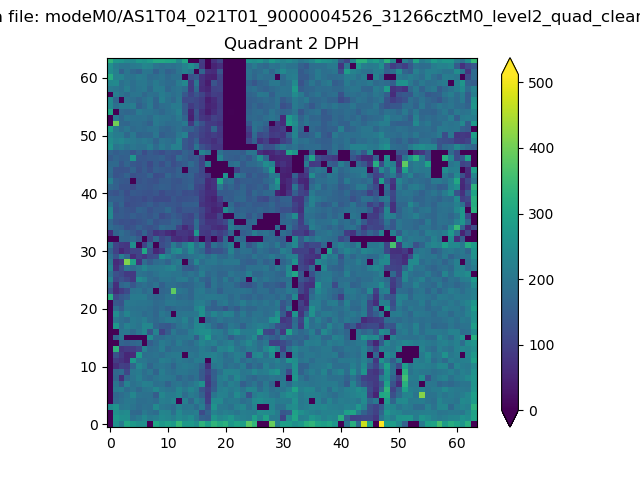
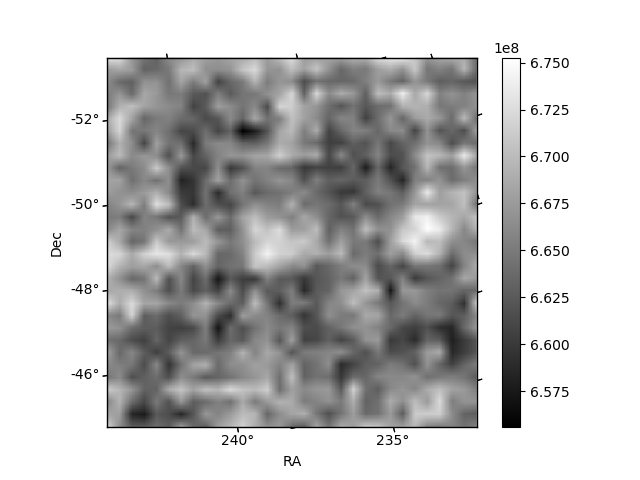
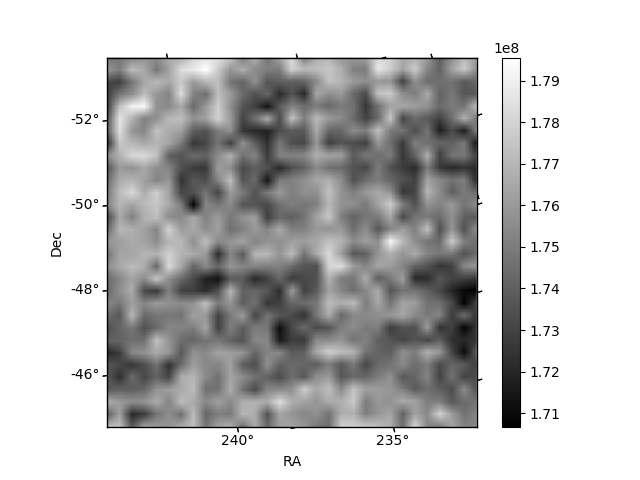
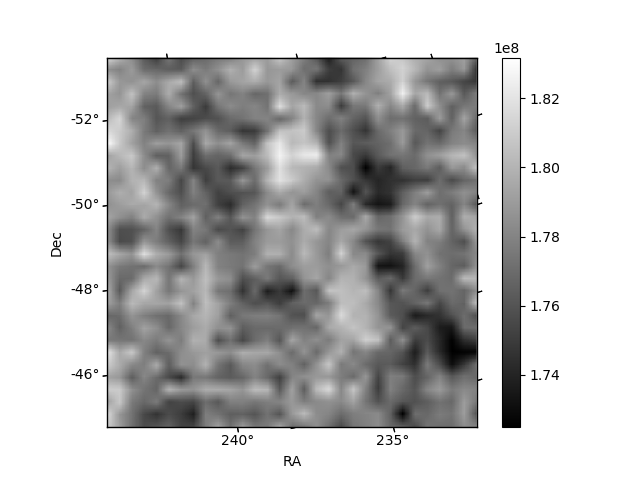
Histogram calculated using DETX and DETY for each event in the final _common_clean file
| Quadrant A | 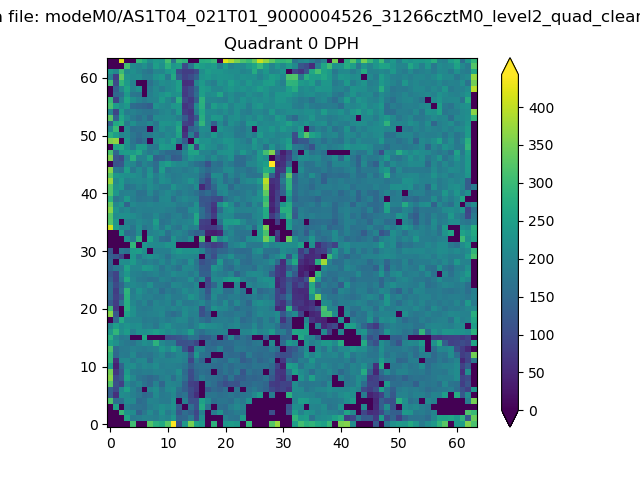 |
 |
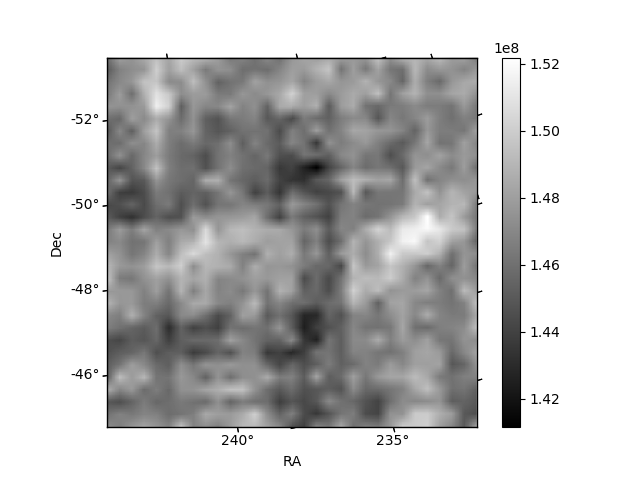
Quadrant B |
|---|---|---|---|
| Quadrant D | 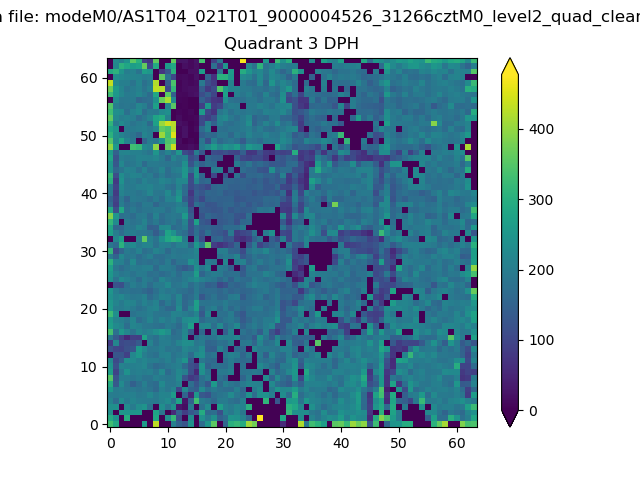 |
 |
Quadrant C |
| Plot type | Count rate plots | Images |
|---|---|---|
| Comparison with Poisson distribution Blue bars denote a histogram of data divided into 1 sec bins. Red curve is a Poisson curve with rate = median count rate of data. |
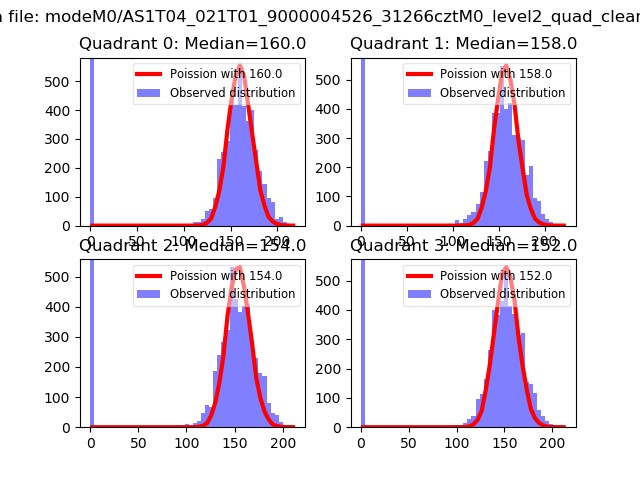 |
 |
| Quadrant-wise count rates Data is divided into 100 sec bins |
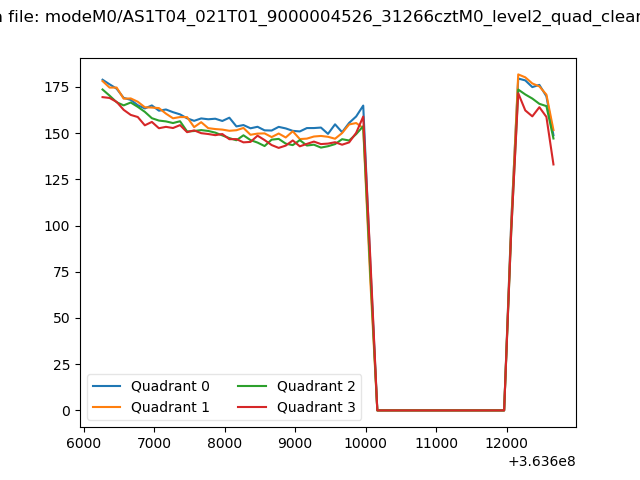 |
|
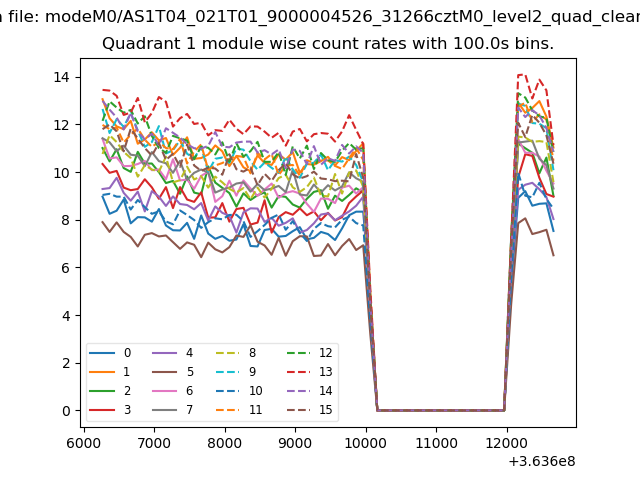
| Module-wise count rates for Quadrant A Data is divided into 100 sec bins |
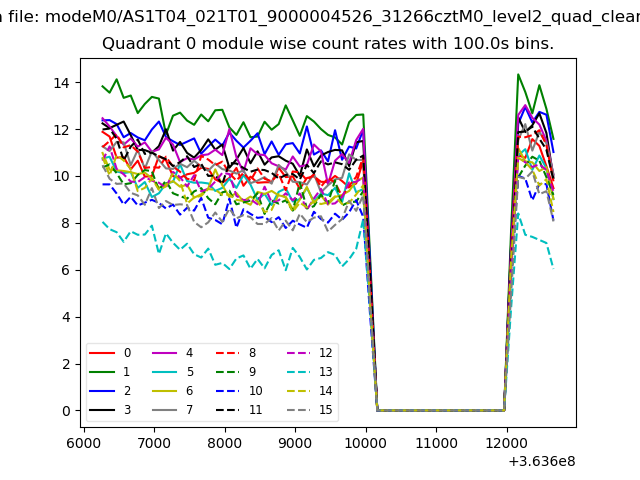 |
 |
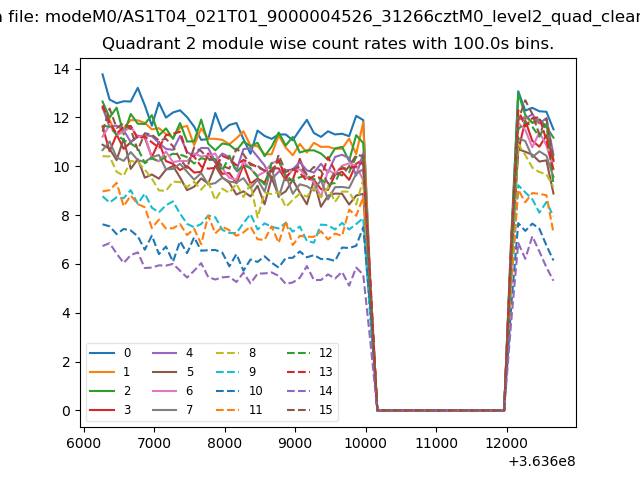
| Module-wise count rates for Quadrant B Data is divided into 100 sec bins |
 |
 |
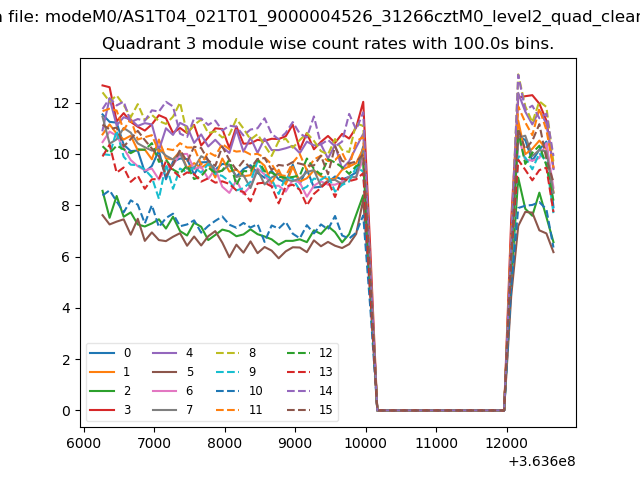
| Module-wise count rates for Quadrant C Data is divided into 100 sec bins |
 |
 |
| Module-wise count rates for Quadrant D Data is divided into 100 sec bins |
 |
 |
| Parameter | Plot |
|---|---|
| CZT HV Monitor | 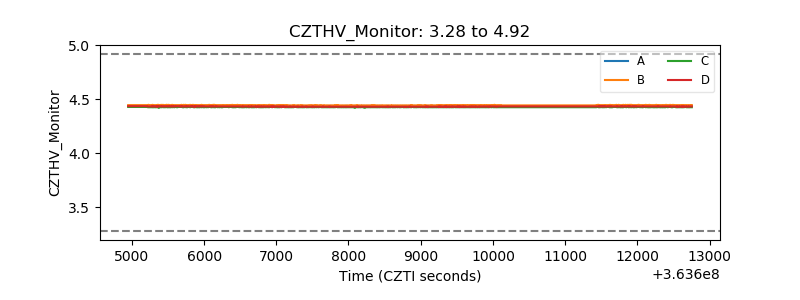 |
| D_VDD | 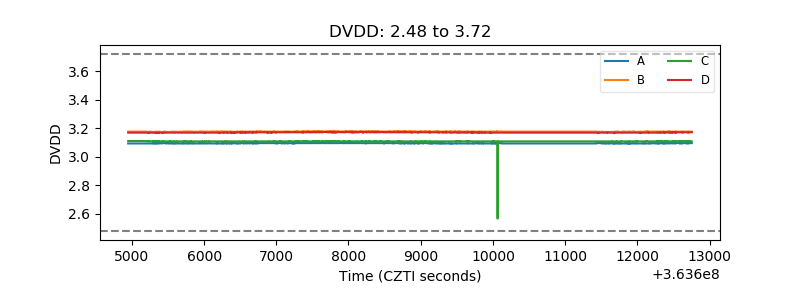 |
| Temperature 1 |  |
| Veto HV Monitor |  |
| Veto LLD | 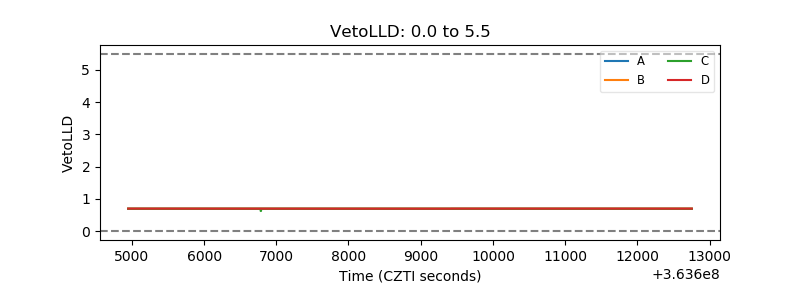 |
| Alpha Counter | 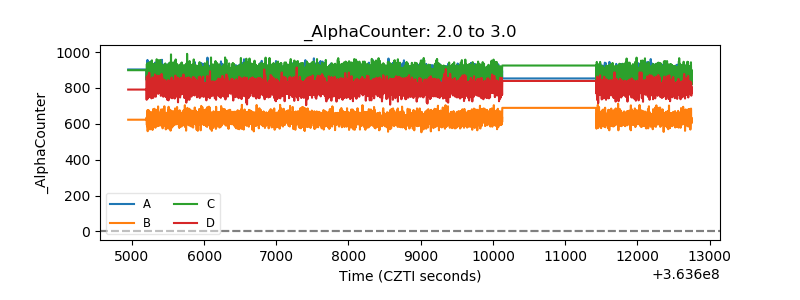 |
| _CPM_Rate | 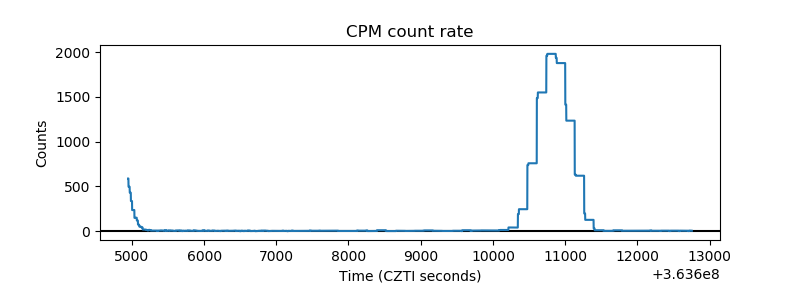 |
| CZT Counter | 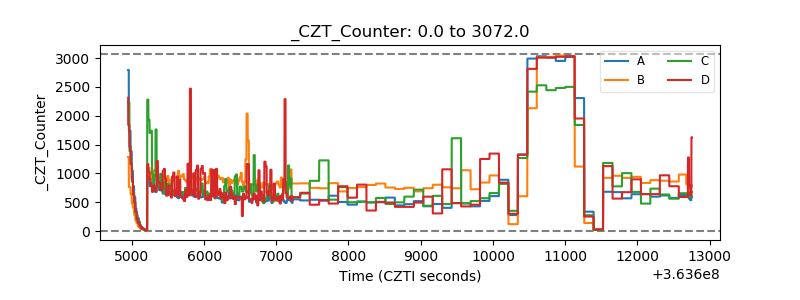 |
| +2.5 Volts monitor |  |
| +5 Volts monitor |  |
| _ROLL_ROT | 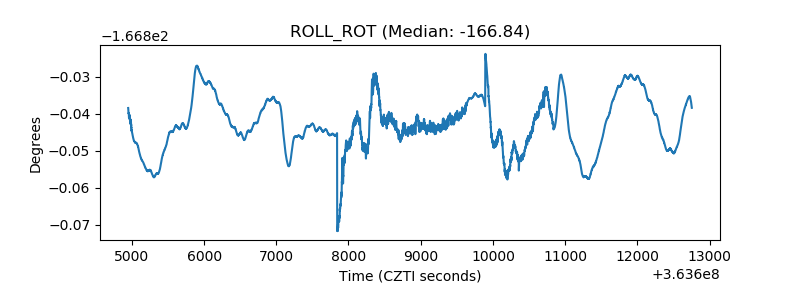 |
| _Roll_DEC | 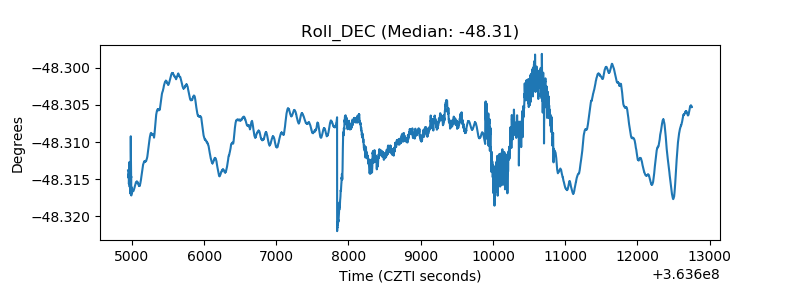 |
| _Roll_RA | 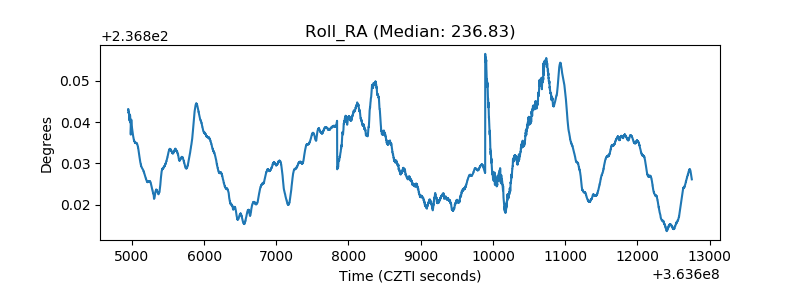 |
| Veto Counter | 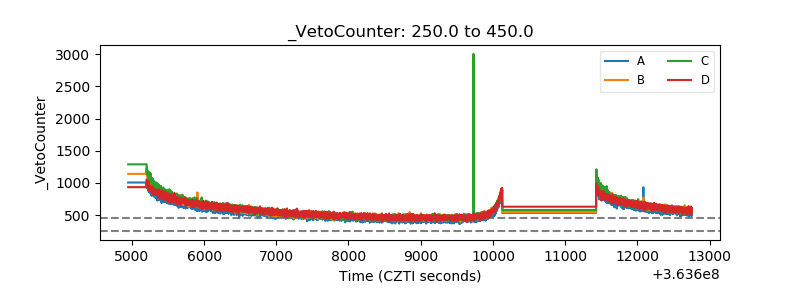 |