| Param | Original file | Final file |
|---|---|---|
| Filename | modeM0/AS1T04_021T01_9000004526_31267cztM0_level2.evt | modeM0/AS1T04_021T01_9000004526_31267cztM0_level2_quad_clean.evt |
| Size (bytes) | 552,499,200 | 124,300,800 |
| Size | 526.9 MB | 118.5 MB |
| Events in quadrant A | 3,219,124 | 864,743 |
| Events in quadrant B | 5,126,117 | 845,597 |
| Events in quadrant C | 3,847,106 | 819,925 |
| Events in quadrant D | 4,130,164 | 811,465 |
| Mode M0 | |||
|---|---|---|---|
| Quadrant | BADHDUFLAG | Total packets | Discarded packets |
| A | 0 | 13143 | 1 |
| B | 0 | 19127 | 1 |
| C | 0 | 15541 | 1 |
| D | 0 | 16256 | 1 |
| Mode M9 | |||
|---|---|---|---|
| Quadrant | BADHDUFLAG | Total packets | Discarded packets |
| A | 0 | 13 | 0 |
| B | 0 | 13 | 0 |
| C | 0 | 13 | 0 |
| D | 0 | 13 | 0 |
| Mode SS | |||
|---|---|---|---|
| Quadrant | BADHDUFLAG | Total packets | Discarded packets |
| A | 0 | 122 | 0 |
| B | 0 | 122 | 0 |
| C | 0 | 122 | 0 |
| D | 0 | 122 | 0 |
| Quadrant | Total seconds | Saturated seconds | Saturation percentage |
|---|---|---|---|
| A | 6063 | 98 | 1.616362% |
| B | 6064 | 214 | 3.529024% |
| C | 6064 | 218 | 3.594987% |
| D | 6064 | 174 | 2.869393% |
Noise dominated data is calculated using 1-second bins in cleaned event files. If a bin has >2000 counts, and if more than 50% of those come from <1% of pixels, then it is considered to be noise-dominated and hence unusable.
| Quadrant | # 1 sec bins | Bins with >0 counts | Bins with >2000 counts | High rate bins dominated by noise | Noise dominated (total time) | Noise dominated (detector-on time) | Marked lightcurve |
|---|---|---|---|---|---|---|---|
| A | 7333 | 6064 | 0 | 0 | 0.00% | 0.00% |  |
| B | 7334 | 6065 | 34 | 34 | 0.46% | 0.56% | 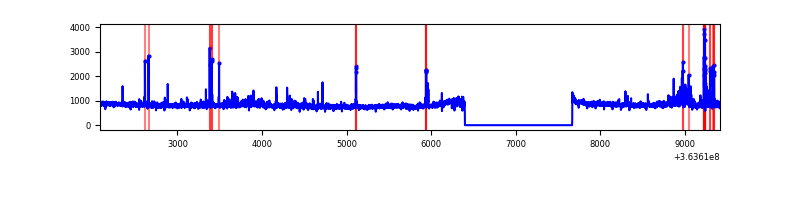 |
| C | 7334 | 6065 | 21 | 21 | 0.29% | 0.35% | 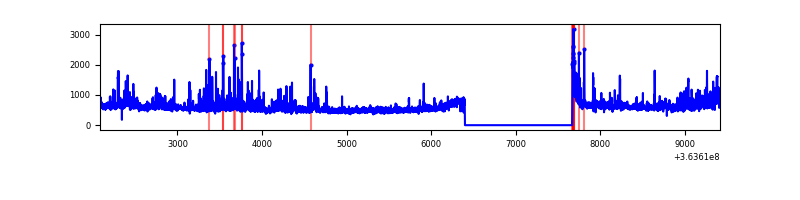 |
| D | 7334 | 6065 | 74 | 74 | 1.01% | 1.22% | 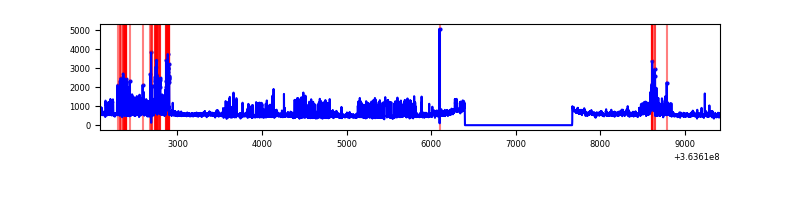 |
Top three noisy pixels from each quadrant. If the there are fewer than three noisy pixels in the level2.evt file, extra rows are filled as -1
| Pixel properties | Quadrant properties | ||||||
|---|---|---|---|---|---|---|---|
| Quadrant | DetID | PixID | Counts | Sigma | Mean | Median | Sigma |
| A | 13 | 254 | 11068 | 62.31 | 834 | 821 | 164.4 |
| A | 3 | 137 | 7528 | 40.78 | 834 | 821 | 164.4 |
| A | 0 | 226 | 7101 | 38.19 | 834 | 821 | 164.4 |
| B | 6 | 159 | 1630679 | 10775.63 | 807 | 787 | 151.3 |
| B | 0 | 190 | 157208 | 1034.14 | 807 | 787 | 151.3 |
| B | 4 | 80 | 60913 | 397.51 | 807 | 787 | 151.3 |
| C | 3 | 233 | 579258 | 3240.42 | 779 | 785 | 178.5 |
| C | 14 | 238 | 129722 | 722.26 | 779 | 785 | 178.5 |
| C | 0 | 10 | 76838 | 426.02 | 779 | 785 | 178.5 |
| D | 8 | 195 | 779177 | 3770.32 | 792 | 782 | 206.5 |
| D | 12 | 233 | 199756 | 963.77 | 792 | 782 | 206.5 |
| D | 2 | 250 | 105590 | 507.66 | 792 | 782 | 206.5 |
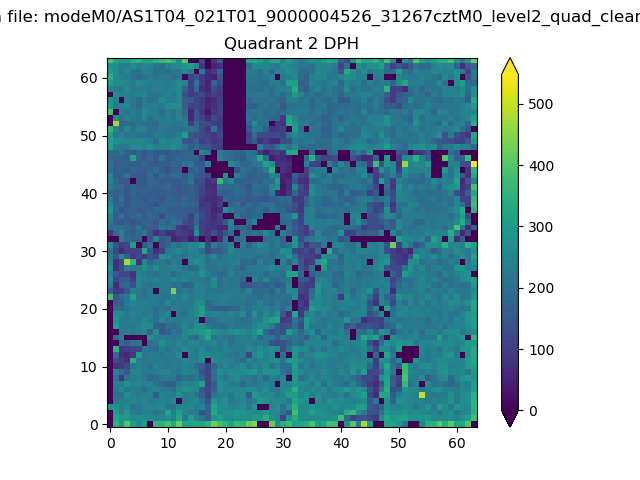
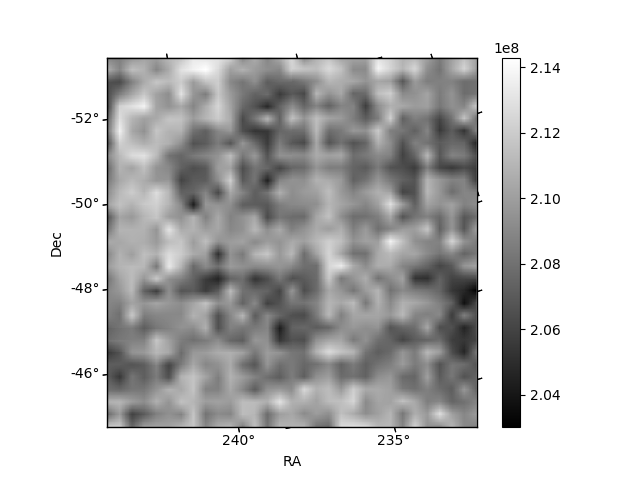
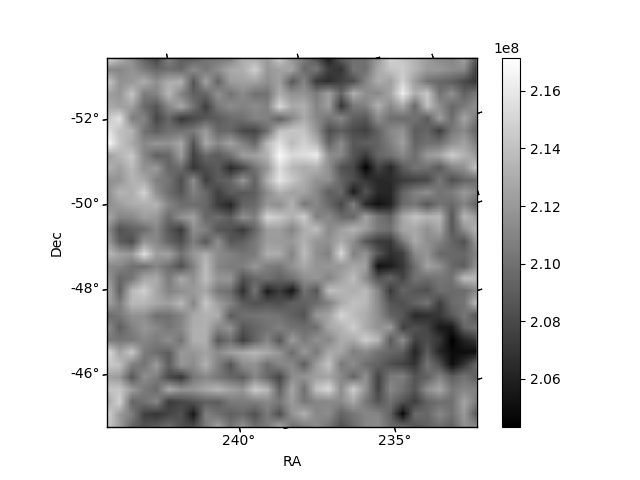
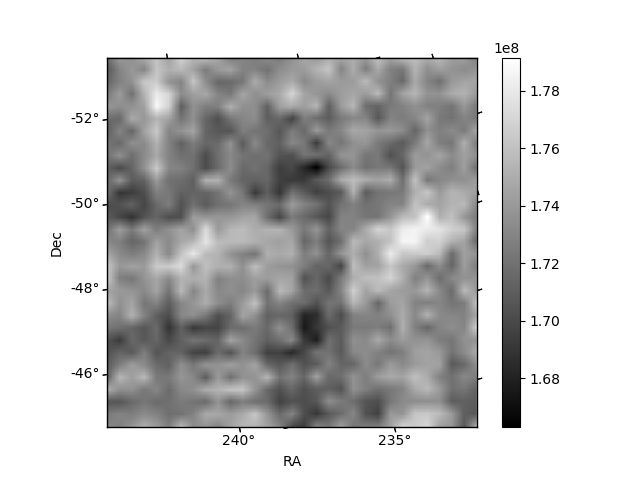
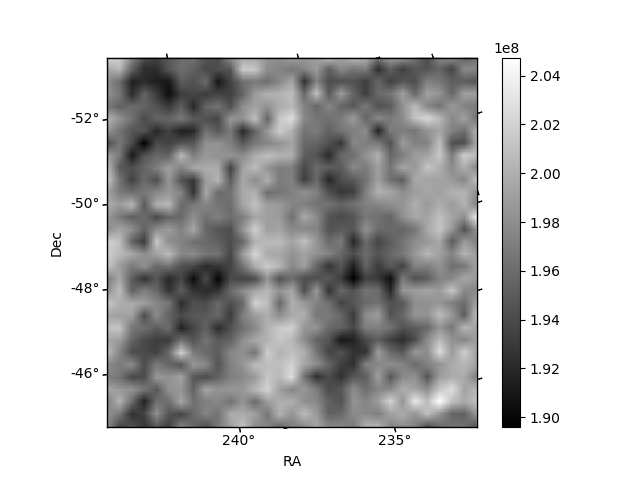
Histogram calculated using DETX and DETY for each event in the final _common_clean file
| Quadrant A | 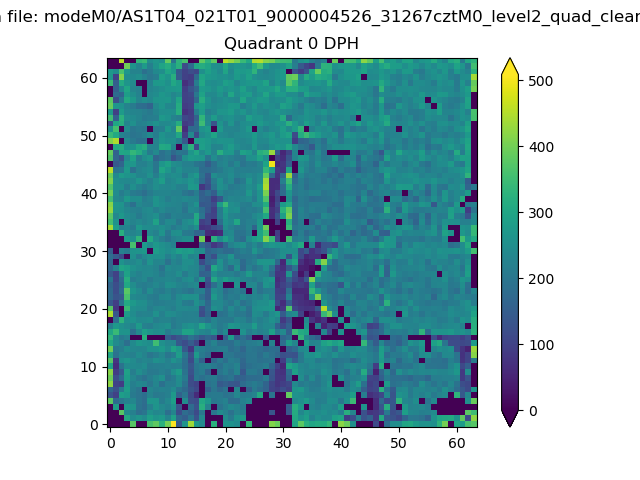 |
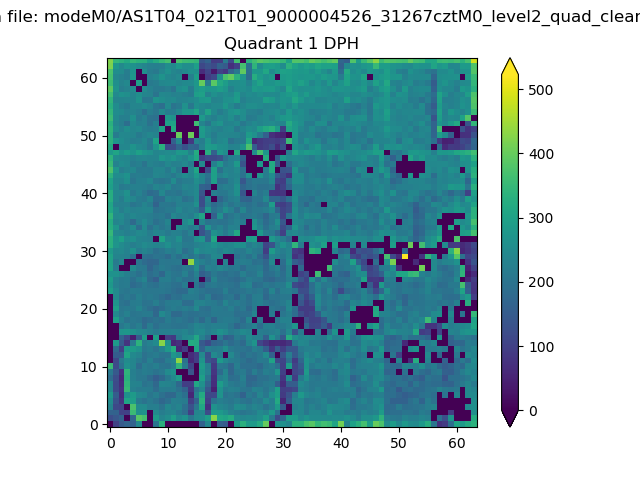 |
Quadrant B |
|---|---|---|---|
| Quadrant D | 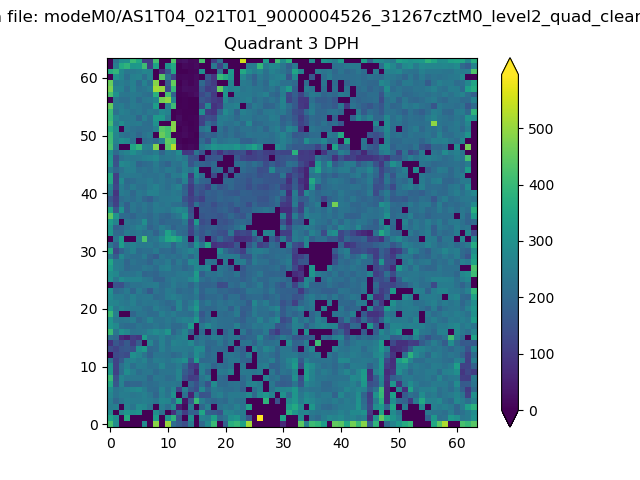 |
 |
Quadrant C |
| Plot type | Count rate plots | Images |
|---|---|---|
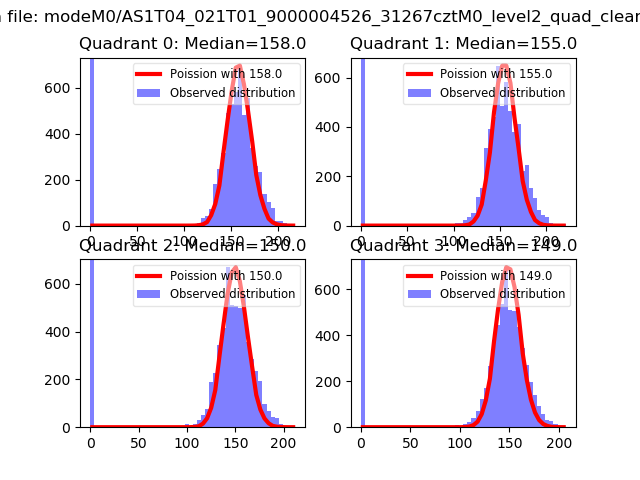
| Comparison with Poisson distribution Blue bars denote a histogram of data divided into 1 sec bins. Red curve is a Poisson curve with rate = median count rate of data. |
 |
 |
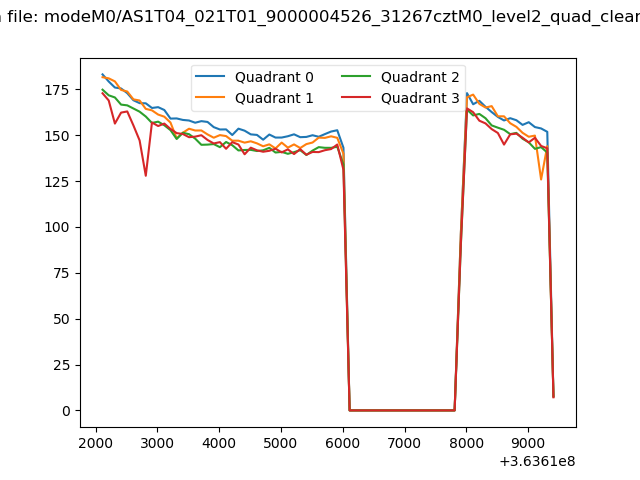
| Quadrant-wise count rates Data is divided into 100 sec bins |
 |
|
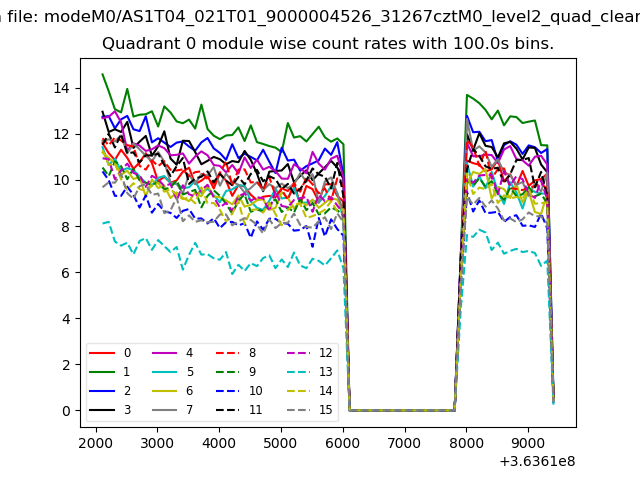
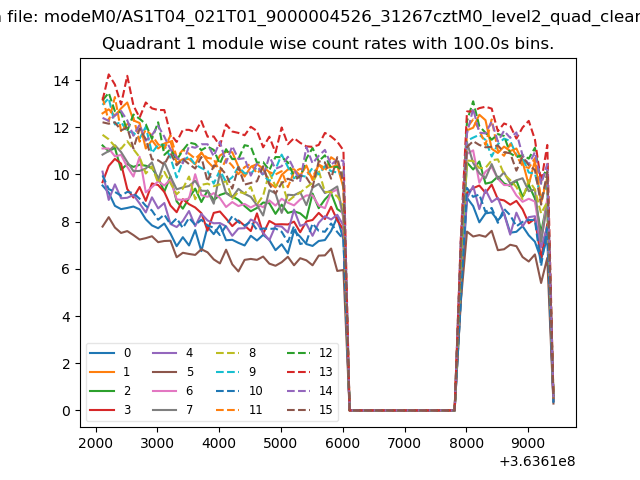
| Module-wise count rates for Quadrant A Data is divided into 100 sec bins |
 |
 |
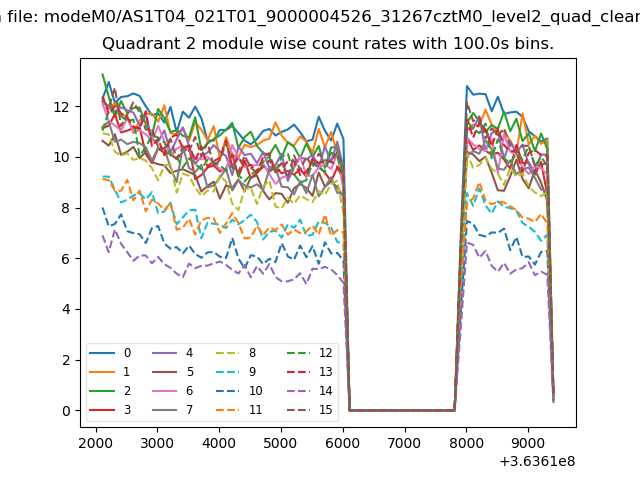
| Module-wise count rates for Quadrant B Data is divided into 100 sec bins |
 |
 |
| Module-wise count rates for Quadrant C Data is divided into 100 sec bins |
 |
 |
| Module-wise count rates for Quadrant D Data is divided into 100 sec bins |
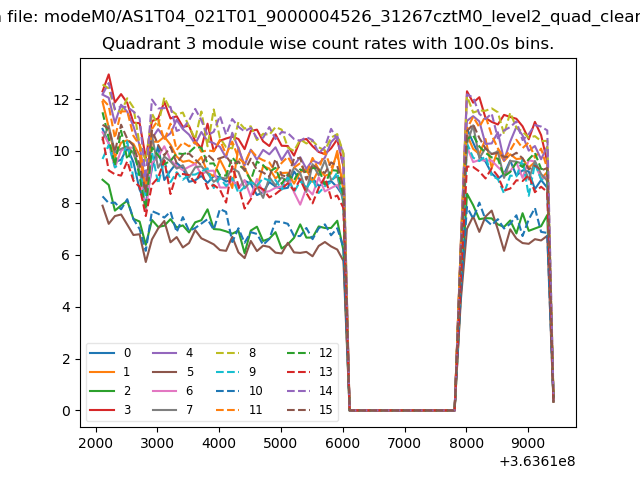 |
 |
| Parameter | Plot |
|---|---|
| CZT HV Monitor | 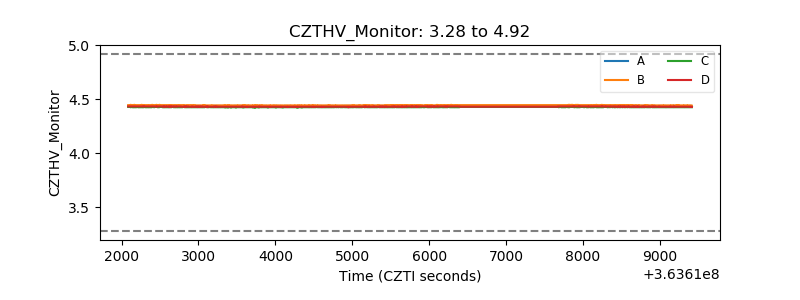 |
| D_VDD | 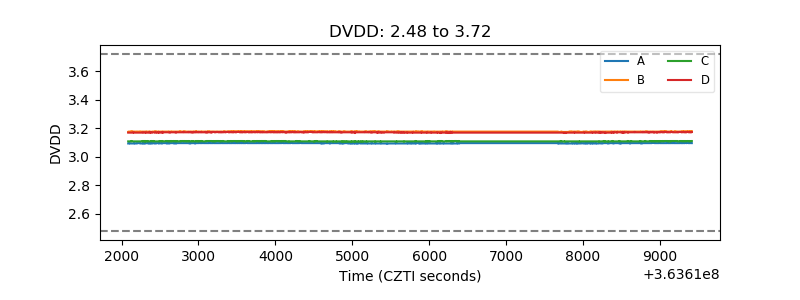 |
| Temperature 1 | 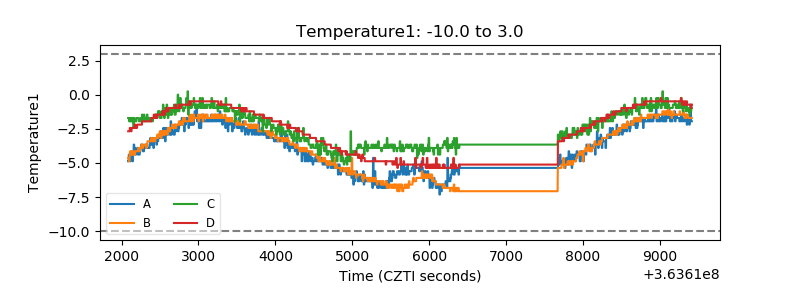 |
| Veto HV Monitor | 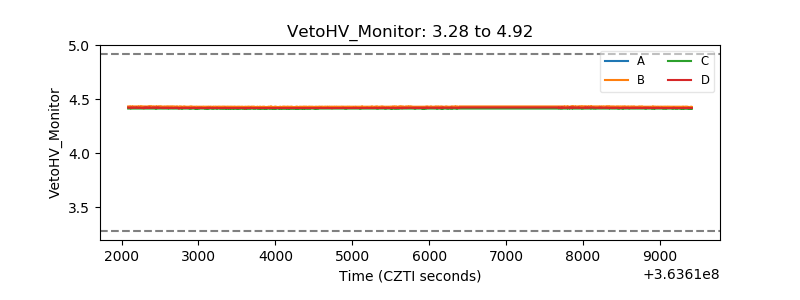 |
| Veto LLD | 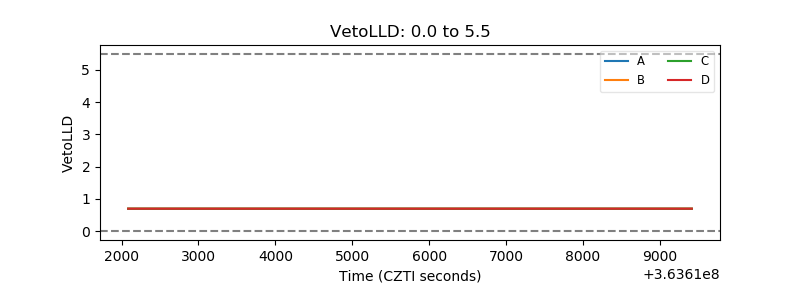 |
| Alpha Counter | 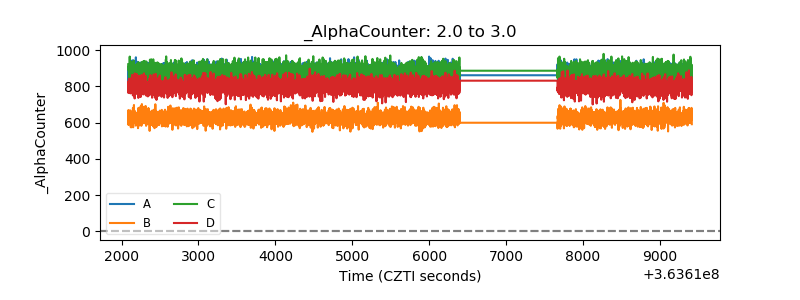 |
| _CPM_Rate | 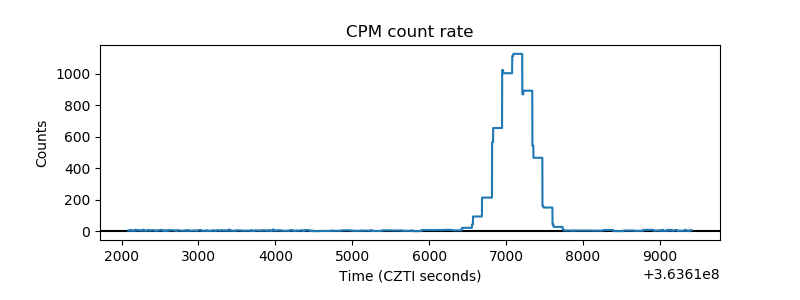 |
| CZT Counter | 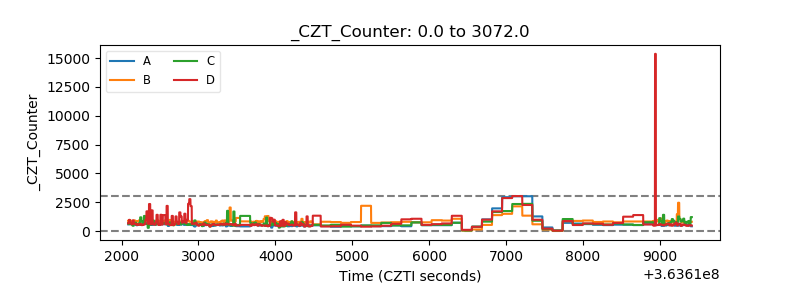 |
| +2.5 Volts monitor |  |
| +5 Volts monitor |  |
| _ROLL_ROT | 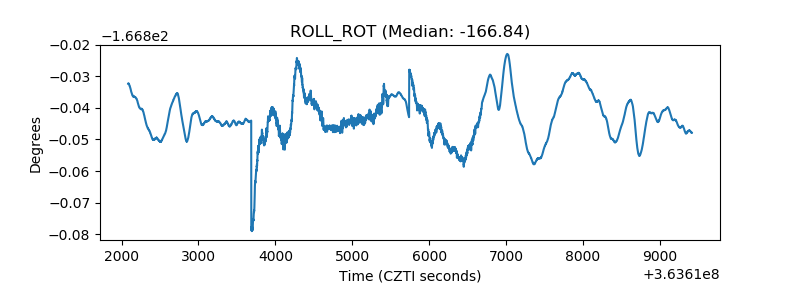 |
| _Roll_DEC |  |
| _Roll_RA | 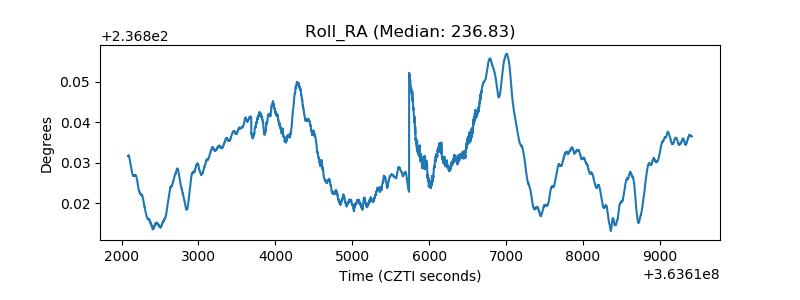 |
| Veto Counter | 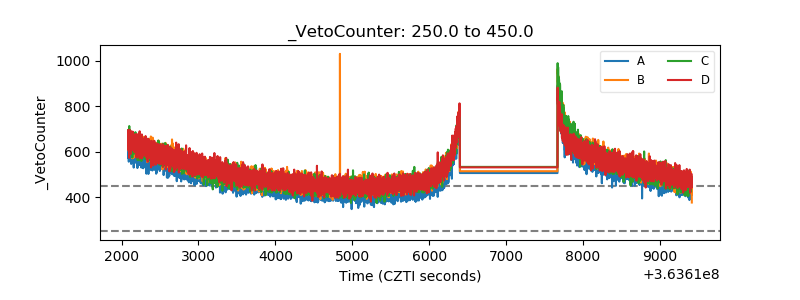 |