| Param | Original file | Final file |
|---|---|---|
| Filename | modeM0/AS1T04_021T01_9000004526_31269cztM0_level2.evt | modeM0/AS1T04_021T01_9000004526_31269cztM0_level2_quad_clean.evt |
| Size (bytes) | 609,494,400 | 106,770,240 |
| Size | 581.3 MB | 101.8 MB |
| Events in quadrant A | 3,301,114 | 718,549 |
| Events in quadrant B | 6,064,545 | 689,366 |
| Events in quadrant C | 4,496,664 | 673,680 |
| Events in quadrant D | 4,134,428 | 676,104 |
| Mode M0 | |||
|---|---|---|---|
| Quadrant | BADHDUFLAG | Total packets | Discarded packets |
| A | 0 | 14064 | 1 |
| B | 0 | 22773 | 1 |
| C | 0 | 17888 | 1 |
| D | 0 | 16801 | 1 |
| Mode M9 | |||
|---|---|---|---|
| Quadrant | BADHDUFLAG | Total packets | Discarded packets |
| A | 0 | 7 | 0 |
| B | 0 | 7 | 0 |
| C | 0 | 7 | 0 |
| D | 0 | 7 | 0 |
| Mode SS | |||
|---|---|---|---|
| Quadrant | BADHDUFLAG | Total packets | Discarded packets |
| A | 0 | 140 | 0 |
| B | 0 | 140 | 0 |
| C | 0 | 140 | 0 |
| D | 0 | 140 | 0 |
| Quadrant | Total seconds | Saturated seconds | Saturation percentage |
|---|---|---|---|
| A | 6823 | 77 | 1.128536% |
| B | 6822 | 360 | 5.277045% |
| C | 6822 | 329 | 4.822633% |
| D | 6823 | 81 | 1.187161% |
Noise dominated data is calculated using 1-second bins in cleaned event files. If a bin has >2000 counts, and if more than 50% of those come from <1% of pixels, then it is considered to be noise-dominated and hence unusable.
| Quadrant | # 1 sec bins | Bins with >0 counts | Bins with >2000 counts | High rate bins dominated by noise | Noise dominated (total time) | Noise dominated (detector-on time) | Marked lightcurve |
|---|---|---|---|---|---|---|---|
| A | 7533 | 6825 | 0 | 0 | 0.00% | 0.00% | 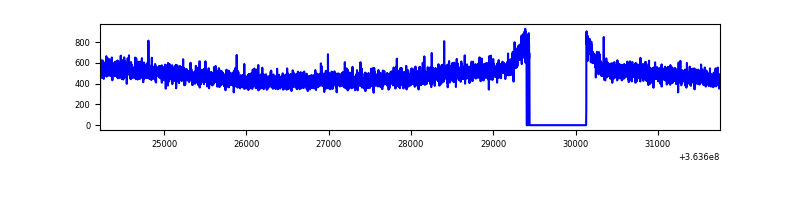 |
| B | 7532 | 6824 | 147 | 147 | 1.95% | 2.15% | 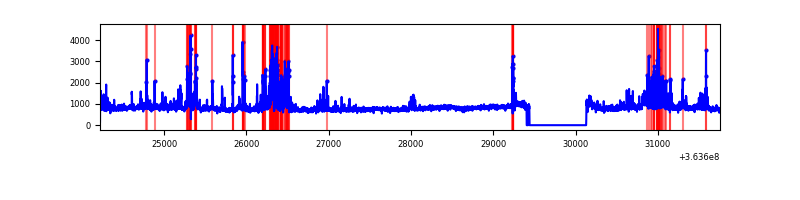 |
| C | 7532 | 6824 | 84 | 84 | 1.12% | 1.23% |  |
| D | 7533 | 6825 | 21 | 21 | 0.28% | 0.31% | 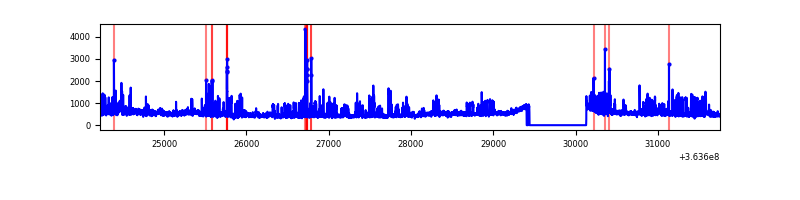 |
Top three noisy pixels from each quadrant. If the there are fewer than three noisy pixels in the level2.evt file, extra rows are filled as -1
| Pixel properties | Quadrant properties | ||||||
|---|---|---|---|---|---|---|---|
| Quadrant | DetID | PixID | Counts | Sigma | Mean | Median | Sigma |
| A | 13 | 254 | 13170 | 71.93 | 855 | 839 | 171.4 |
| A | 3 | 137 | 8410 | 44.17 | 855 | 839 | 171.4 |
| A | 0 | 226 | 7307 | 37.73 | 855 | 839 | 171.4 |
| B | 6 | 159 | 1915897 | 12095.17 | 827 | 806 | 158.3 |
| B | 0 | 190 | 468861 | 2956.1 | 827 | 806 | 158.3 |
| B | 5 | 172 | 154769 | 972.39 | 827 | 806 | 158.3 |
| C | 3 | 233 | 872258 | 4752.19 | 794 | 801 | 183.4 |
| C | 0 | 10 | 339818 | 1848.71 | 794 | 801 | 183.4 |
| C | 14 | 238 | 139308 | 755.3 | 794 | 801 | 183.4 |
| D | 8 | 195 | 781496 | 3634.26 | 813 | 797 | 214.8 |
| D | 2 | 250 | 74756 | 344.29 | 813 | 797 | 214.8 |
| D | 12 | 218 | 48615 | 222.6 | 813 | 797 | 214.8 |
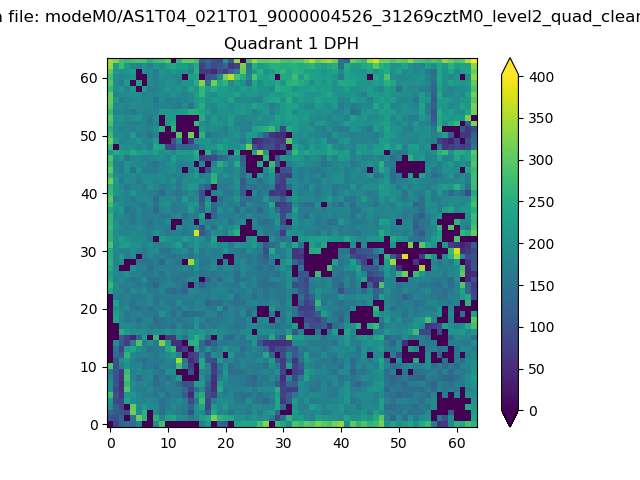
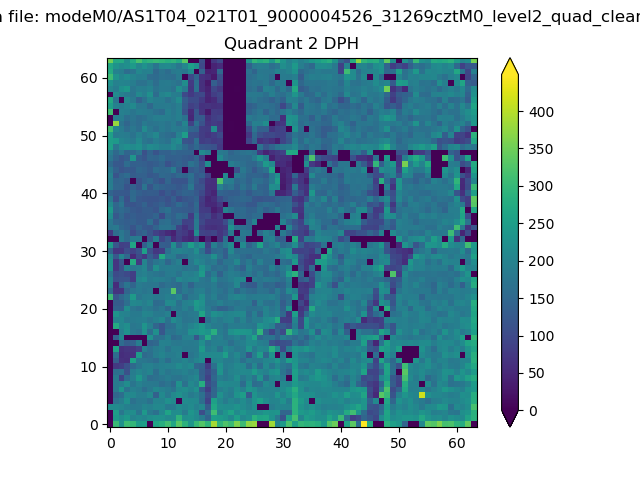
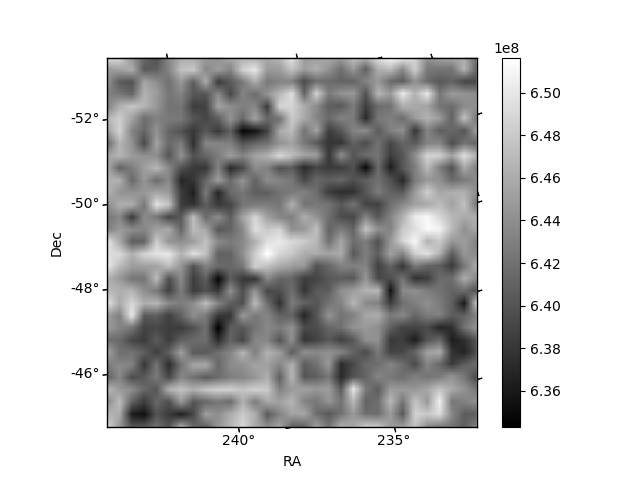
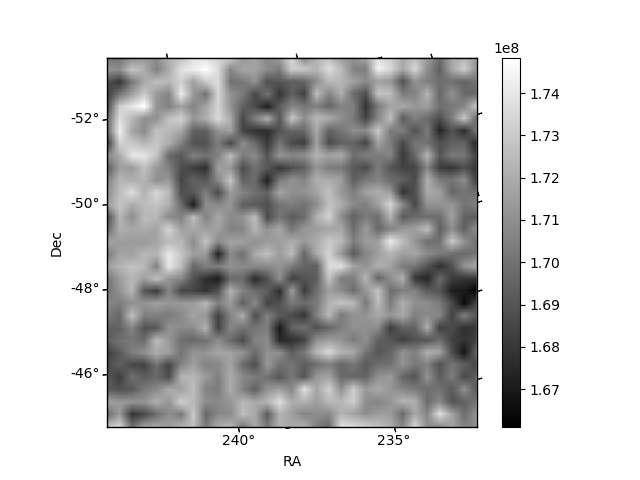
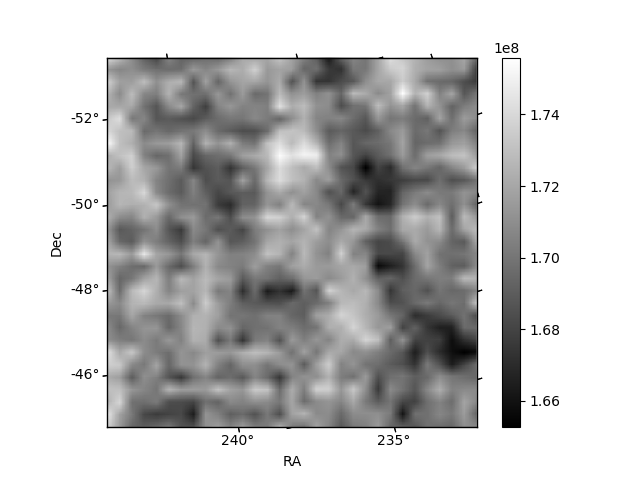
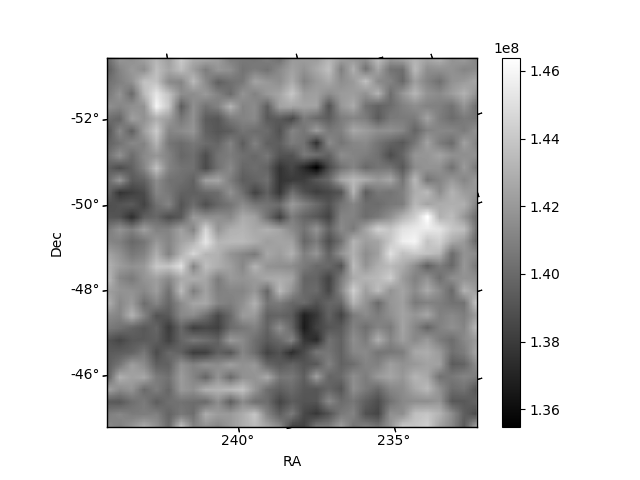
Histogram calculated using DETX and DETY for each event in the final _common_clean file
| Quadrant A | 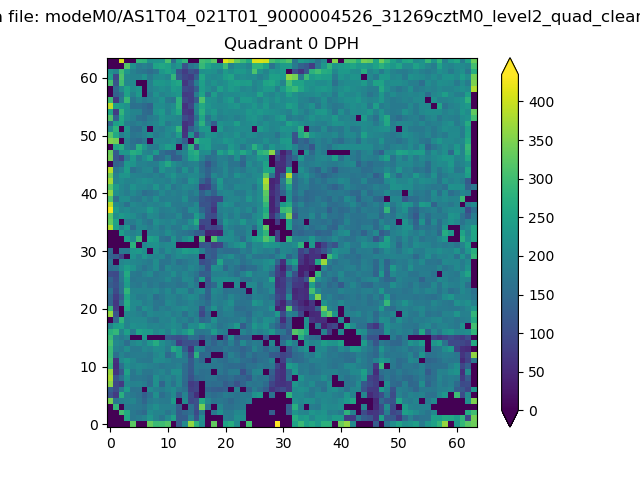 |
 |
Quadrant B |
|---|---|---|---|
| Quadrant D | 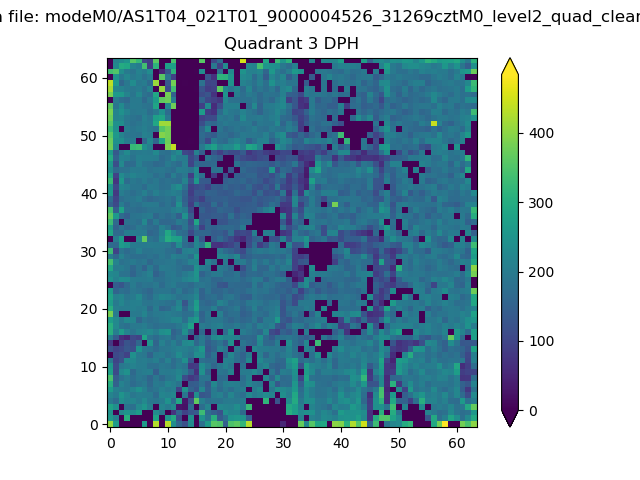 |
 |
Quadrant C |
| Plot type | Count rate plots | Images |
|---|---|---|
| Comparison with Poisson distribution Blue bars denote a histogram of data divided into 1 sec bins. Red curve is a Poisson curve with rate = median count rate of data. |
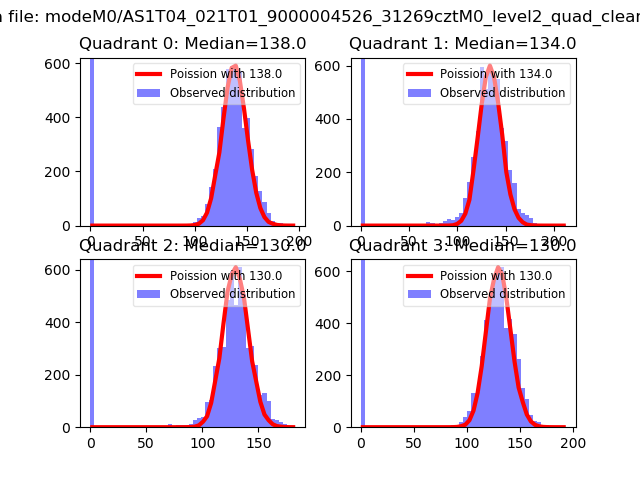 |
 |
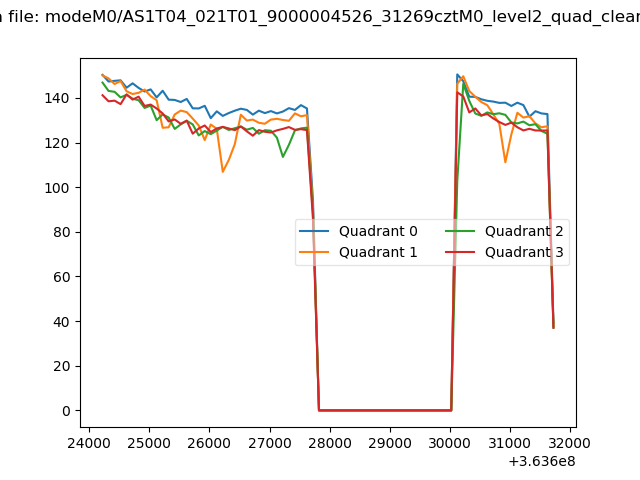
| Quadrant-wise count rates Data is divided into 100 sec bins |
 |
|
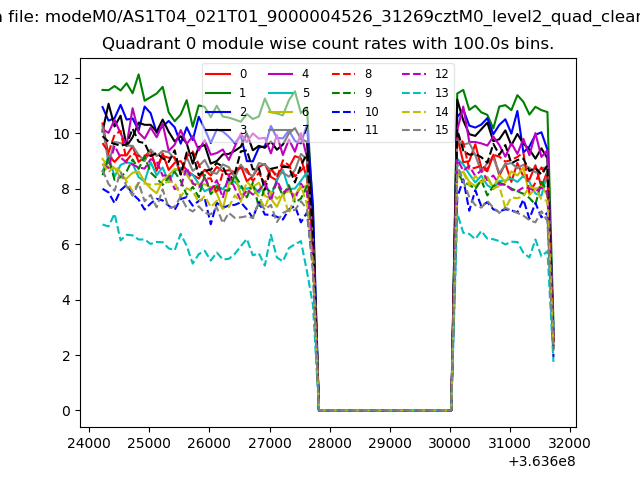
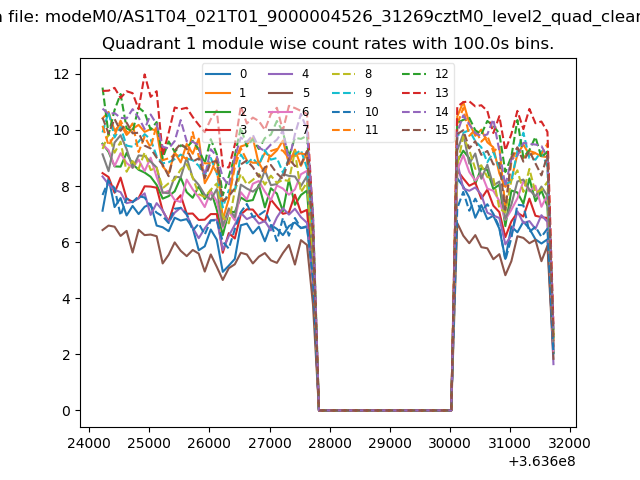
| Module-wise count rates for Quadrant A Data is divided into 100 sec bins |
 |
 |
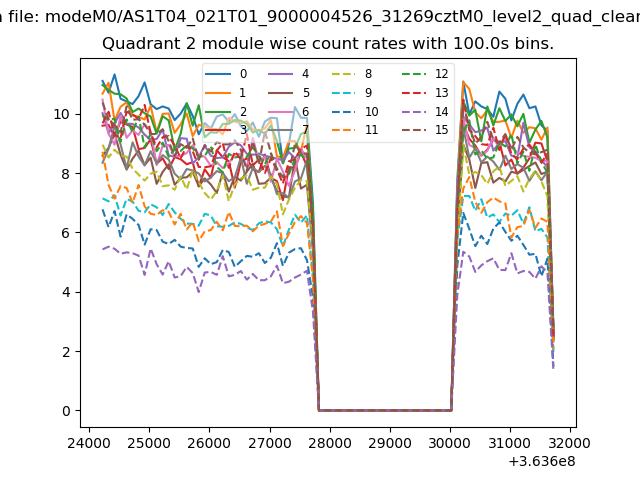
| Module-wise count rates for Quadrant B Data is divided into 100 sec bins |
 |
 |
| Module-wise count rates for Quadrant C Data is divided into 100 sec bins |
 |
 |
| Module-wise count rates for Quadrant D Data is divided into 100 sec bins |
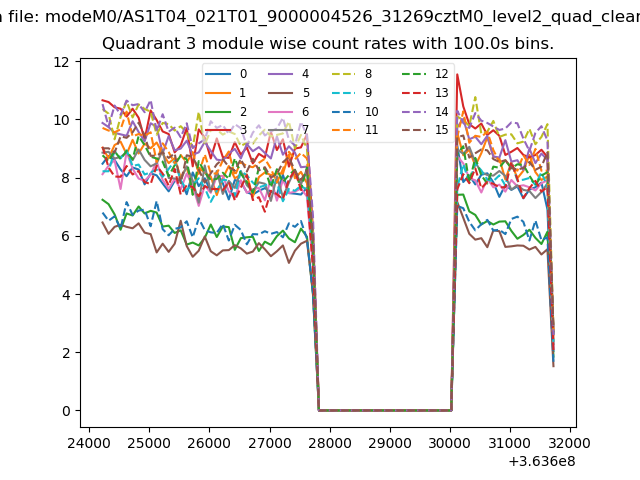 |
 |
| Parameter | Plot |
|---|---|
| CZT HV Monitor | 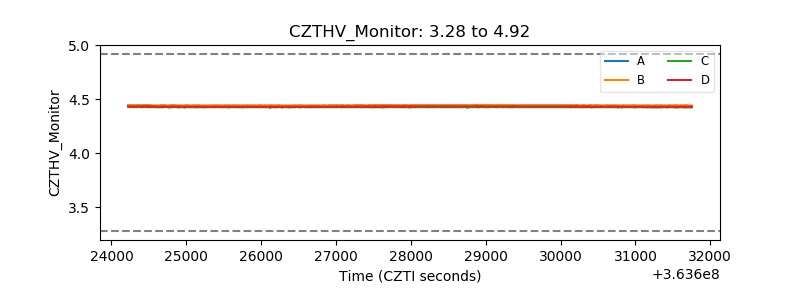 |
| D_VDD | 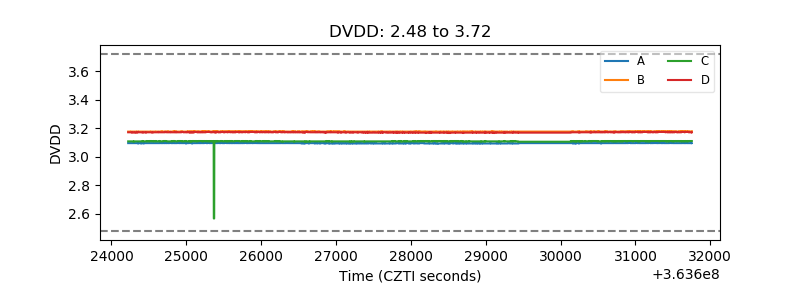 |
| Temperature 1 |  |
| Veto HV Monitor |  |
| Veto LLD | 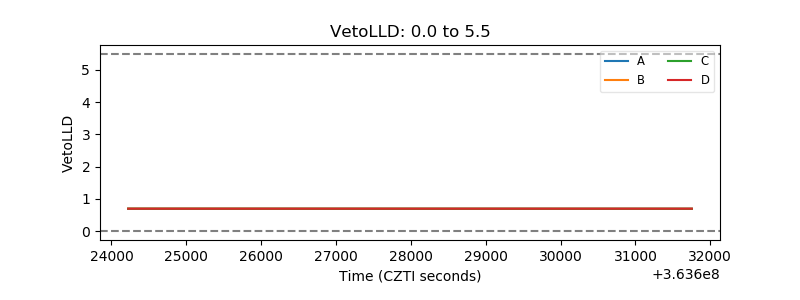 |
| Alpha Counter | 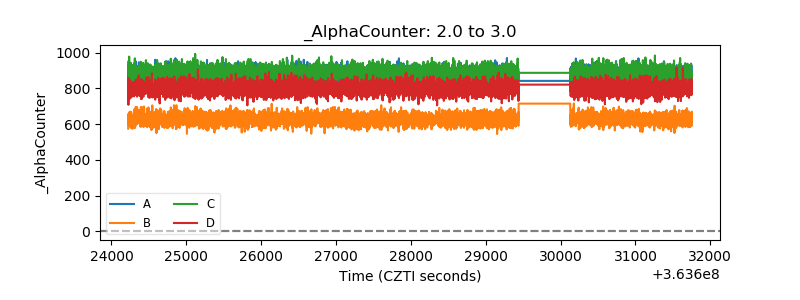 |
| _CPM_Rate | 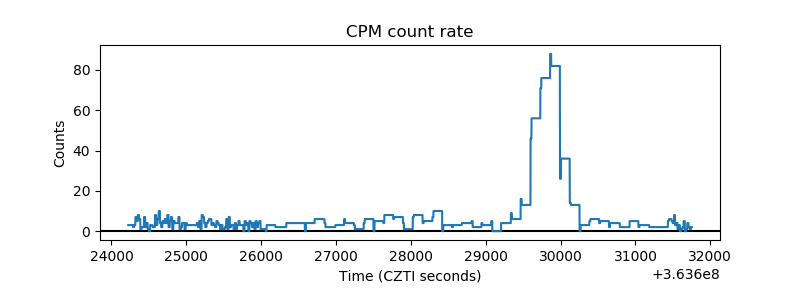 |
| CZT Counter | 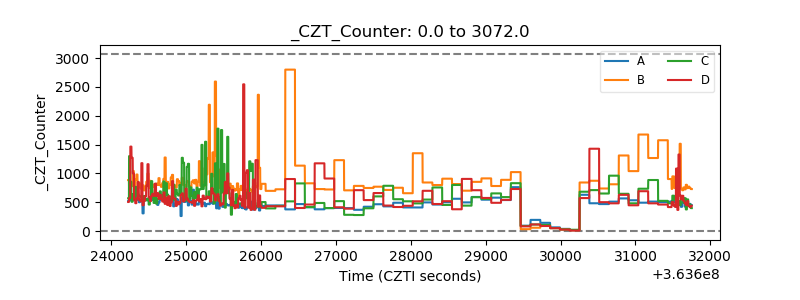 |
| +2.5 Volts monitor |  |
| +5 Volts monitor | 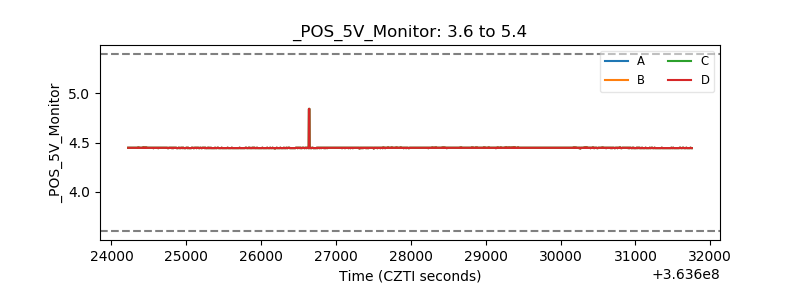 |
| _ROLL_ROT | 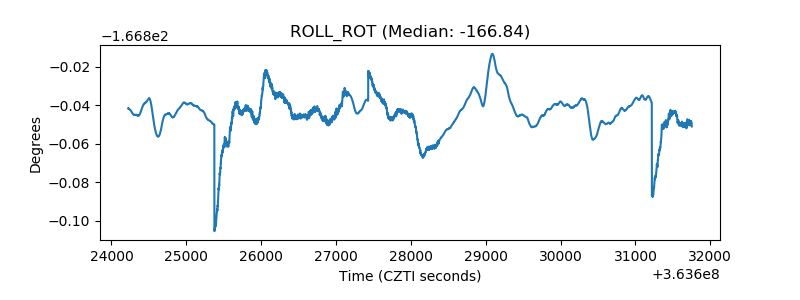 |
| _Roll_DEC |  |
| _Roll_RA | 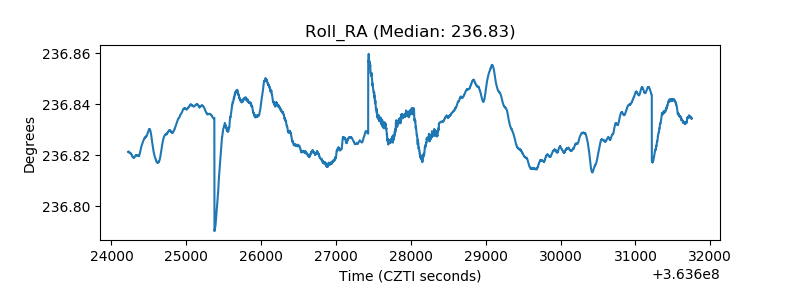 |
| Veto Counter | 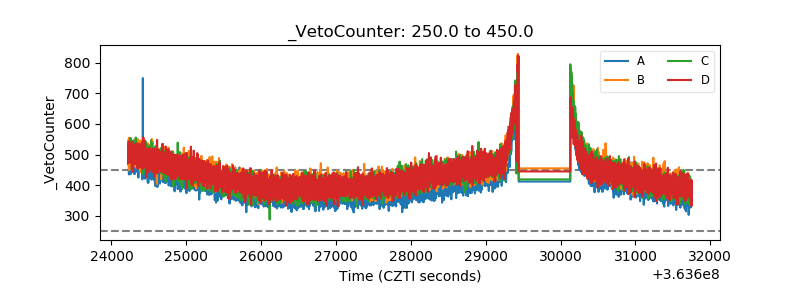 |