| Param | Original file | Final file |
|---|---|---|
| Filename | modeM0/AS1T04_021T01_9000004526_31271cztM0_level2.evt | modeM0/AS1T04_021T01_9000004526_31271cztM0_level2_quad_clean.evt |
| Size (bytes) | 529,712,640 | 86,448,960 |
| Size | 505.2 MB | 82.4 MB |
| Events in quadrant A | 2,909,679 | 569,702 |
| Events in quadrant B | 5,437,708 | 543,695 |
| Events in quadrant C | 3,300,716 | 542,373 |
| Events in quadrant D | 3,981,127 | 536,363 |
| Mode M0 | |||
|---|---|---|---|
| Quadrant | BADHDUFLAG | Total packets | Discarded packets |
| A | 0 | 12609 | 1 |
| B | 0 | 20406 | 1 |
| C | 0 | 13718 | 1 |
| D | 0 | 15940 | 1 |
| Mode M9 | |||
|---|---|---|---|
| Quadrant | BADHDUFLAG | Total packets | Discarded packets |
| A | 0 | 3 | 0 |
| B | 0 | 3 | 0 |
| C | 0 | 3 | 0 |
| D | 0 | 3 | 0 |
| Mode SS | |||
|---|---|---|---|
| Quadrant | BADHDUFLAG | Total packets | Discarded packets |
| A | 0 | 124 | 0 |
| B | 0 | 124 | 0 |
| C | 0 | 124 | 0 |
| D | 0 | 124 | 0 |
| Quadrant | Total seconds | Saturated seconds | Saturation percentage |
|---|---|---|---|
| A | 6096 | 47 | 0.770997% |
| B | 6097 | 357 | 5.855339% |
| C | 6097 | 125 | 2.050189% |
| D | 6097 | 73 | 1.197310% |
Noise dominated data is calculated using 1-second bins in cleaned event files. If a bin has >2000 counts, and if more than 50% of those come from <1% of pixels, then it is considered to be noise-dominated and hence unusable.
| Quadrant | # 1 sec bins | Bins with >0 counts | Bins with >2000 counts | High rate bins dominated by noise | Noise dominated (total time) | Noise dominated (detector-on time) | Marked lightcurve |
|---|---|---|---|---|---|---|---|
| A | 6421 | 6097 | 0 | 0 | 0.00% | 0.00% | 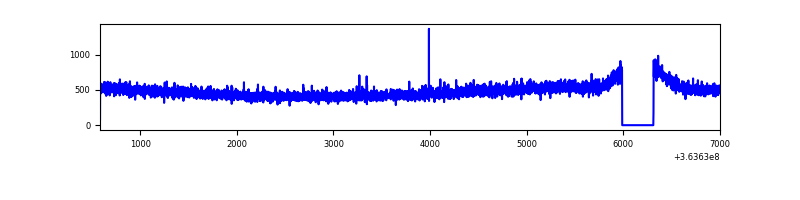 |
| B | 6422 | 6098 | 155 | 155 | 2.41% | 2.54% | 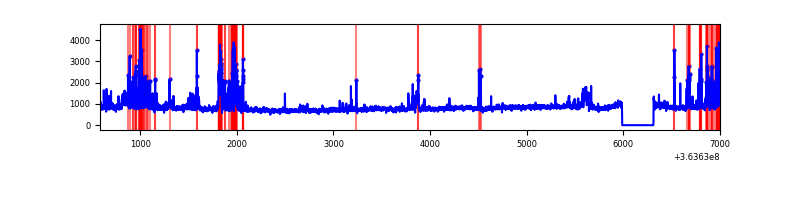 |
| C | 6422 | 6098 | 4 | 4 | 0.06% | 0.07% | 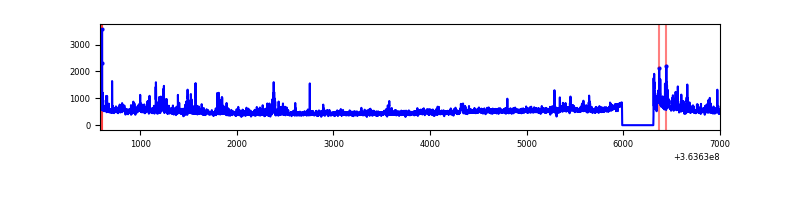 |
| D | 6422 | 6098 | 20 | 20 | 0.31% | 0.33% | 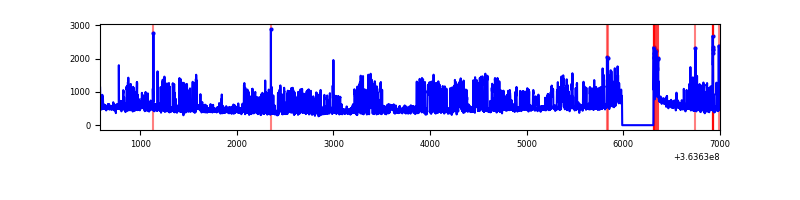 |
Top three noisy pixels from each quadrant. If the there are fewer than three noisy pixels in the level2.evt file, extra rows are filled as -1
| Pixel properties | Quadrant properties | ||||||
|---|---|---|---|---|---|---|---|
| Quadrant | DetID | PixID | Counts | Sigma | Mean | Median | Sigma |
| A | 13 | 254 | 11992 | 74.16 | 753 | 738 | 151.8 |
| A | 3 | 137 | 7735 | 46.11 | 753 | 738 | 151.8 |
| A | 0 | 226 | 6422 | 37.45 | 753 | 738 | 151.8 |
| B | 6 | 159 | 1728044 | 12232.81 | 730 | 711 | 141.2 |
| B | 5 | 172 | 369072 | 2608.7 | 730 | 711 | 141.2 |
| B | 0 | 190 | 257811 | 1820.76 | 730 | 711 | 141.2 |
| C | 3 | 233 | 306902 | 1841.85 | 714 | 717 | 166.2 |
| C | 14 | 238 | 118074 | 705.96 | 714 | 717 | 166.2 |
| C | 0 | 10 | 54906 | 325.97 | 714 | 717 | 166.2 |
| D | 8 | 195 | 1050366 | 5514.88 | 715 | 701 | 190.3 |
| D | 12 | 218 | 60714 | 315.3 | 715 | 701 | 190.3 |
| D | 12 | 233 | 50143 | 259.77 | 715 | 701 | 190.3 |
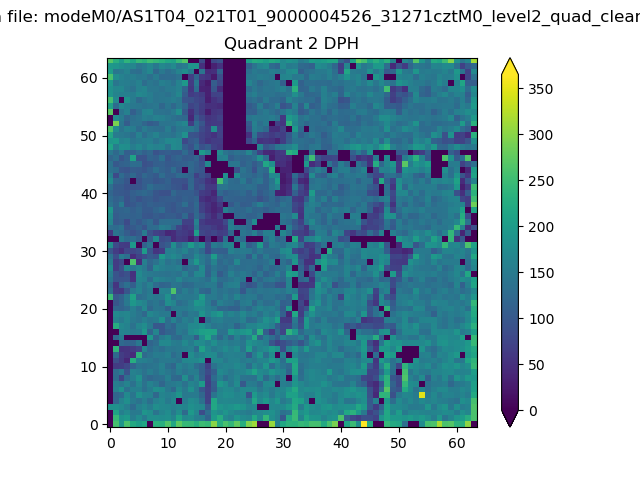
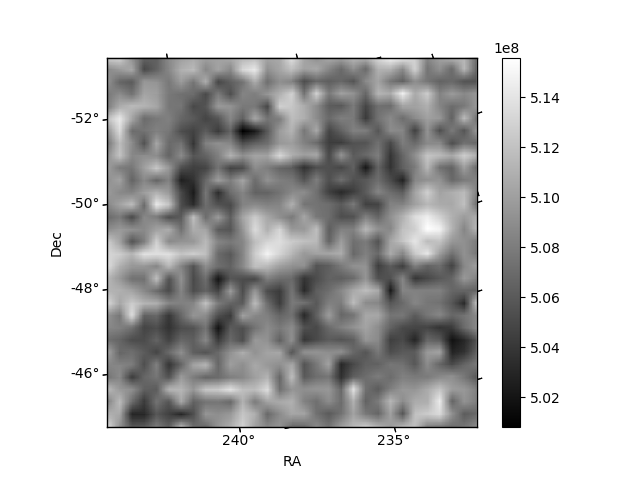
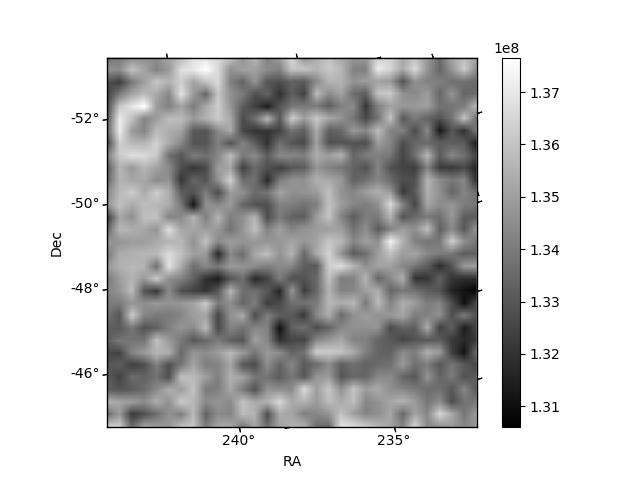
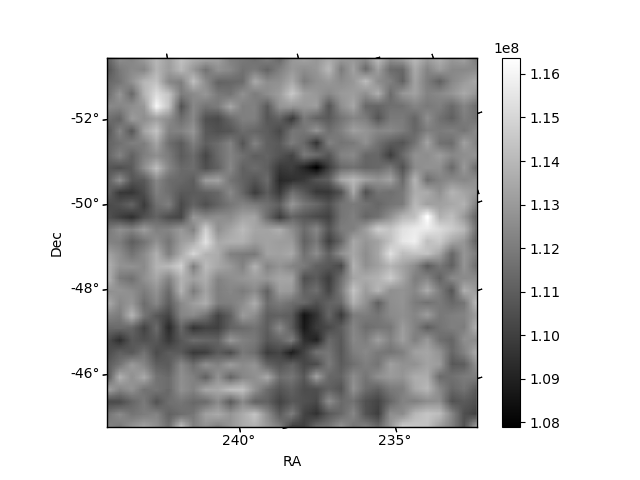
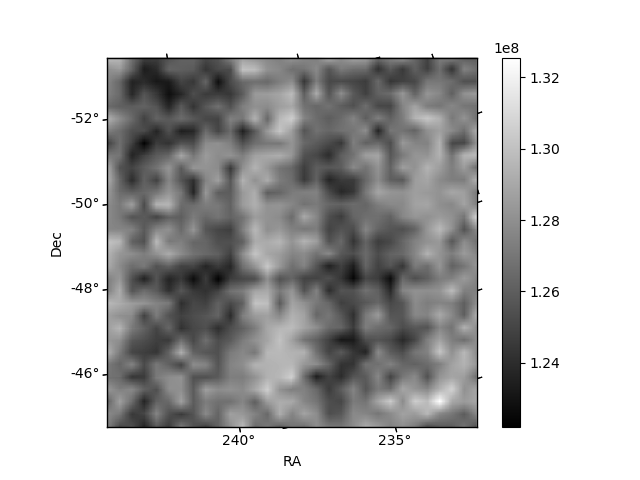
Histogram calculated using DETX and DETY for each event in the final _common_clean file
| Quadrant A | 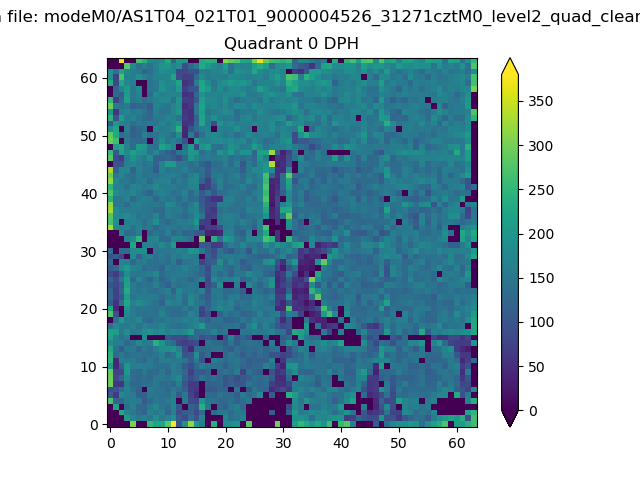 |
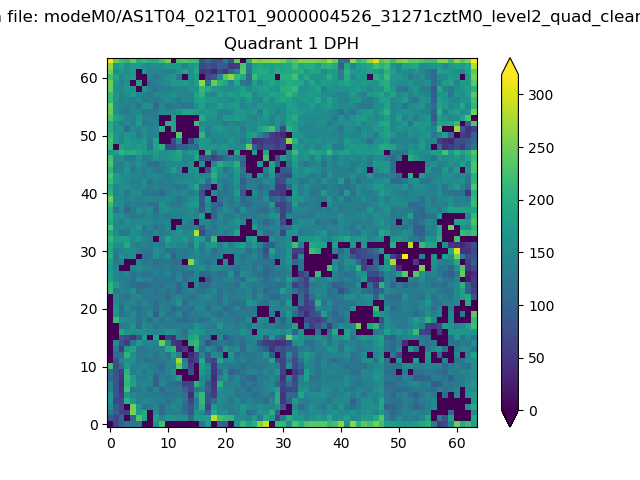 |
Quadrant B |
|---|---|---|---|
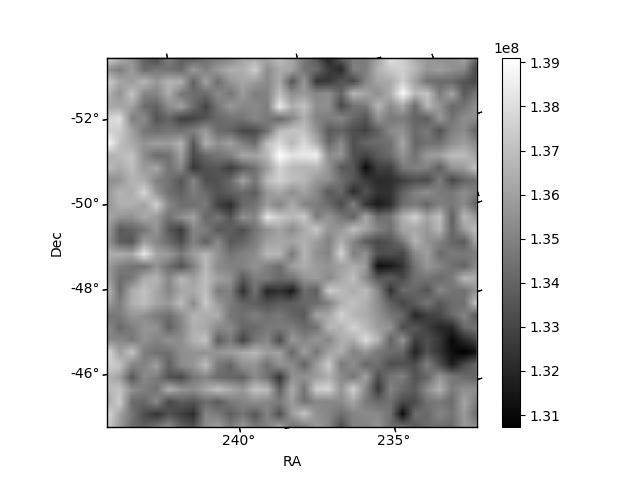
| Quadrant D | 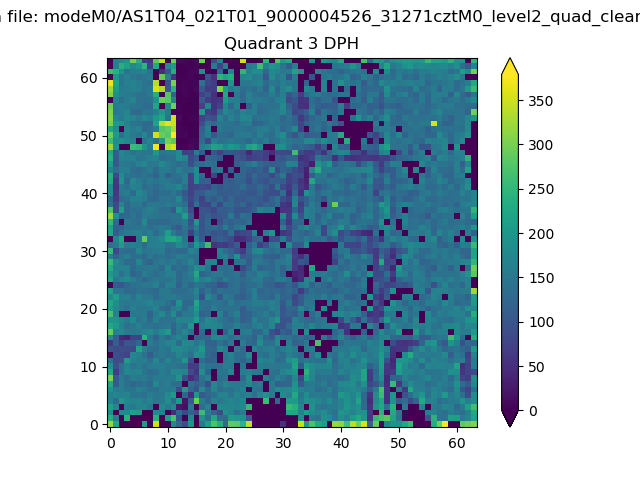 |
 |
Quadrant C |
| Plot type | Count rate plots | Images |
|---|---|---|
| Comparison with Poisson distribution Blue bars denote a histogram of data divided into 1 sec bins. Red curve is a Poisson curve with rate = median count rate of data. |
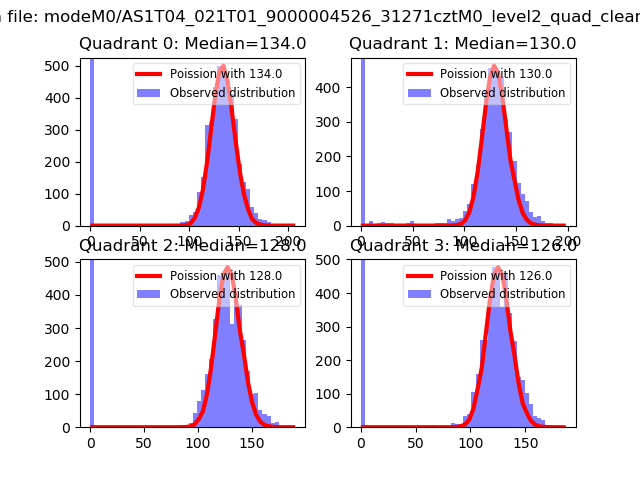 |
 |
| Quadrant-wise count rates Data is divided into 100 sec bins |
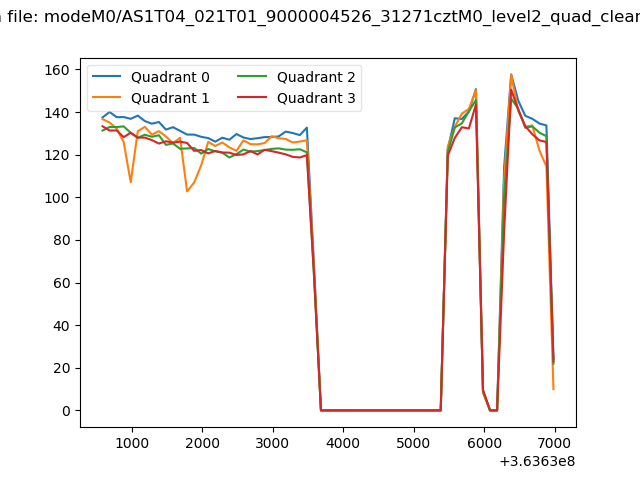 |
|
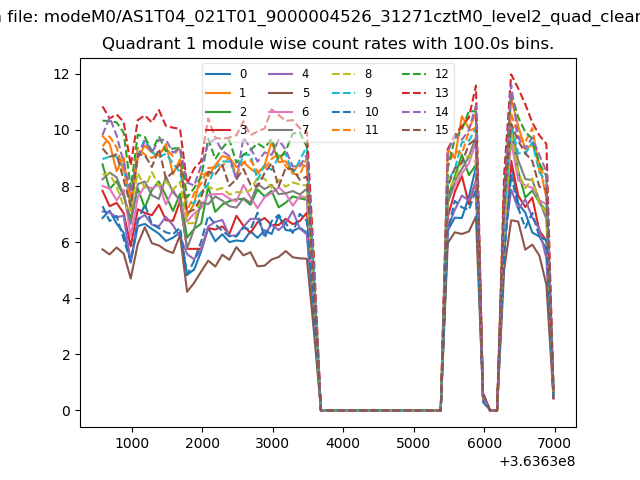
| Module-wise count rates for Quadrant A Data is divided into 100 sec bins |
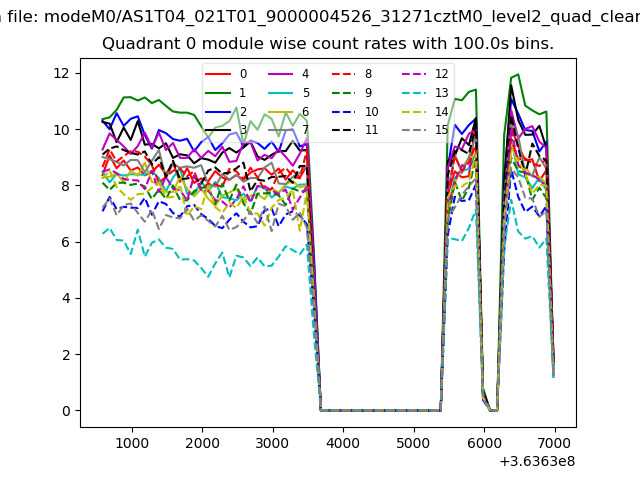 |
 |
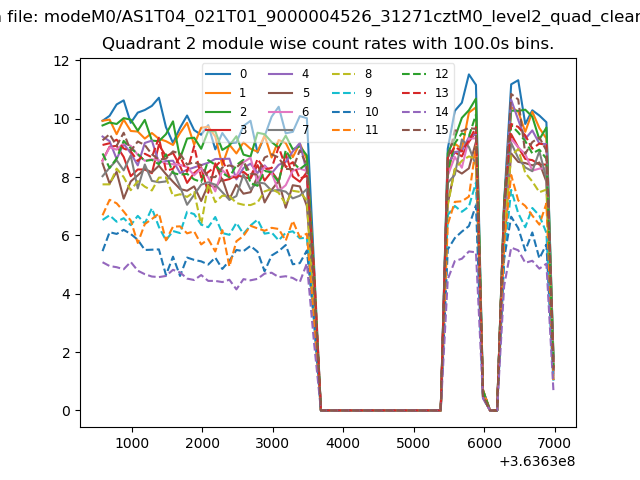
| Module-wise count rates for Quadrant B Data is divided into 100 sec bins |
 |
 |
| Module-wise count rates for Quadrant C Data is divided into 100 sec bins |
 |
 |
| Module-wise count rates for Quadrant D Data is divided into 100 sec bins |
 |
 |
| Parameter | Plot |
|---|---|
| CZT HV Monitor | 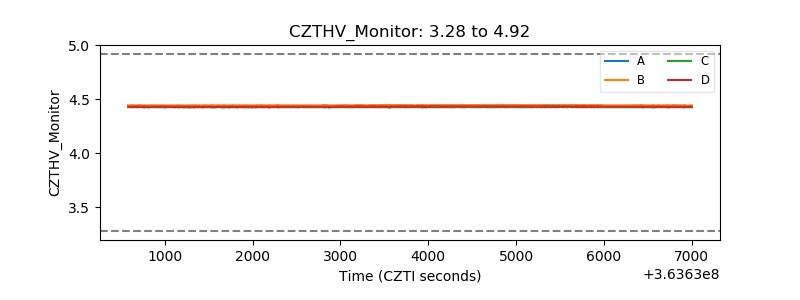 |
| D_VDD | 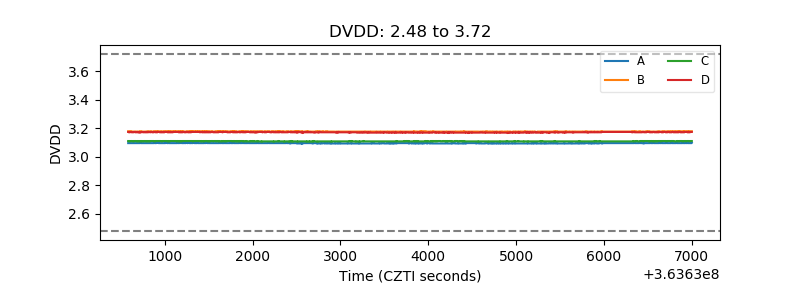 |
| Temperature 1 | 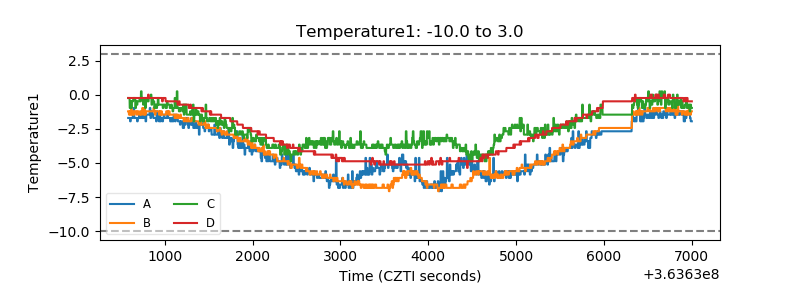 |
| Veto HV Monitor | 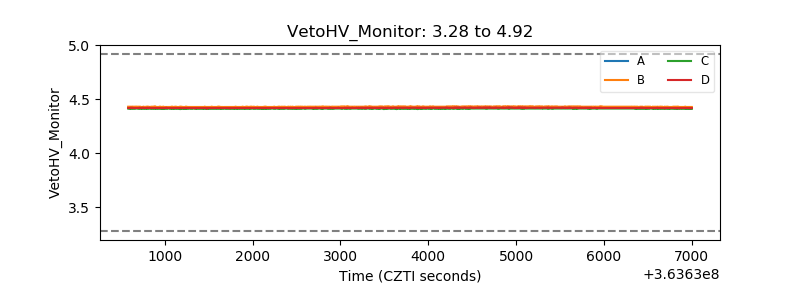 |
| Veto LLD | 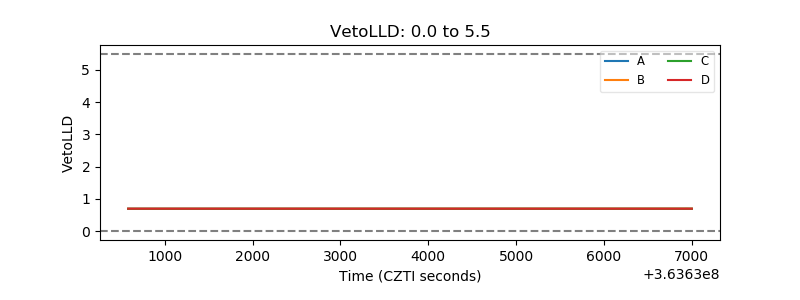 |
| Alpha Counter | 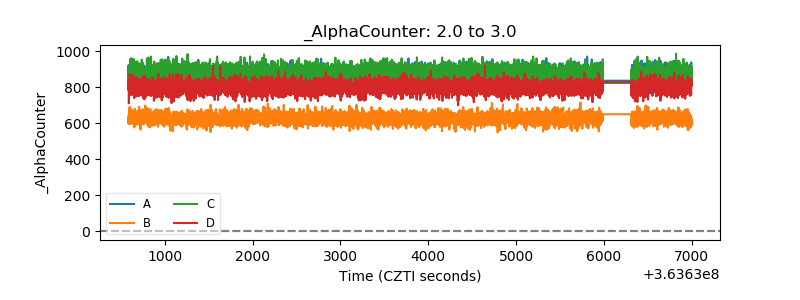 |
| _CPM_Rate | 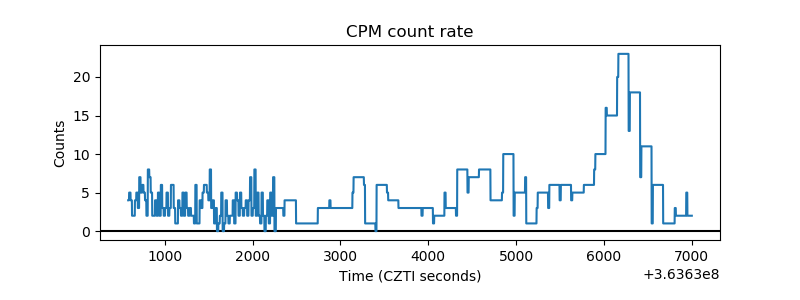 |
| CZT Counter | 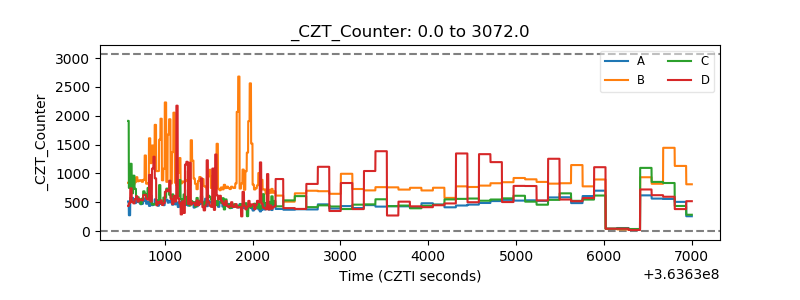 |
| +2.5 Volts monitor |  |
| +5 Volts monitor |  |
| _ROLL_ROT | 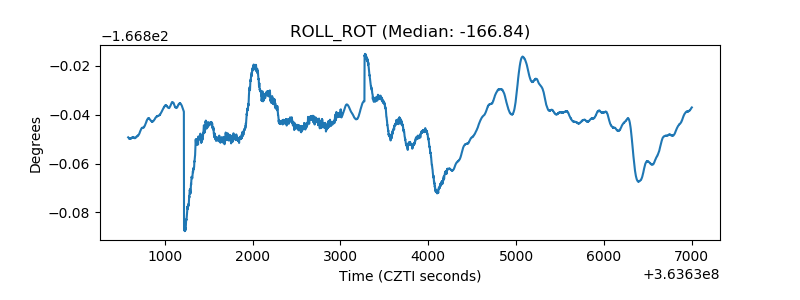 |
| _Roll_DEC | 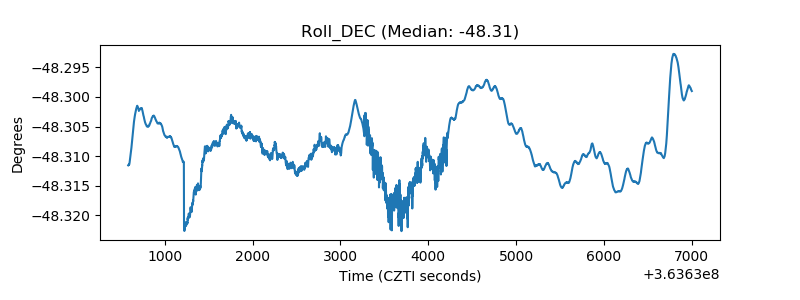 |
| _Roll_RA | 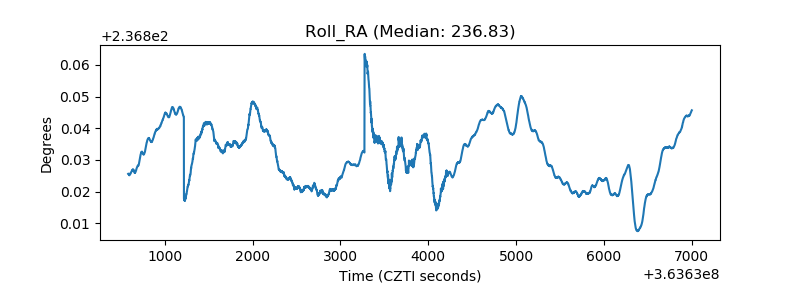 |
| Veto Counter | 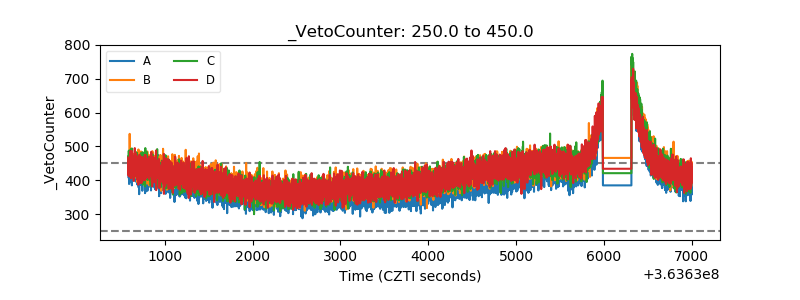 |