| Param | Original file | Final file |
|---|---|---|
| Filename | modeM0/AS1T04_024T01_9000004530_31275cztM0_level2.evt | modeM0/AS1T04_024T01_9000004530_31275cztM0_level2_quad_clean.evt |
| Size (bytes) | 281,983,680 | 49,875,840 |
| Size | 268.9 MB | 47.6 MB |
| Events in quadrant A | 1,698,201 | 325,959 |
| Events in quadrant B | 2,695,781 | 321,387 |
| Events in quadrant C | 1,840,627 | 309,168 |
| Events in quadrant D | 2,070,304 | 309,599 |
| Mode M0 | |||
|---|---|---|---|
| Quadrant | BADHDUFLAG | Total packets | Discarded packets |
| A | 0 | 7097 | 1 |
| B | 0 | 10636 | 1 |
| C | 0 | 7514 | 1 |
| D | 0 | 8435 | 2 |
| Mode SS | |||
|---|---|---|---|
| Quadrant | BADHDUFLAG | Total packets | Discarded packets |
| A | 0 | 70 | 0 |
| B | 0 | 70 | 0 |
| C | 0 | 70 | 0 |
| D | 0 | 70 | 0 |
| Mode M9 | |||
|---|---|---|---|
| Quadrant | BADHDUFLAG | Total packets | Discarded packets |
| A | 0 | 9 | 0 |
| B | 0 | 9 | 0 |
| C | 0 | 9 | 0 |
| D | 0 | 9 | 0 |
| Quadrant | Total seconds | Saturated seconds | Saturation percentage |
|---|---|---|---|
| A | 3444 | 30 | 0.871080% |
| B | 3444 | 105 | 3.048780% |
| C | 3444 | 83 | 2.409988% |
| D | 3443 | 40 | 1.161778% |
Noise dominated data is calculated using 1-second bins in cleaned event files. If a bin has >2000 counts, and if more than 50% of those come from <1% of pixels, then it is considered to be noise-dominated and hence unusable.
| Quadrant | # 1 sec bins | Bins with >0 counts | Bins with >2000 counts | High rate bins dominated by noise | Noise dominated (total time) | Noise dominated (detector-on time) | Marked lightcurve |
|---|---|---|---|---|---|---|---|
| A | 4354 | 3445 | 0 | 0 | 0.00% | 0.00% | 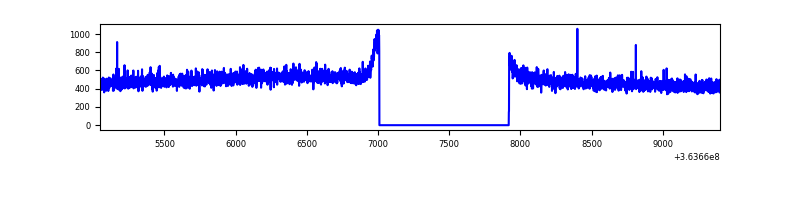 |
| B | 4354 | 3445 | 16 | 16 | 0.37% | 0.46% |  |
| C | 4354 | 3445 | 9 | 9 | 0.21% | 0.26% | 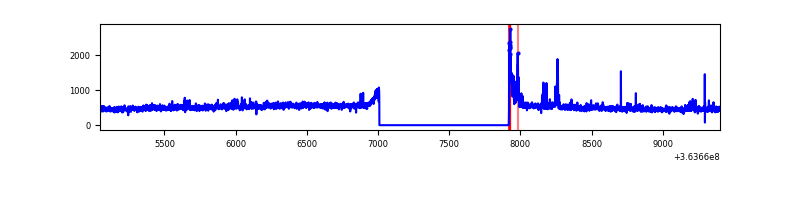 |
| D | 4353 | 3444 | 11 | 11 | 0.25% | 0.32% | 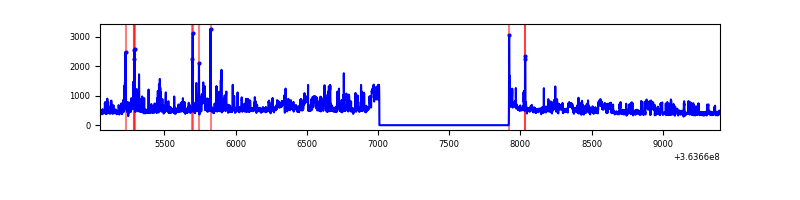 |
Top three noisy pixels from each quadrant. If the there are fewer than three noisy pixels in the level2.evt file, extra rows are filled as -1
| Pixel properties | Quadrant properties | ||||||
|---|---|---|---|---|---|---|---|
| Quadrant | DetID | PixID | Counts | Sigma | Mean | Median | Sigma |
| A | 13 | 254 | 6706 | 69.36 | 439 | 429 | 90.5 |
| A | 3 | 137 | 4630 | 46.42 | 439 | 429 | 90.5 |
| A | 0 | 226 | 3688 | 36.01 | 439 | 429 | 90.5 |
| B | 6 | 159 | 864039 | 10254.46 | 430 | 418 | 84.2 |
| B | 0 | 230 | 64165 | 756.92 | 430 | 418 | 84.2 |
| B | 4 | 80 | 39651 | 465.84 | 430 | 418 | 84.2 |
| C | 14 | 238 | 69804 | 692.49 | 419 | 421 | 100.2 |
| C | 3 | 233 | 60768 | 602.3 | 419 | 421 | 100.2 |
| C | 0 | 10 | 59280 | 587.45 | 419 | 421 | 100.2 |
| D | 8 | 195 | 306415 | 2740.32 | 422 | 412 | 111.7 |
| D | 12 | 233 | 75932 | 676.3 | 422 | 412 | 111.7 |
| D | 2 | 250 | 48329 | 429.11 | 422 | 412 | 111.7 |
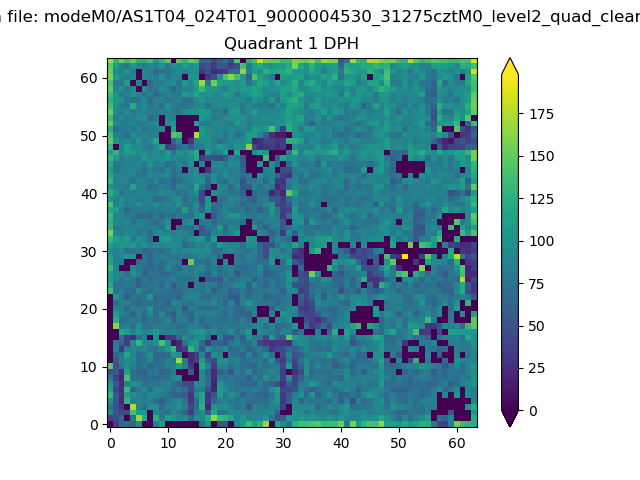
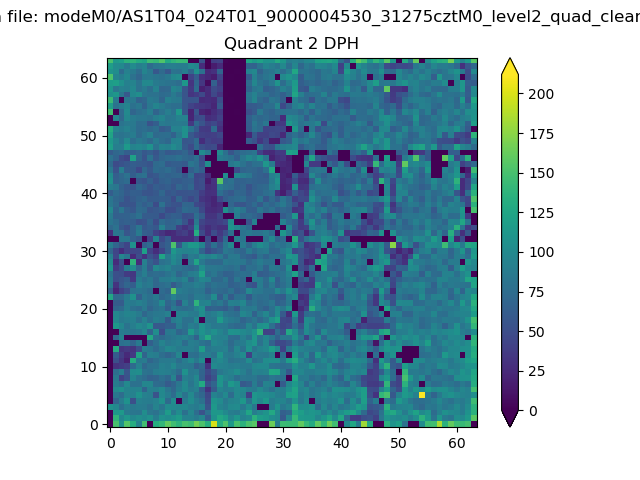
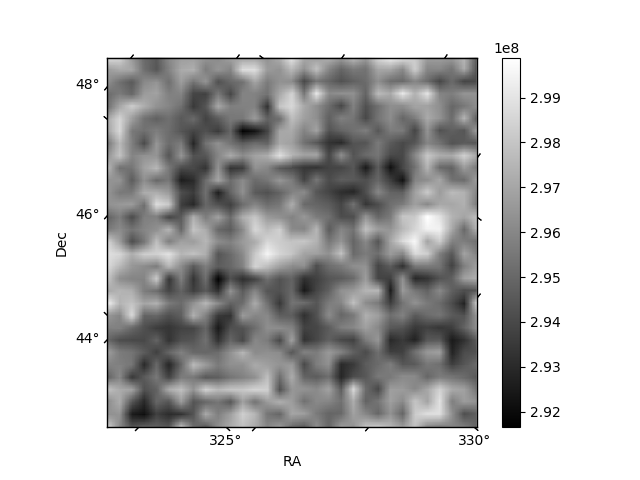
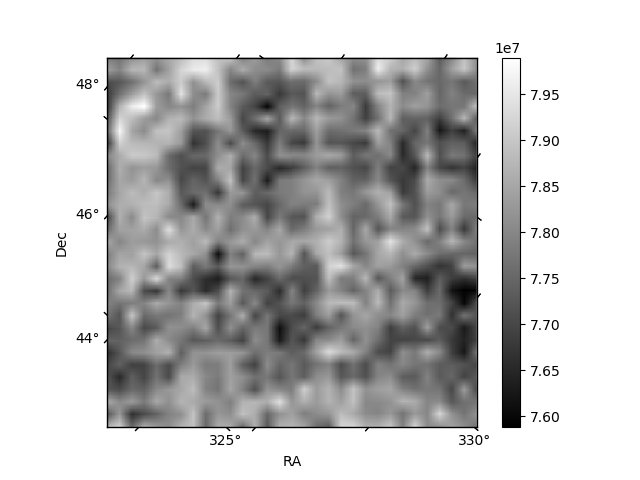
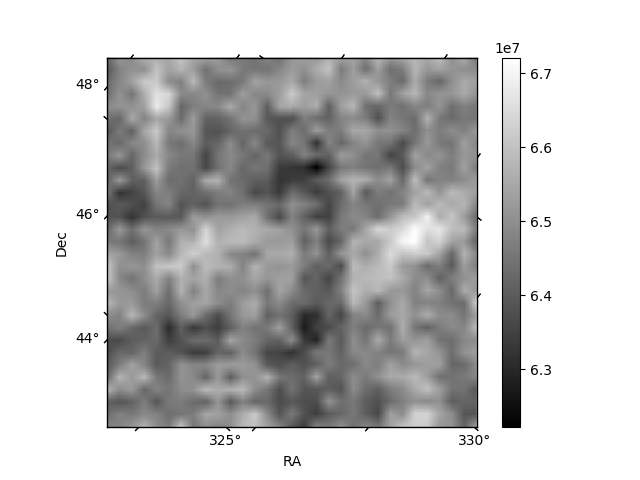
Histogram calculated using DETX and DETY for each event in the final _common_clean file
| Quadrant A | 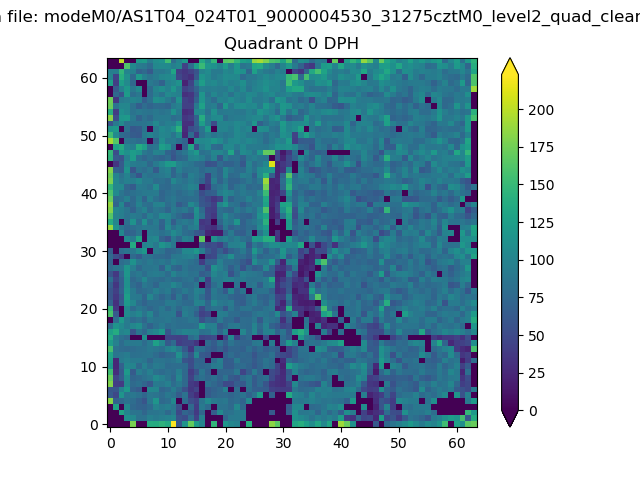 |
 |
Quadrant B |
|---|---|---|---|
| Quadrant D | 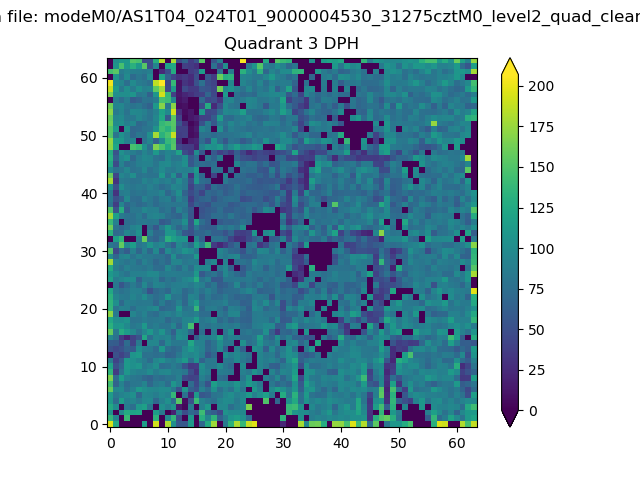 |
 |
Quadrant C |
| Plot type | Count rate plots | Images |
|---|---|---|
| Comparison with Poisson distribution Blue bars denote a histogram of data divided into 1 sec bins. Red curve is a Poisson curve with rate = median count rate of data. |
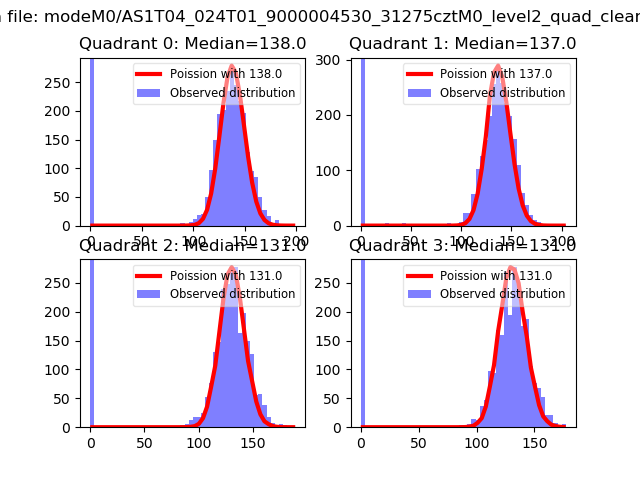 |
 |
| Quadrant-wise count rates Data is divided into 100 sec bins |
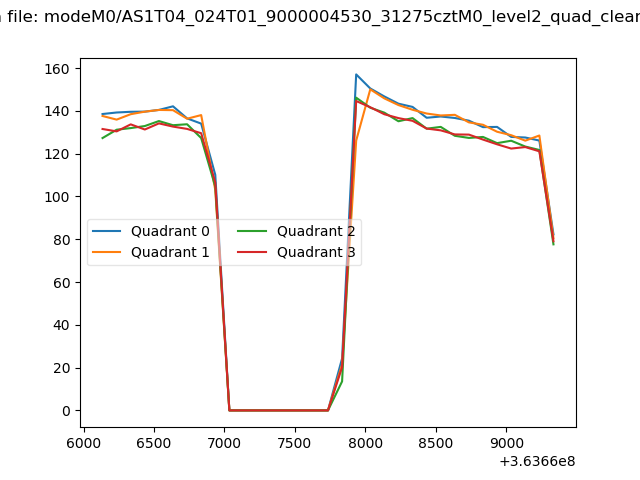 |
|
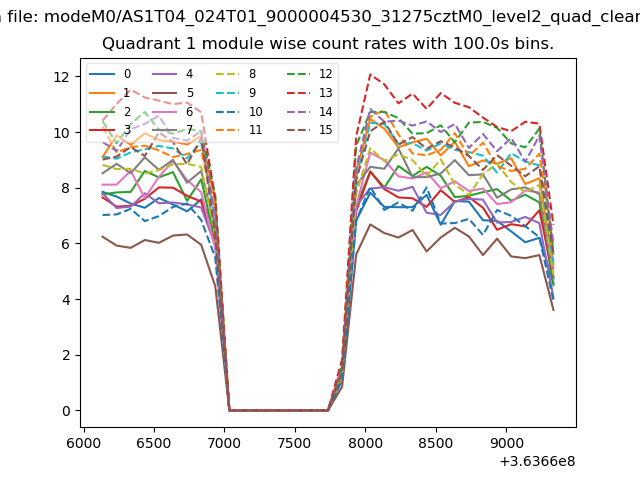
| Module-wise count rates for Quadrant A Data is divided into 100 sec bins |
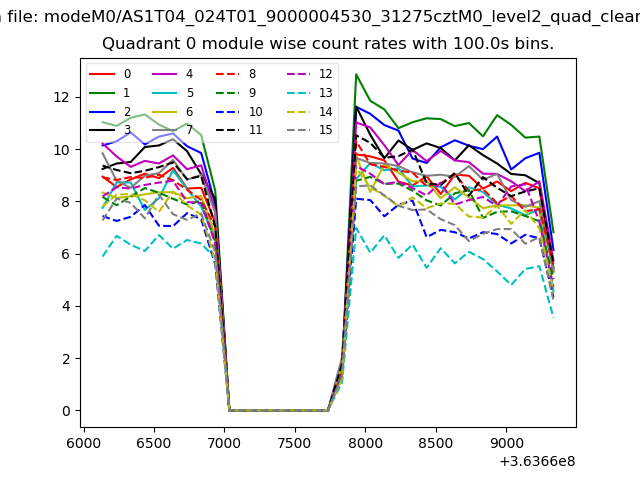 |
 |
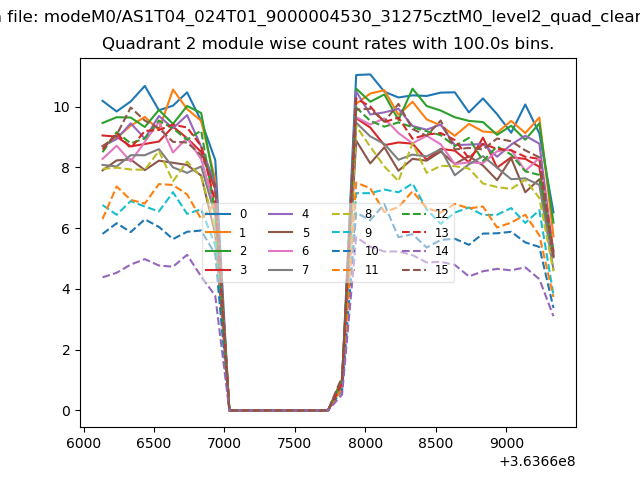
| Module-wise count rates for Quadrant B Data is divided into 100 sec bins |
 |
 |
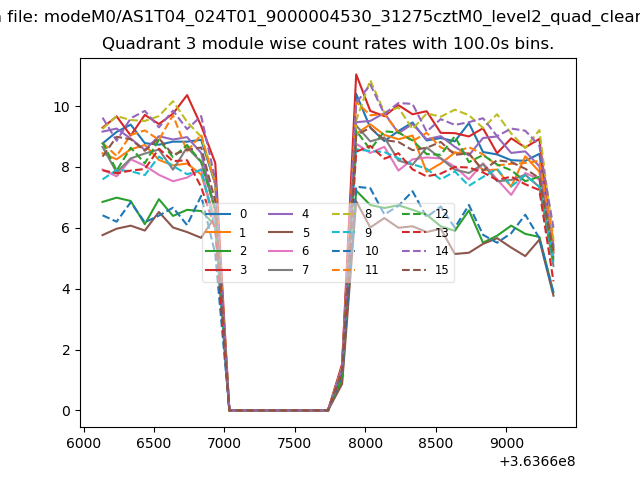
| Module-wise count rates for Quadrant C Data is divided into 100 sec bins |
 |
 |
| Module-wise count rates for Quadrant D Data is divided into 100 sec bins |
 |
 |
| Parameter | Plot |
|---|---|
| CZT HV Monitor | 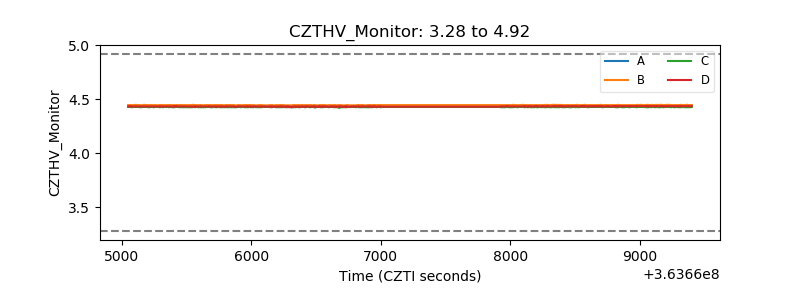 |
| D_VDD | 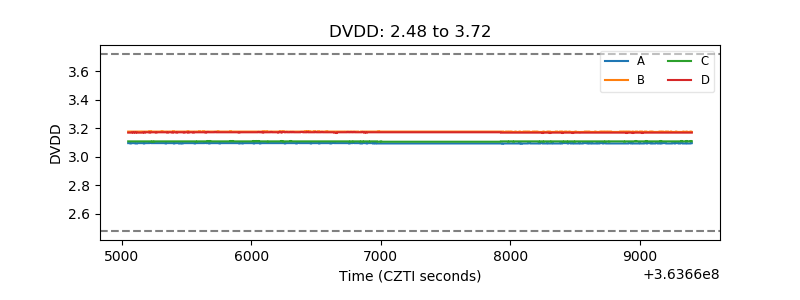 |
| Temperature 1 | 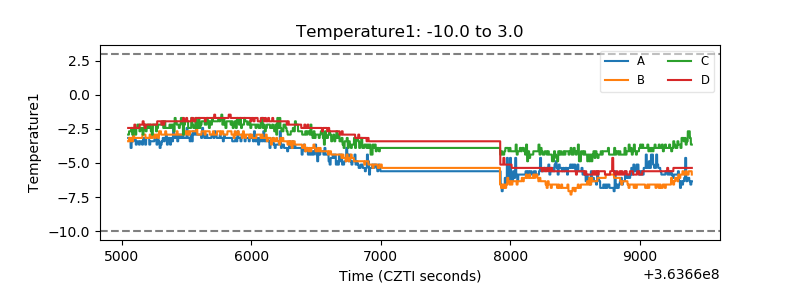 |
| Veto HV Monitor | 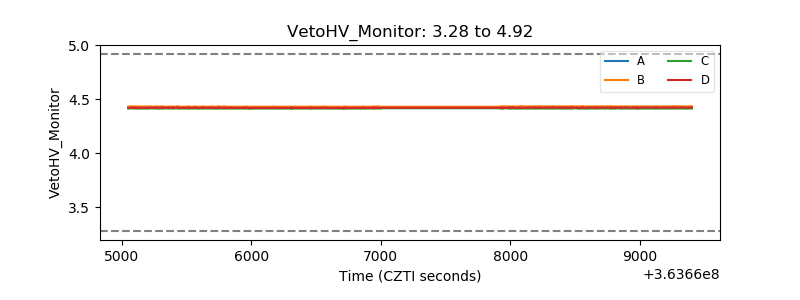 |
| Veto LLD |  |
| Alpha Counter | 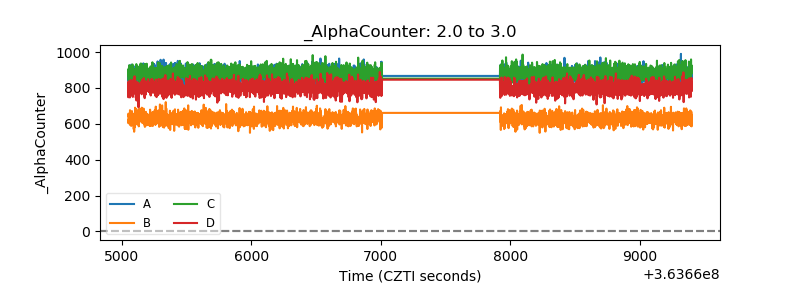 |
| _CPM_Rate | 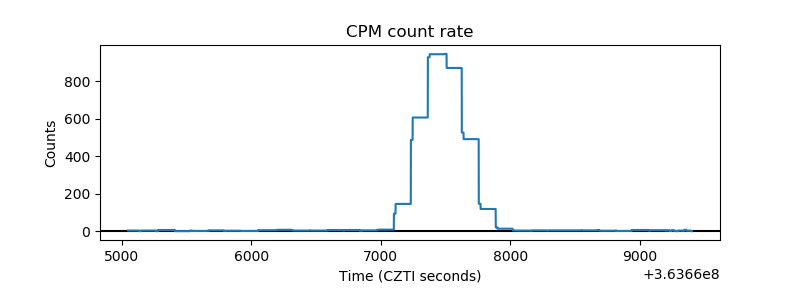 |
| CZT Counter | 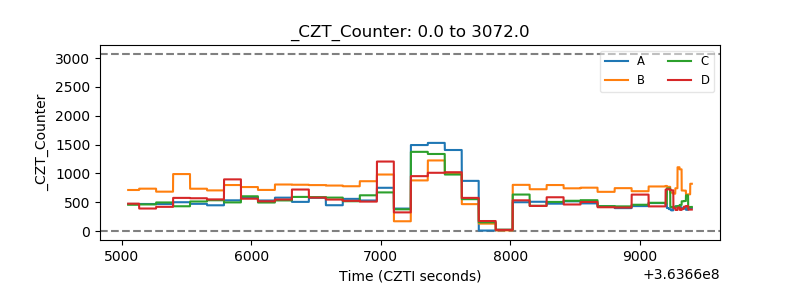 |
| +2.5 Volts monitor |  |
| +5 Volts monitor |  |
| _ROLL_ROT | 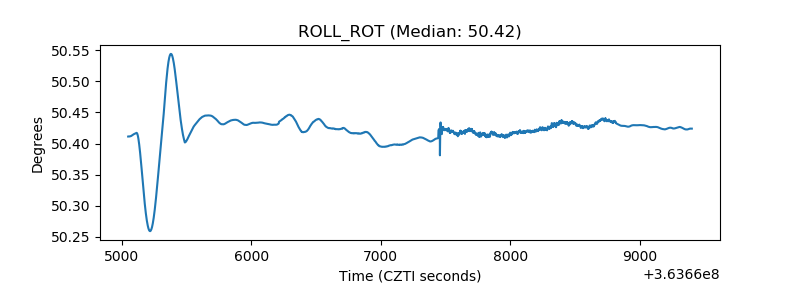 |
| _Roll_DEC | 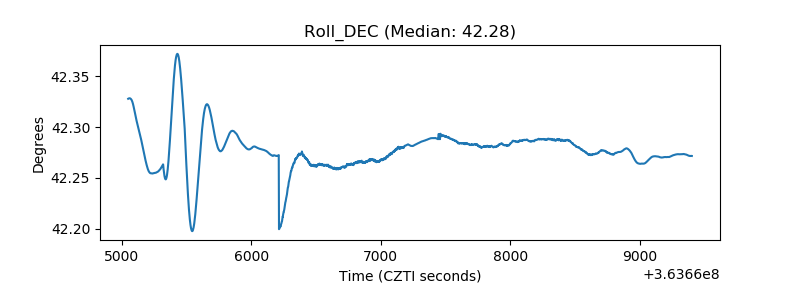 |
| _Roll_RA | 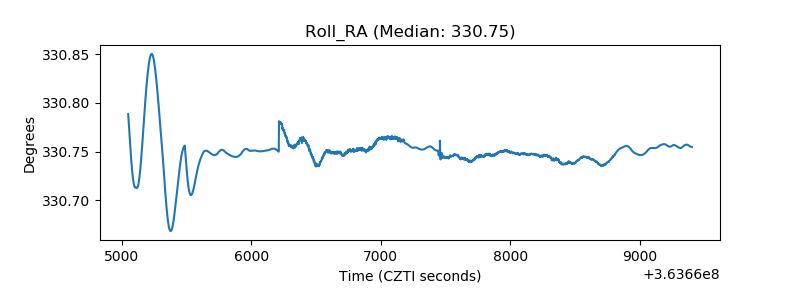 |
| Veto Counter | 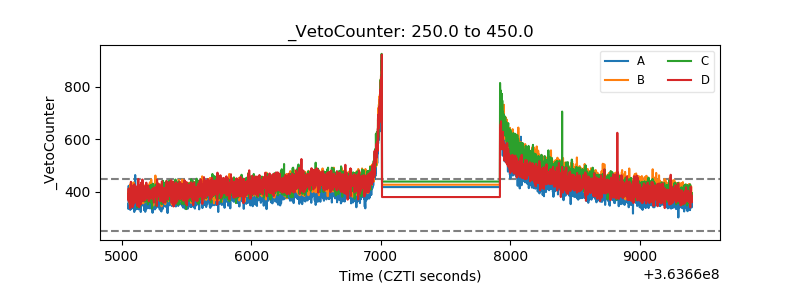 |