| Param | Original file | Final file |
|---|---|---|
| Filename | modeM0/AS1T04_024T01_9000004530_31276cztM0_level2.evt | modeM0/AS1T04_024T01_9000004530_31276cztM0_level2_quad_clean.evt |
| Size (bytes) | 472,596,480 | 86,362,560 |
| Size | 450.7 MB | 82.4 MB |
| Events in quadrant A | 2,845,957 | 564,488 |
| Events in quadrant B | 4,585,562 | 560,790 |
| Events in quadrant C | 3,045,445 | 534,625 |
| Events in quadrant D | 3,427,895 | 535,554 |
| Mode M0 | |||
|---|---|---|---|
| Quadrant | BADHDUFLAG | Total packets | Discarded packets |
| A | 0 | 12258 | 1 |
| B | 0 | 18284 | 1 |
| C | 0 | 12875 | 1 |
| D | 0 | 14277 | 1 |
| Mode SS | |||
|---|---|---|---|
| Quadrant | BADHDUFLAG | Total packets | Discarded packets |
| A | 0 | 124 | 0 |
| B | 0 | 124 | 0 |
| C | 0 | 124 | 0 |
| D | 0 | 124 | 0 |
| Mode M9 | |||
|---|---|---|---|
| Quadrant | BADHDUFLAG | Total packets | Discarded packets |
| A | 0 | 10 | 0 |
| B | 0 | 10 | 0 |
| C | 0 | 10 | 0 |
| D | 0 | 10 | 0 |
| Quadrant | Total seconds | Saturated seconds | Saturation percentage |
|---|---|---|---|
| A | 6005 | 38 | 0.632806% |
| B | 6006 | 102 | 1.698302% |
| C | 6006 | 125 | 2.081252% |
| D | 6006 | 70 | 1.165501% |
Noise dominated data is calculated using 1-second bins in cleaned event files. If a bin has >2000 counts, and if more than 50% of those come from <1% of pixels, then it is considered to be noise-dominated and hence unusable.
| Quadrant | # 1 sec bins | Bins with >0 counts | Bins with >2000 counts | High rate bins dominated by noise | Noise dominated (total time) | Noise dominated (detector-on time) | Marked lightcurve |
|---|---|---|---|---|---|---|---|
| A | 7035 | 6006 | 0 | 0 | 0.00% | 0.00% | 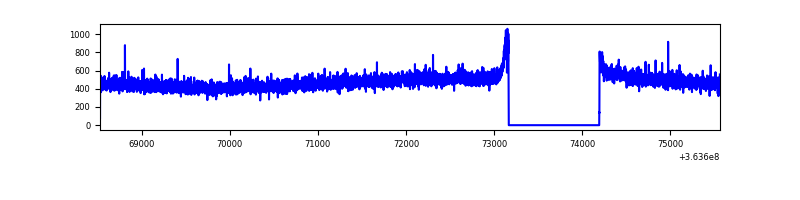 |
| B | 7036 | 6007 | 8 | 8 | 0.11% | 0.13% | 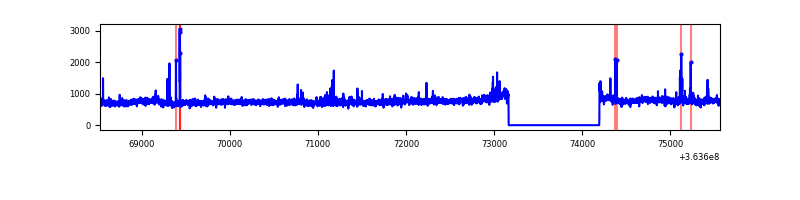 |
| C | 7036 | 6007 | 9 | 9 | 0.13% | 0.15% | 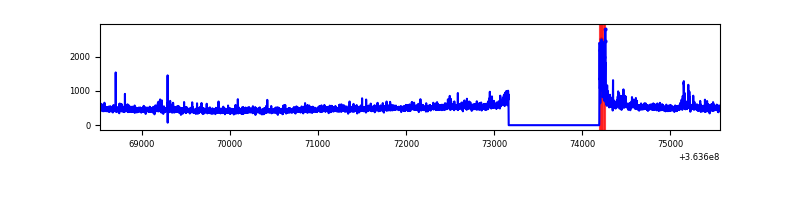 |
| D | 7036 | 6007 | 24 | 24 | 0.34% | 0.40% | 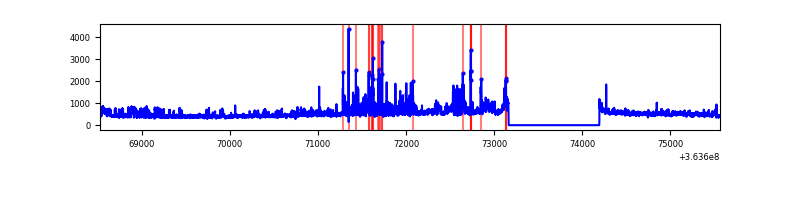 |
Top three noisy pixels from each quadrant. If the there are fewer than three noisy pixels in the level2.evt file, extra rows are filled as -1
| Pixel properties | Quadrant properties | ||||||
|---|---|---|---|---|---|---|---|
| Quadrant | DetID | PixID | Counts | Sigma | Mean | Median | Sigma |
| A | 13 | 254 | 11779 | 74.83 | 737 | 722 | 147.8 |
| A | 3 | 137 | 7498 | 45.86 | 737 | 722 | 147.8 |
| A | 0 | 226 | 6138 | 36.65 | 737 | 722 | 147.8 |
| B | 6 | 159 | 1588300 | 11456.43 | 724 | 706 | 138.6 |
| B | 4 | 80 | 82915 | 593.24 | 724 | 706 | 138.6 |
| B | 10 | 247 | 40718 | 288.74 | 724 | 706 | 138.6 |
| C | 14 | 238 | 122267 | 751.2 | 694 | 698 | 161.8 |
| C | 3 | 233 | 96806 | 593.87 | 694 | 698 | 161.8 |
| C | 0 | 10 | 87468 | 536.17 | 694 | 698 | 161.8 |
| D | 8 | 195 | 562011 | 3225.71 | 702 | 684 | 174.0 |
| D | 2 | 250 | 106096 | 605.76 | 702 | 684 | 174.0 |
| D | 12 | 233 | 94242 | 537.64 | 702 | 684 | 174.0 |
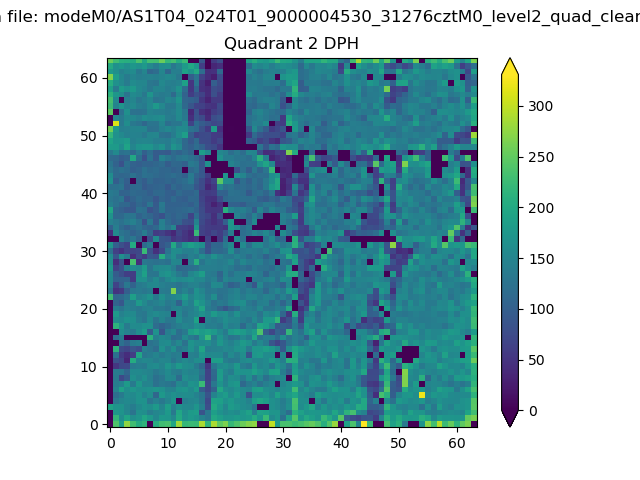
Histogram calculated using DETX and DETY for each event in the final _common_clean file
| Quadrant A | 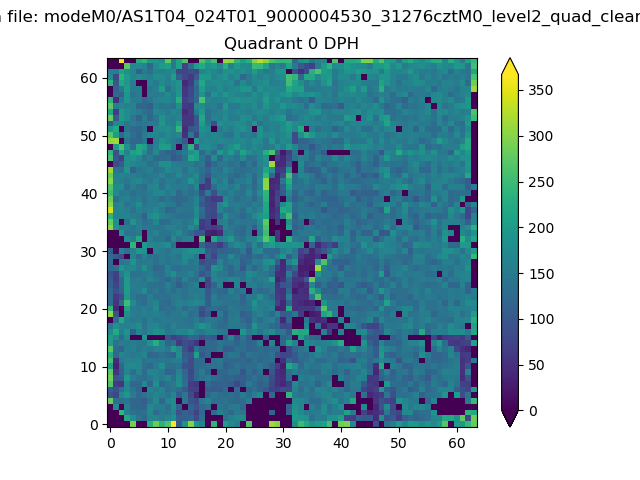 |
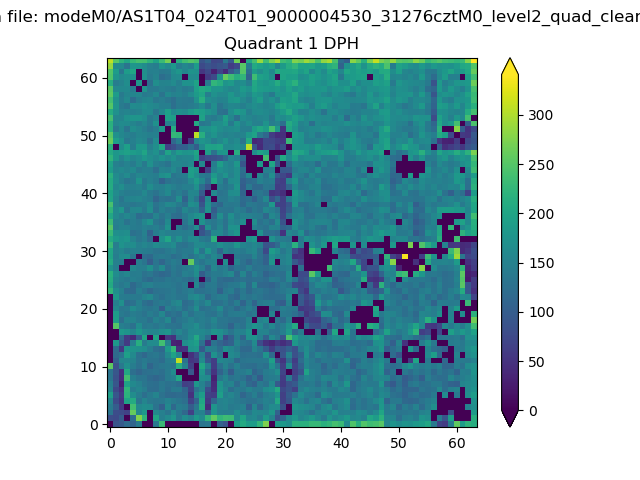 |
Quadrant B |
|---|---|---|---|
| Quadrant D | 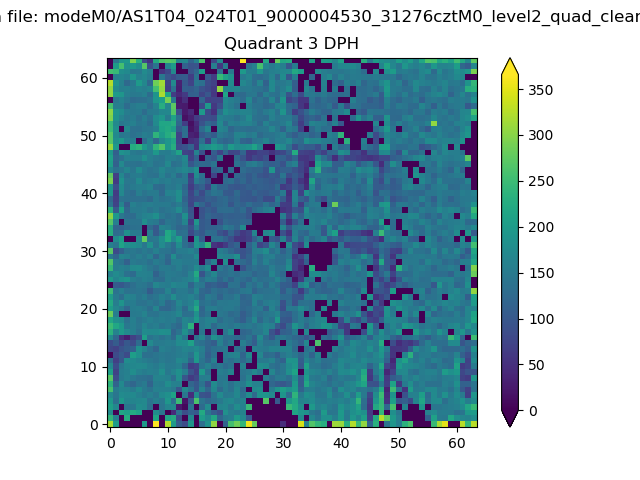 |
 |
Quadrant C |
| Plot type | Count rate plots | Images |
|---|---|---|
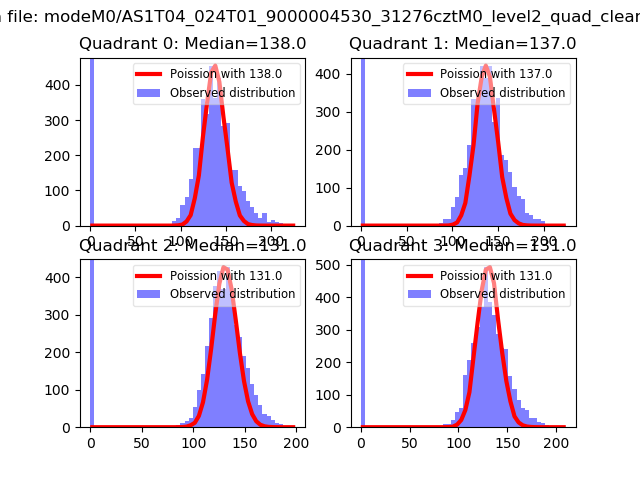
| Comparison with Poisson distribution Blue bars denote a histogram of data divided into 1 sec bins. Red curve is a Poisson curve with rate = median count rate of data. |
 |
 |
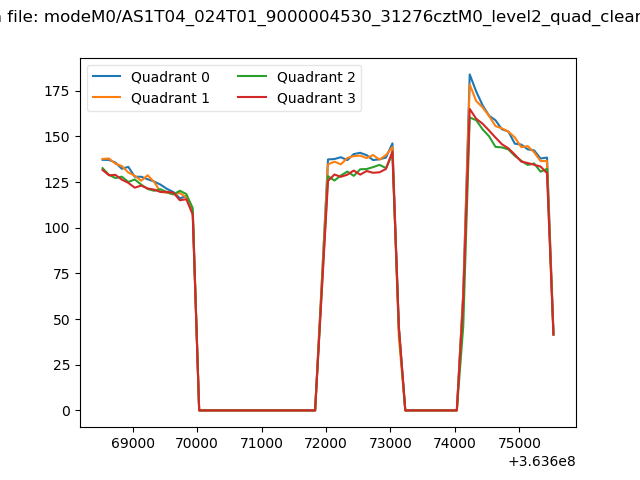
| Quadrant-wise count rates Data is divided into 100 sec bins |
 |
|
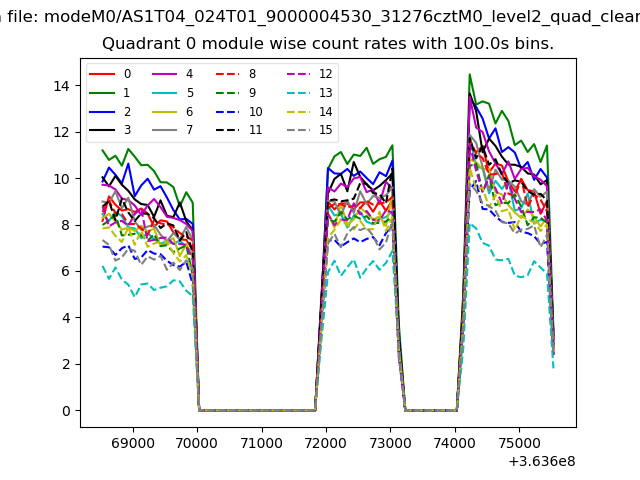
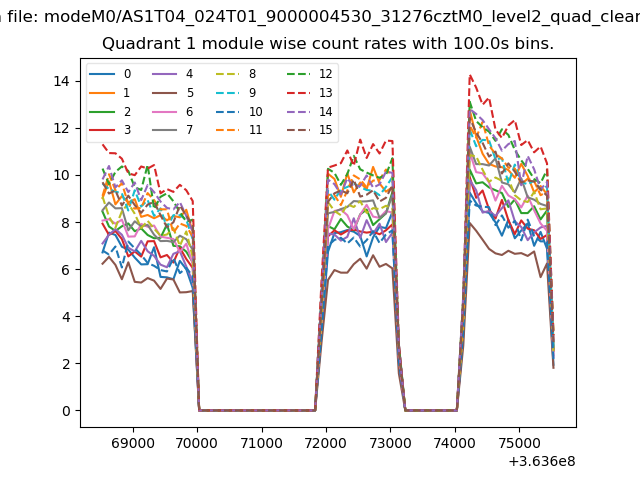
| Module-wise count rates for Quadrant A Data is divided into 100 sec bins |
 |
 |
| Module-wise count rates for Quadrant B Data is divided into 100 sec bins |
 |
 |
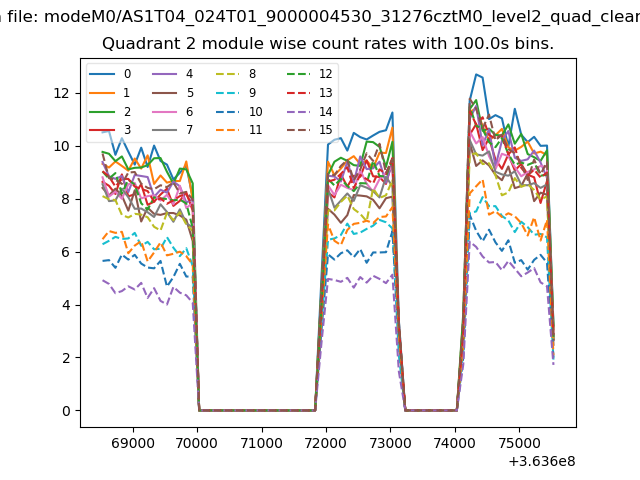
| Module-wise count rates for Quadrant C Data is divided into 100 sec bins |
 |
 |
| Module-wise count rates for Quadrant D Data is divided into 100 sec bins |
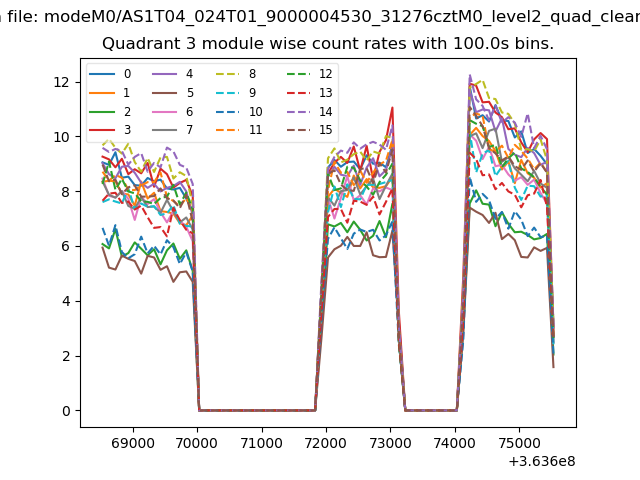 |
 |
| Parameter | Plot |
|---|---|
| CZT HV Monitor | 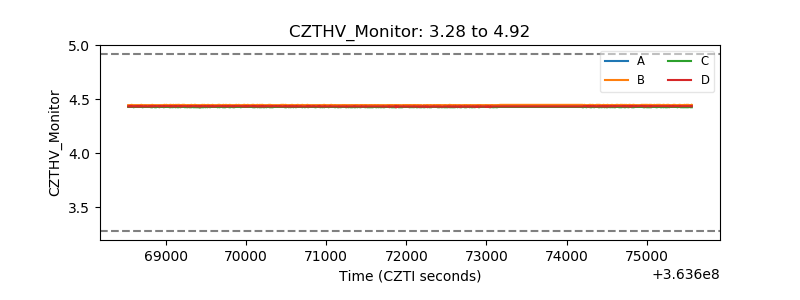 |
| D_VDD | 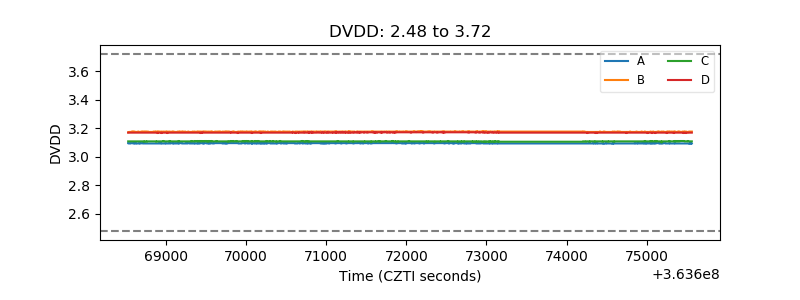 |
| Temperature 1 | 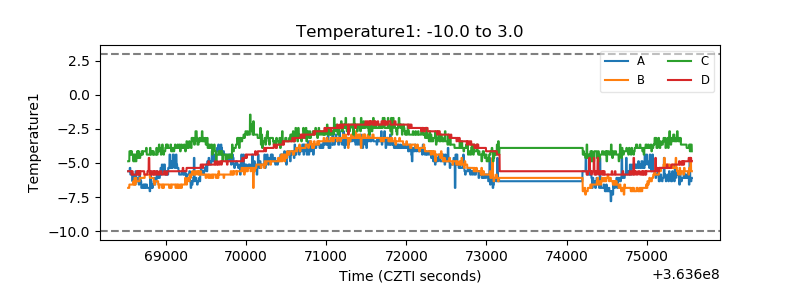 |
| Veto HV Monitor | 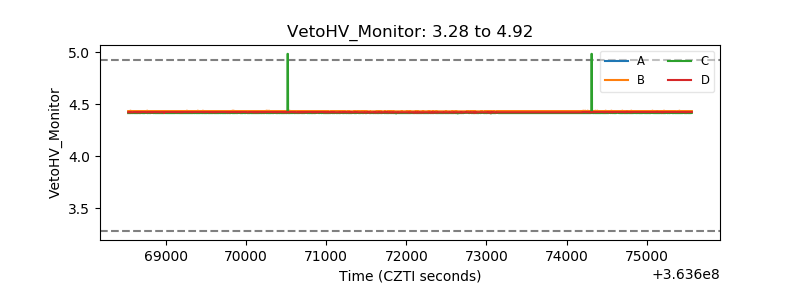 |
| Veto LLD | 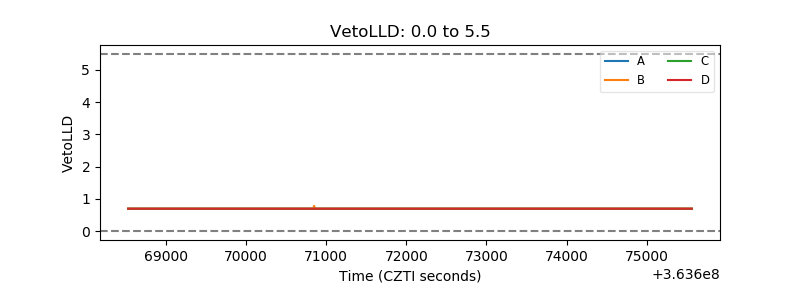 |
| Alpha Counter | 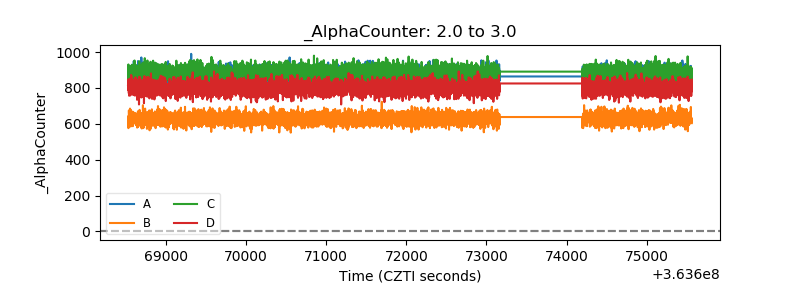 |
| _CPM_Rate | 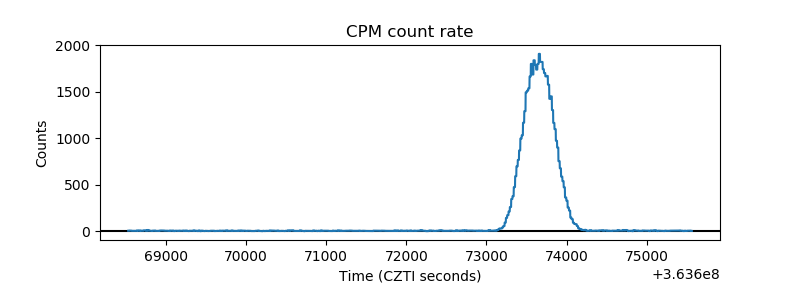 |
| CZT Counter | 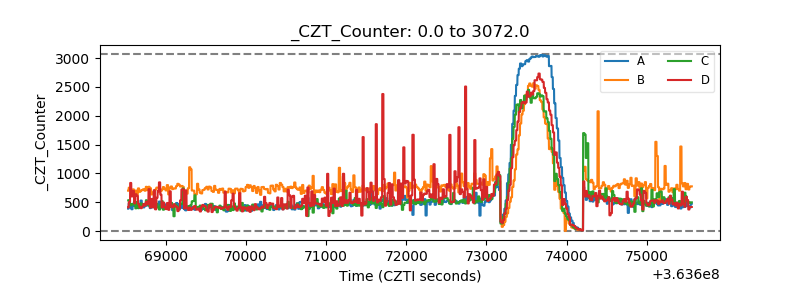 |
| +2.5 Volts monitor |  |
| +5 Volts monitor | 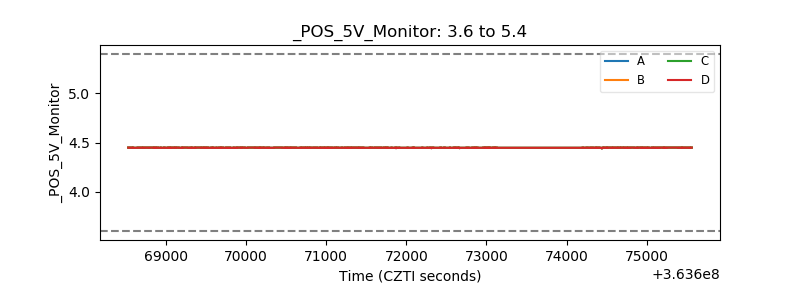 |
| _ROLL_ROT | 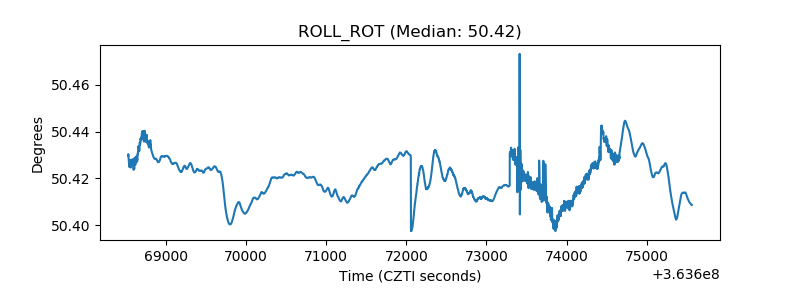 |
| _Roll_DEC | 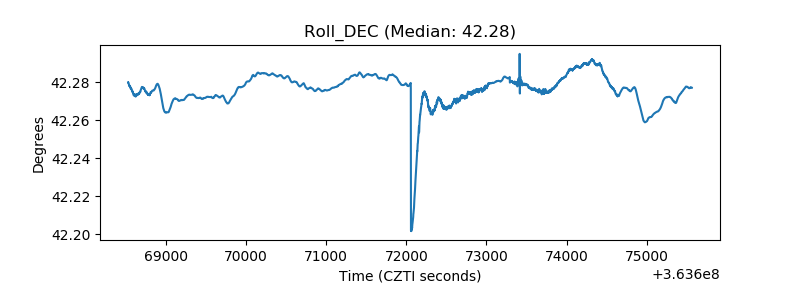 |
| _Roll_RA | 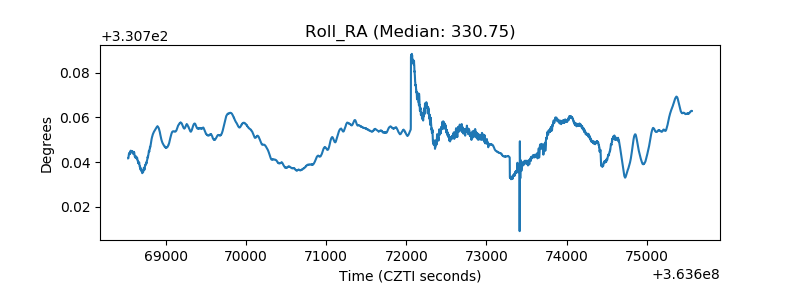 |
| Veto Counter | 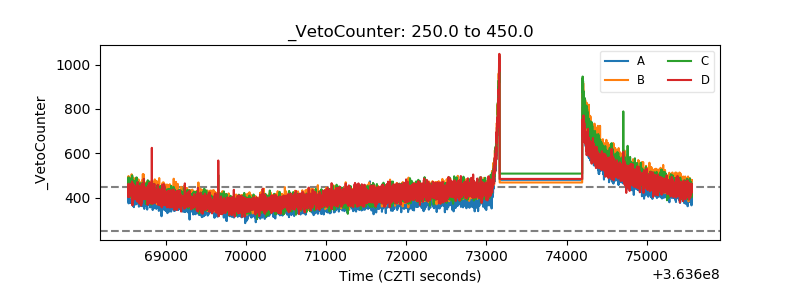 |