| Param | Original file | Final file |
|---|---|---|
| Filename | modeM0/AS1T04_024T01_9000004530_31279cztM0_level2.evt | modeM0/AS1T04_024T01_9000004530_31279cztM0_level2_quad_clean.evt |
| Size (bytes) | 571,210,560 | 97,130,880 |
| Size | 544.7 MB | 92.6 MB |
| Events in quadrant A | 3,497,336 | 645,208 |
| Events in quadrant B | 5,377,369 | 638,157 |
| Events in quadrant C | 3,986,236 | 591,288 |
| Events in quadrant D | 3,994,418 | 609,499 |
| Mode M0 | |||
|---|---|---|---|
| Quadrant | BADHDUFLAG | Total packets | Discarded packets |
| A | 0 | 14284 | 2 |
| B | 0 | 20342 | 2 |
| C | 0 | 15951 | 2 |
| D | 0 | 16018 | 2 |
| Mode SS | |||
|---|---|---|---|
| Quadrant | BADHDUFLAG | Total packets | Discarded packets |
| A | 0 | 134 | 0 |
| B | 0 | 134 | 0 |
| C | 0 | 134 | 0 |
| D | 0 | 134 | 0 |
| Mode M9 | |||
|---|---|---|---|
| Quadrant | BADHDUFLAG | Total packets | Discarded packets |
| A | 0 | 14 | 0 |
| B | 0 | 15 | 0 |
| C | 0 | 15 | 0 |
| D | 0 | 15 | 0 |
| Quadrant | Total seconds | Saturated seconds | Saturation percentage |
|---|---|---|---|
| A | 6554 | 58 | 0.884956% |
| B | 6554 | 141 | 2.151358% |
| C | 6554 | 348 | 5.309735% |
| D | 6554 | 90 | 1.373207% |
Noise dominated data is calculated using 1-second bins in cleaned event files. If a bin has >2000 counts, and if more than 50% of those come from <1% of pixels, then it is considered to be noise-dominated and hence unusable.
| Quadrant | # 1 sec bins | Bins with >0 counts | Bins with >2000 counts | High rate bins dominated by noise | Noise dominated (total time) | Noise dominated (detector-on time) | Marked lightcurve |
|---|---|---|---|---|---|---|---|
| A | 7804 | 6555 | 0 | 0 | 0.00% | 0.00% | 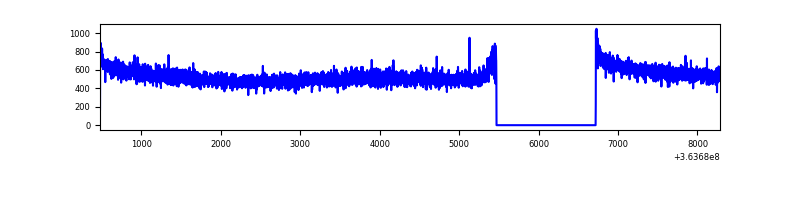 |
| B | 7804 | 6555 | 10 | 10 | 0.13% | 0.15% | 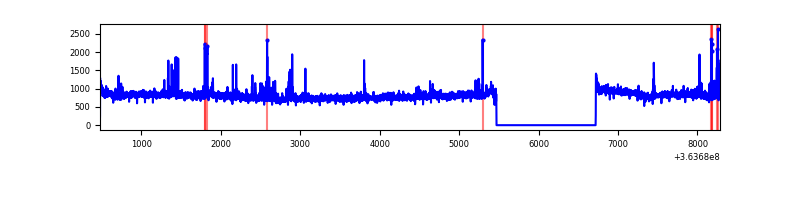 |
| C | 7804 | 6555 | 25 | 25 | 0.32% | 0.38% | 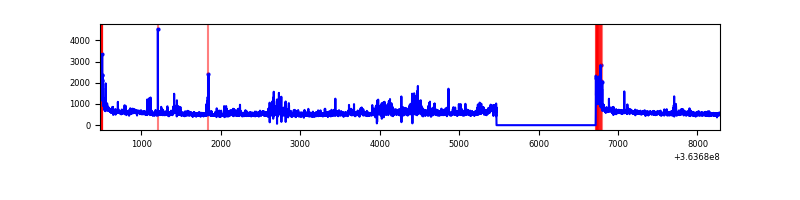 |
| D | 7804 | 6555 | 38 | 38 | 0.49% | 0.58% | 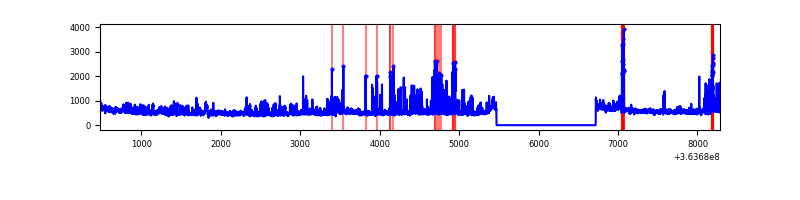 |
Top three noisy pixels from each quadrant. If the there are fewer than three noisy pixels in the level2.evt file, extra rows are filled as -1
| Pixel properties | Quadrant properties | ||||||
|---|---|---|---|---|---|---|---|
| Quadrant | DetID | PixID | Counts | Sigma | Mean | Median | Sigma |
| A | 13 | 254 | 11804 | 61.06 | 907 | 894 | 178.7 |
| A | 3 | 137 | 8443 | 42.25 | 907 | 894 | 178.7 |
| A | 0 | 226 | 7789 | 38.59 | 907 | 894 | 178.7 |
| B | 6 | 159 | 1738481 | 10607.03 | 879 | 860 | 163.8 |
| B | 4 | 80 | 111848 | 677.51 | 879 | 860 | 163.8 |
| B | 0 | 230 | 45160 | 270.42 | 879 | 860 | 163.8 |
| C | 3 | 233 | 253151 | 1336.81 | 827 | 833 | 188.7 |
| C | 14 | 238 | 196577 | 1037.07 | 827 | 833 | 188.7 |
| C | 0 | 10 | 184268 | 971.86 | 827 | 833 | 188.7 |
| D | 8 | 195 | 516457 | 2450.23 | 858 | 837 | 210.4 |
| D | 12 | 218 | 90049 | 423.94 | 858 | 837 | 210.4 |
| D | 12 | 233 | 76740 | 360.69 | 858 | 837 | 210.4 |
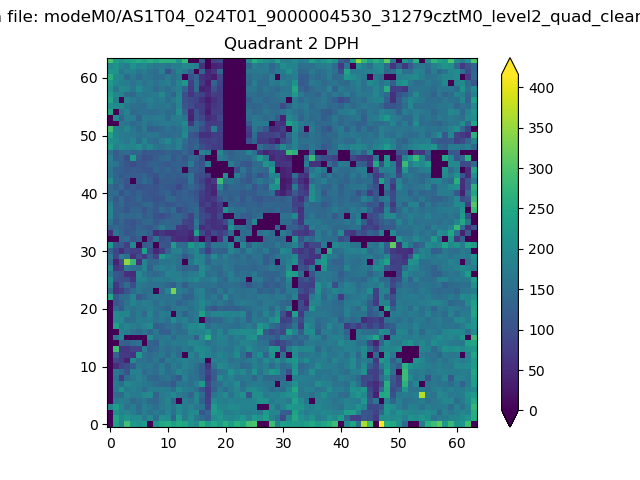
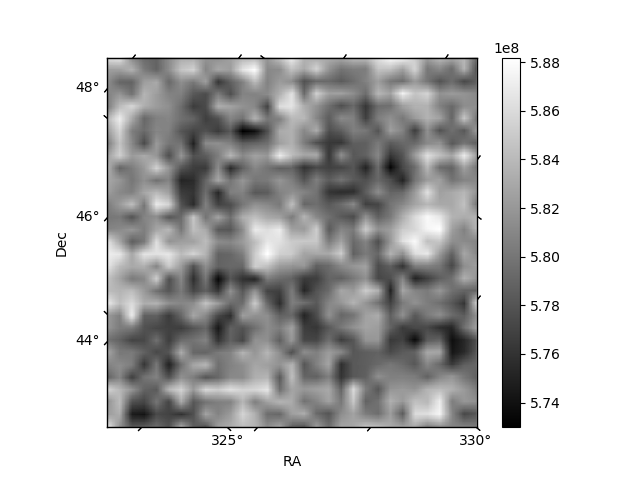
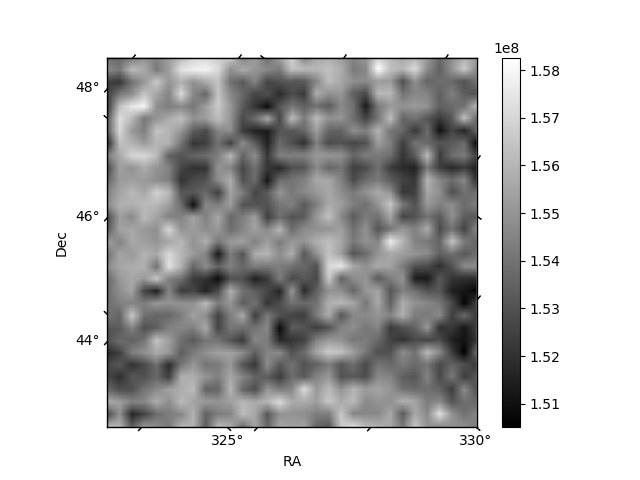
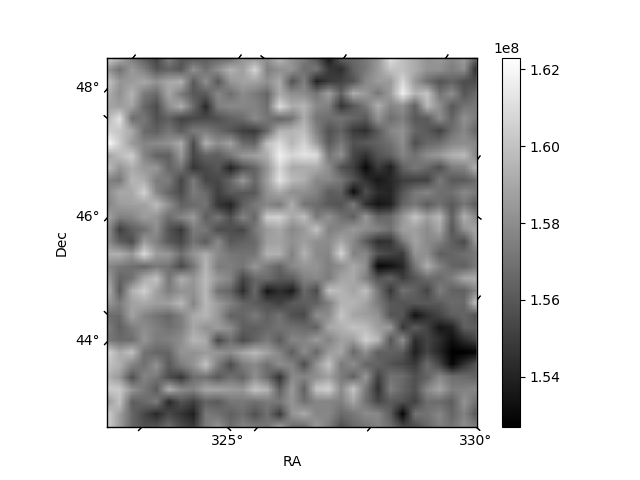
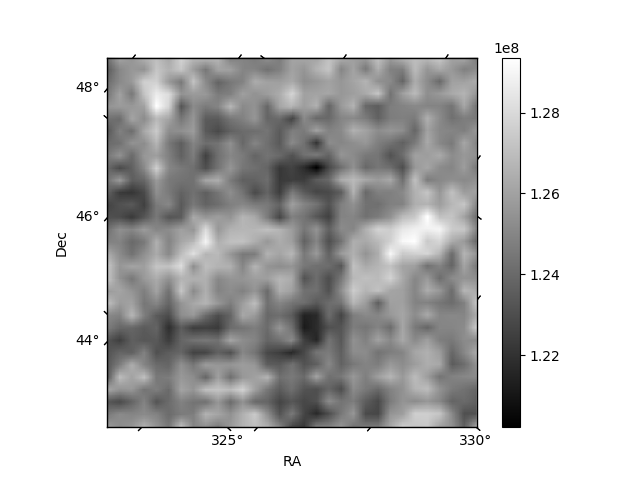
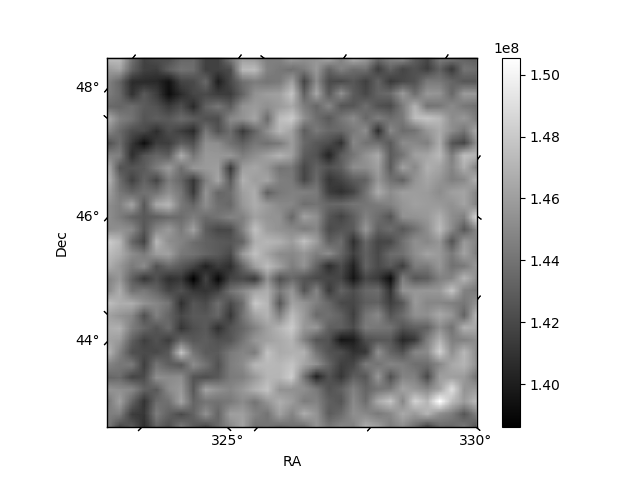
Histogram calculated using DETX and DETY for each event in the final _common_clean file
| Quadrant A | 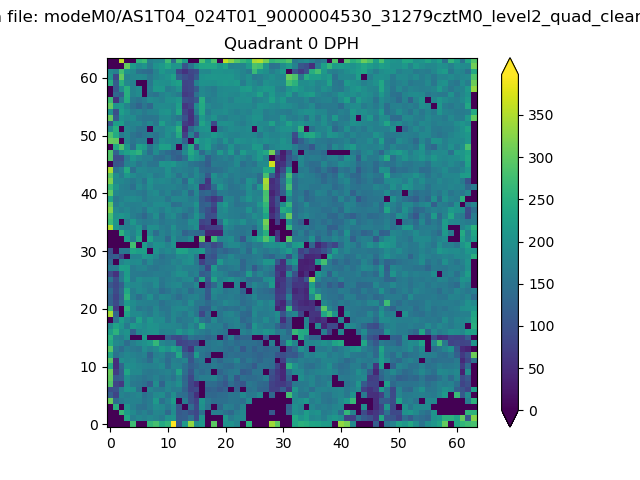 |
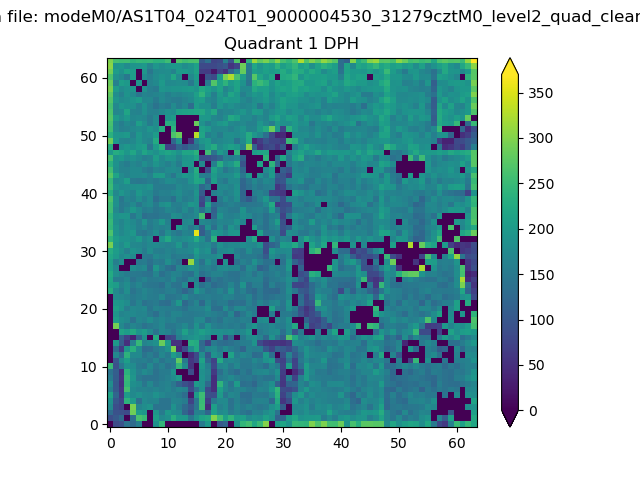 |
Quadrant B |
|---|---|---|---|
| Quadrant D | 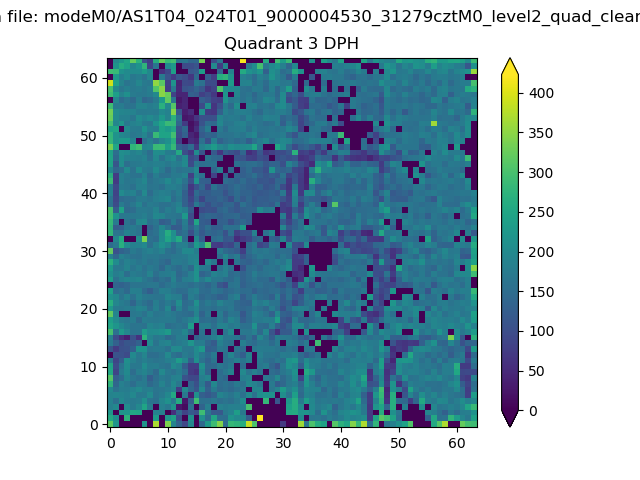 |
 |
Quadrant C |
| Plot type | Count rate plots | Images |
|---|---|---|
| Comparison with Poisson distribution Blue bars denote a histogram of data divided into 1 sec bins. Red curve is a Poisson curve with rate = median count rate of data. |
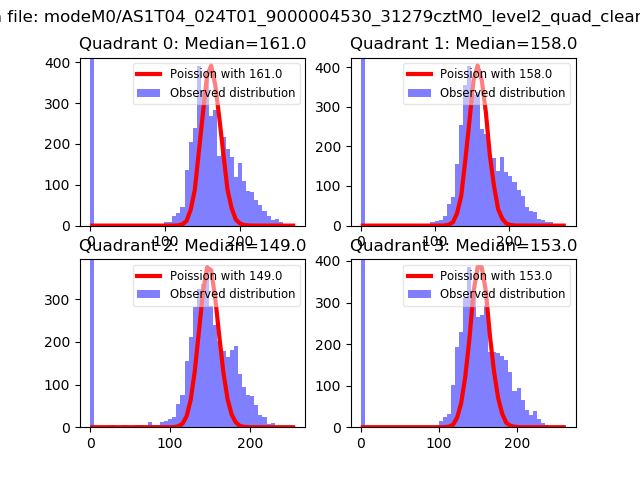 |
 |
| Quadrant-wise count rates Data is divided into 100 sec bins |
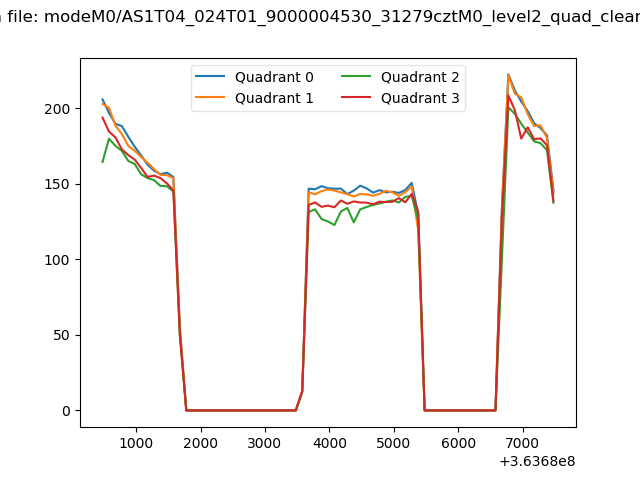 |
|
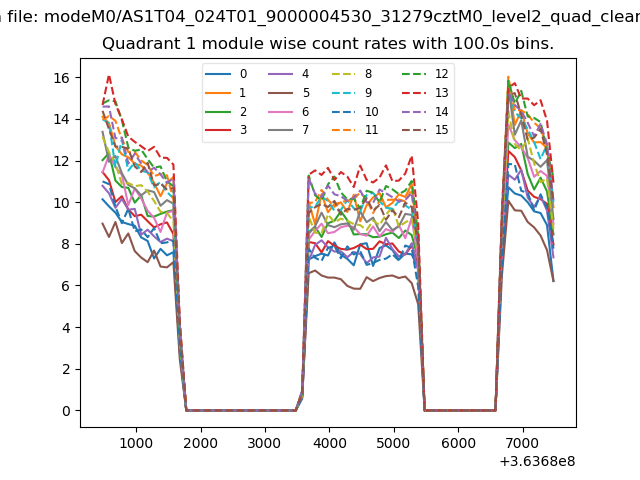
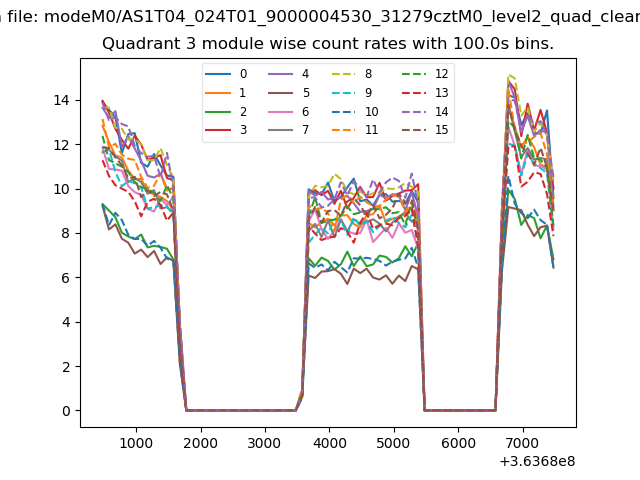
| Module-wise count rates for Quadrant A Data is divided into 100 sec bins |
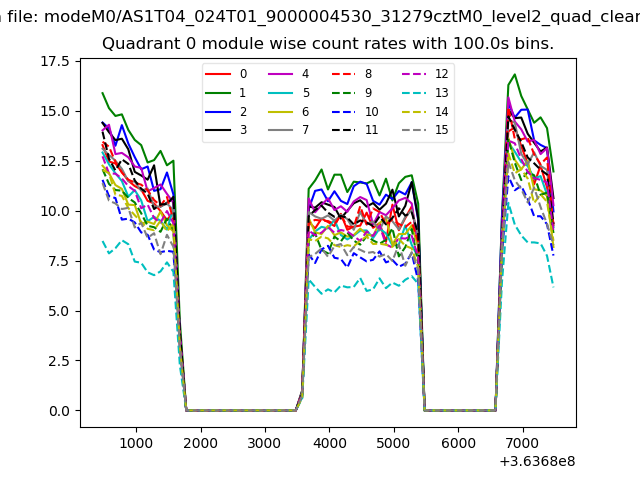 |
 |
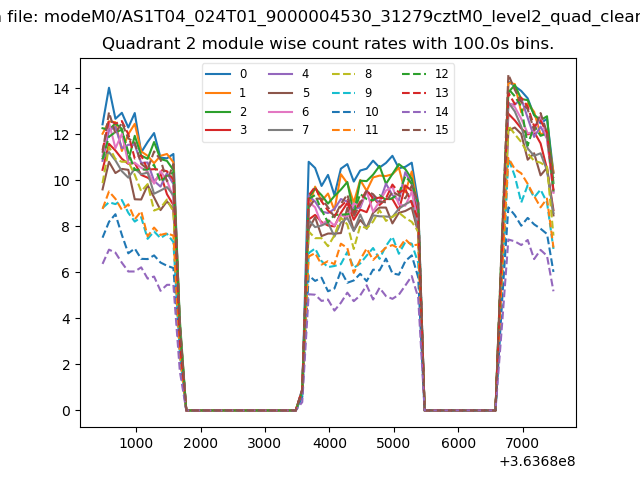
| Module-wise count rates for Quadrant B Data is divided into 100 sec bins |
 |
 |
| Module-wise count rates for Quadrant C Data is divided into 100 sec bins |
 |
 |
| Module-wise count rates for Quadrant D Data is divided into 100 sec bins |
 |
 |
| Parameter | Plot |
|---|---|
| CZT HV Monitor | 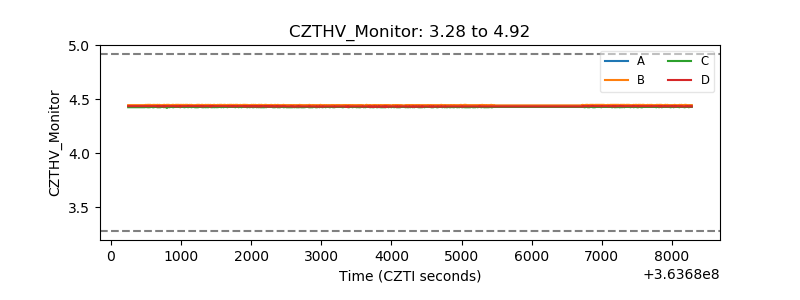 |
| D_VDD | 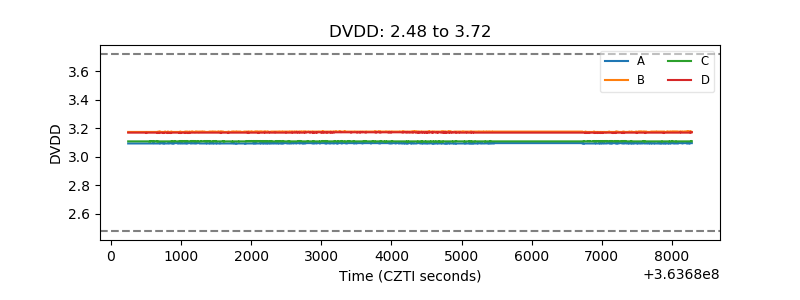 |
| Temperature 1 | 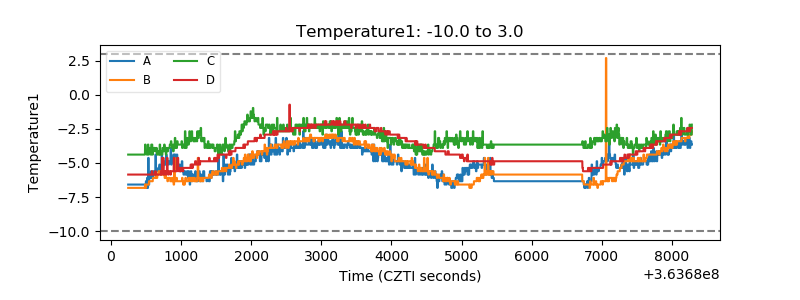 |
| Veto HV Monitor | 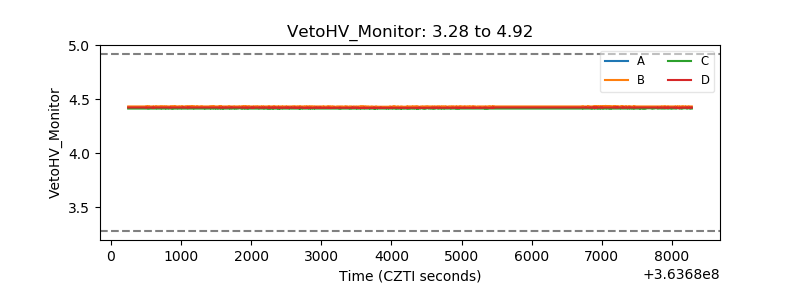 |
| Veto LLD | 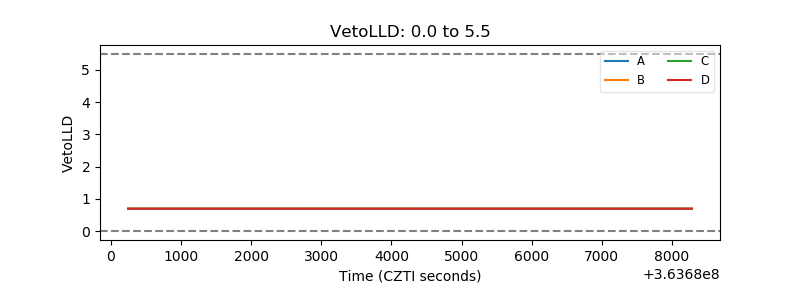 |
| Alpha Counter | 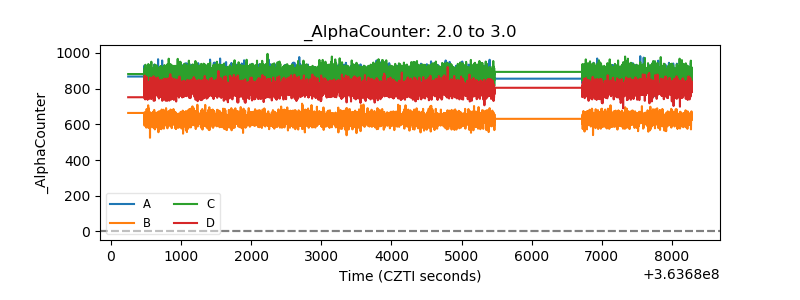 |
| _CPM_Rate | 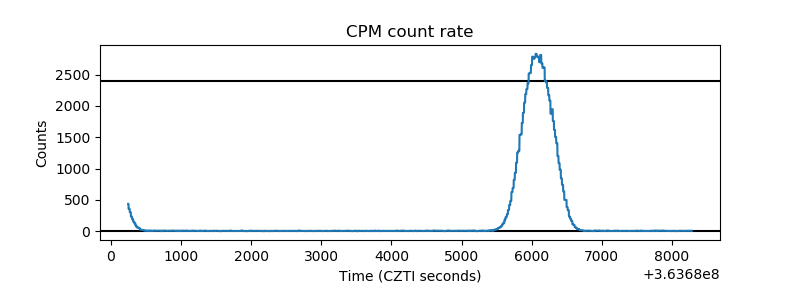 |
| CZT Counter | 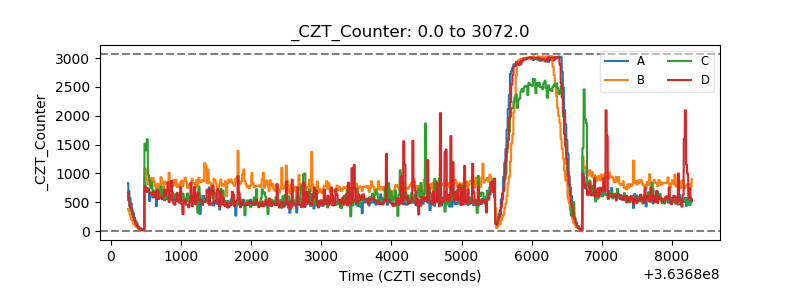 |
| +2.5 Volts monitor |  |
| +5 Volts monitor |  |
| _ROLL_ROT | 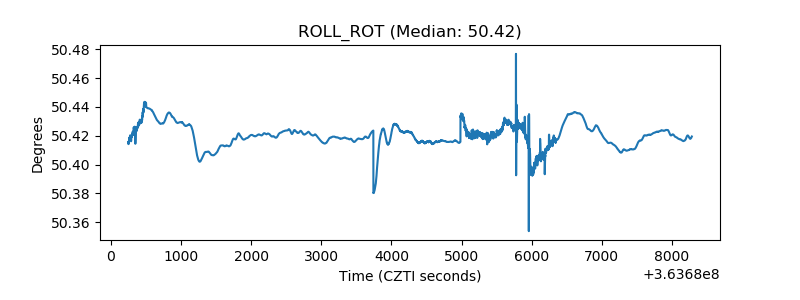 |
| _Roll_DEC | 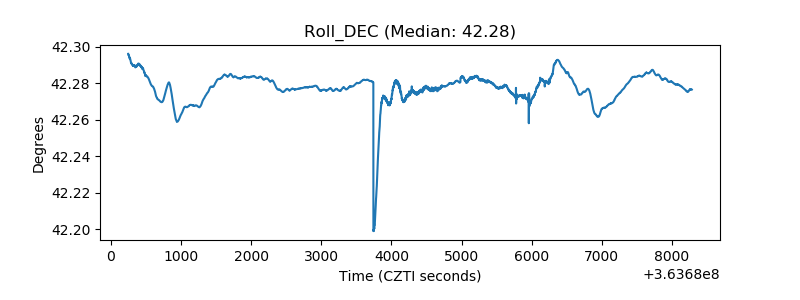 |
| _Roll_RA | 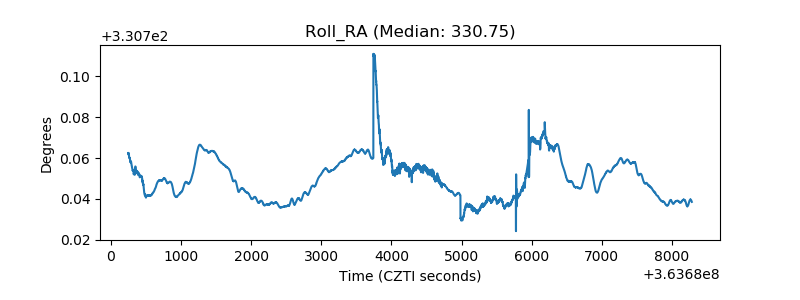 |
| Veto Counter | 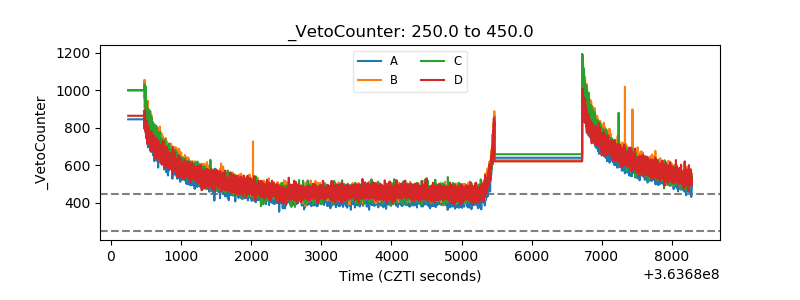 |