| Param | Original file | Final file |
|---|---|---|
| Filename | modeM0/AS1T04_024T01_9000004530_31281cztM0_level2.evt | modeM0/AS1T04_024T01_9000004530_31281cztM0_level2_quad_clean.evt |
| Size (bytes) | 584,017,920 | 75,012,480 |
| Size | 557.0 MB | 71.5 MB |
| Events in quadrant A | 3,550,316 | 474,716 |
| Events in quadrant B | 5,420,179 | 465,184 |
| Events in quadrant C | 4,237,906 | 437,340 |
| Events in quadrant D | 4,047,445 | 448,918 |
| Mode M0 | |||
|---|---|---|---|
| Quadrant | BADHDUFLAG | Total packets | Discarded packets |
| A | 0 | 14371 | 1 |
| B | 0 | 20103 | 1 |
| C | 0 | 16742 | 1 |
| D | 0 | 16078 | 1 |
| Mode SS | |||
|---|---|---|---|
| Quadrant | BADHDUFLAG | Total packets | Discarded packets |
| A | 0 | 128 | 0 |
| B | 0 | 128 | 0 |
| C | 0 | 128 | 0 |
| D | 0 | 128 | 0 |
| Mode M9 | |||
|---|---|---|---|
| Quadrant | BADHDUFLAG | Total packets | Discarded packets |
| A | 0 | 13 | 0 |
| B | 0 | 13 | 0 |
| C | 0 | 13 | 0 |
| D | 0 | 13 | 0 |
| Quadrant | Total seconds | Saturated seconds | Saturation percentage |
|---|---|---|---|
| A | 6382 | 103 | 1.613914% |
| B | 6383 | 223 | 3.493655% |
| C | 6383 | 265 | 4.151653% |
| D | 6383 | 104 | 1.629328% |
Noise dominated data is calculated using 1-second bins in cleaned event files. If a bin has >2000 counts, and if more than 50% of those come from <1% of pixels, then it is considered to be noise-dominated and hence unusable.
| Quadrant | # 1 sec bins | Bins with >0 counts | Bins with >2000 counts | High rate bins dominated by noise | Noise dominated (total time) | Noise dominated (detector-on time) | Marked lightcurve |
|---|---|---|---|---|---|---|---|
| A | 7672 | 6383 | 0 | 0 | 0.00% | 0.00% | 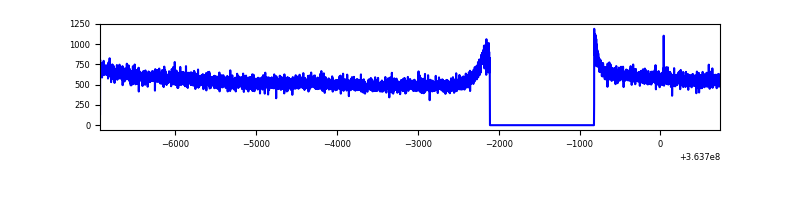 |
| B | 7673 | 6384 | 19 | 19 | 0.25% | 0.30% | 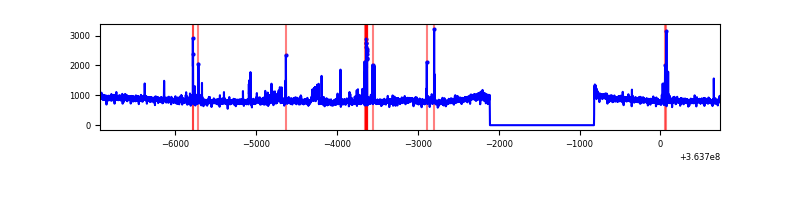 |
| C | 7673 | 6384 | 12 | 12 | 0.16% | 0.19% | 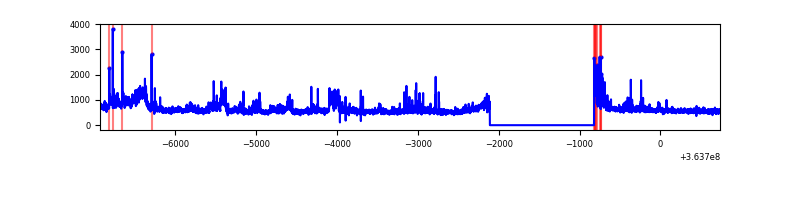 |
| D | 7673 | 6384 | 17 | 17 | 0.22% | 0.27% | 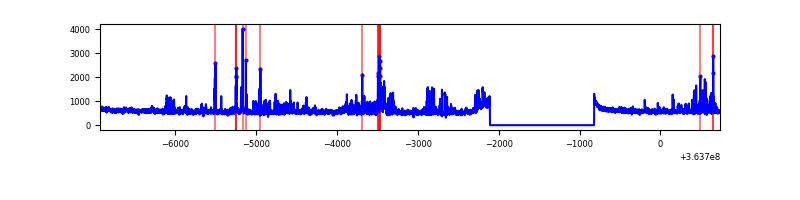 |
Top three noisy pixels from each quadrant. If the there are fewer than three noisy pixels in the level2.evt file, extra rows are filled as -1
| Pixel properties | Quadrant properties | ||||||
|---|---|---|---|---|---|---|---|
| Quadrant | DetID | PixID | Counts | Sigma | Mean | Median | Sigma |
| A | 13 | 254 | 14002 | 73.12 | 920 | 905 | 179.1 |
| A | 3 | 137 | 8536 | 42.6 | 920 | 905 | 179.1 |
| A | 0 | 226 | 7841 | 38.72 | 920 | 905 | 179.1 |
| B | 6 | 159 | 1676284 | 9995.58 | 892 | 872 | 167.6 |
| B | 4 | 80 | 116537 | 690.06 | 892 | 872 | 167.6 |
| B | 10 | 245 | 80653 | 475.98 | 892 | 872 | 167.6 |
| C | 3 | 233 | 561001 | 2871.86 | 853 | 860 | 195.0 |
| C | 0 | 10 | 168344 | 858.7 | 853 | 860 | 195.0 |
| C | 14 | 238 | 151691 | 773.32 | 853 | 860 | 195.0 |
| D | 8 | 195 | 589887 | 2723.71 | 879 | 860 | 216.3 |
| D | 2 | 250 | 105058 | 481.82 | 879 | 860 | 216.3 |
| D | 2 | 234 | 24841 | 110.89 | 879 | 860 | 216.3 |
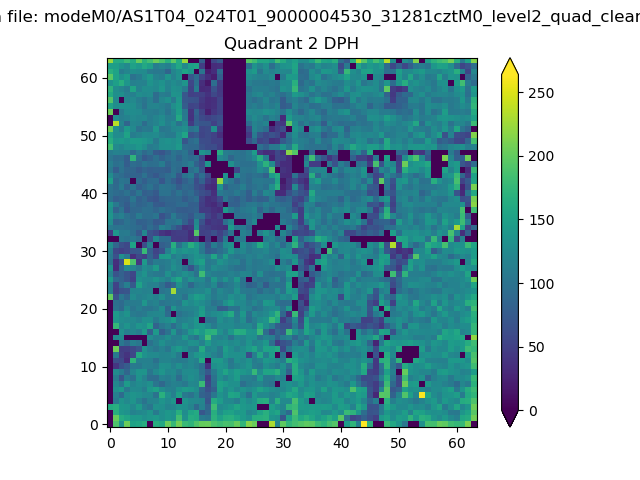
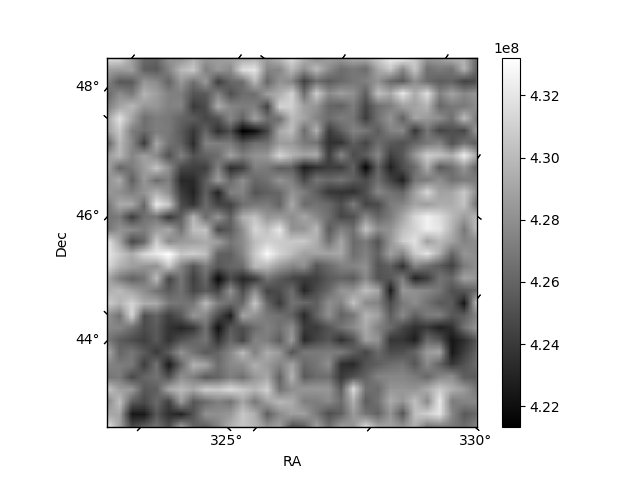
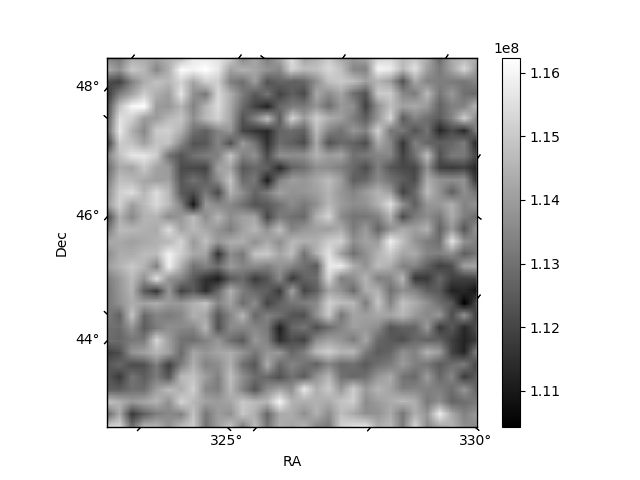
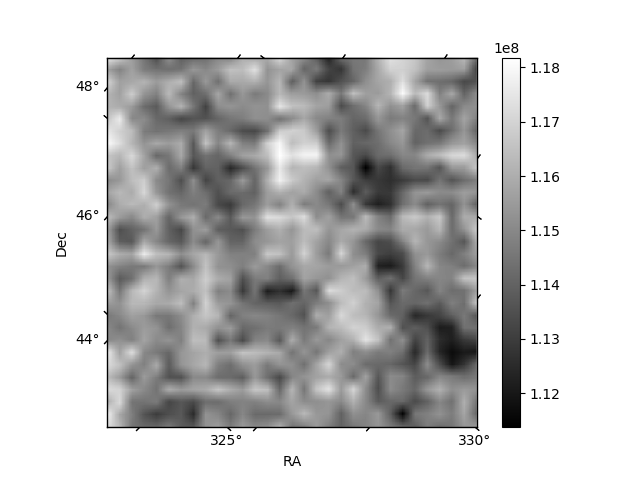
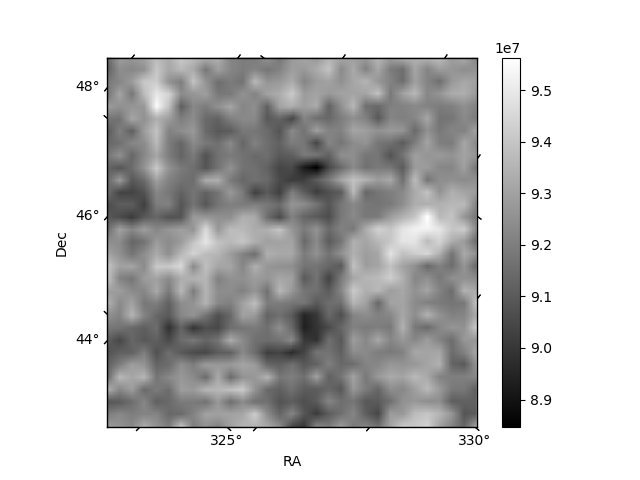
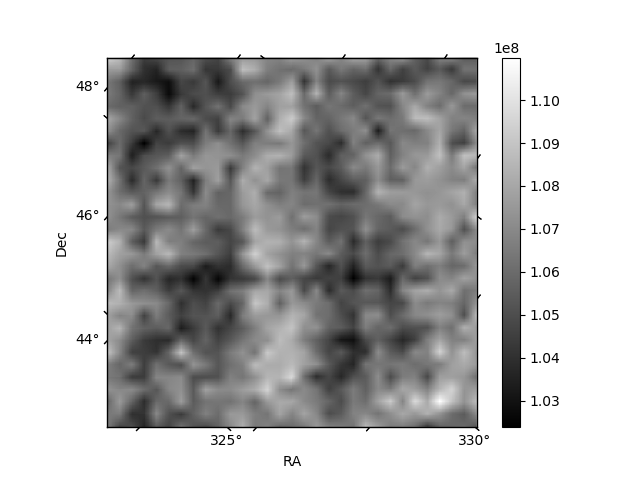
Histogram calculated using DETX and DETY for each event in the final _common_clean file
| Quadrant A | 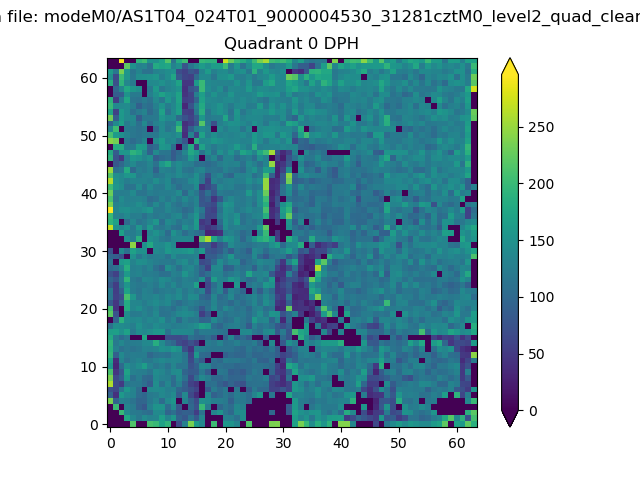 |
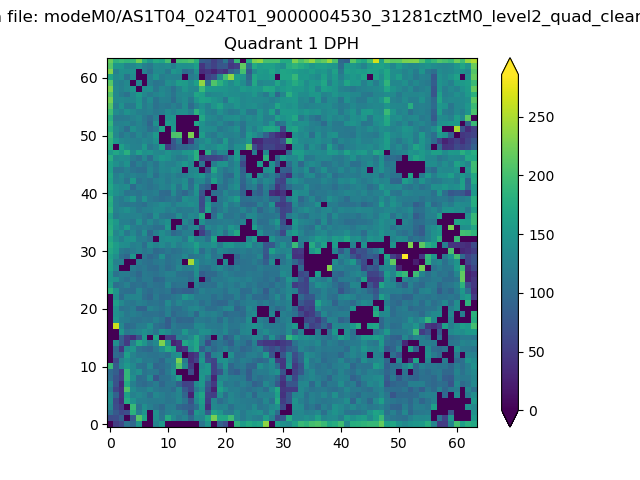 |
Quadrant B |
|---|---|---|---|
| Quadrant D | 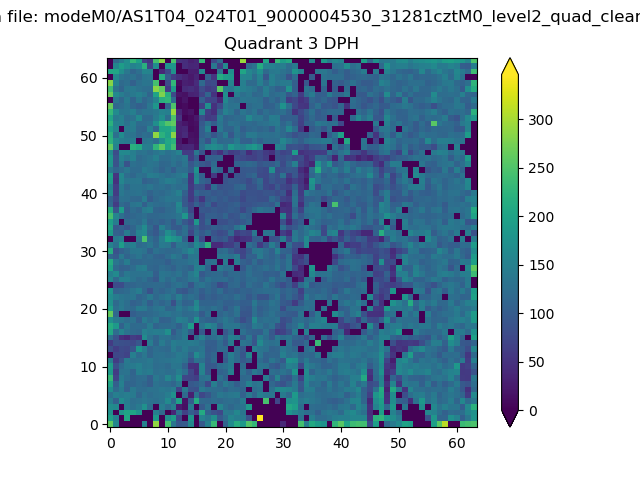 |
 |
Quadrant C |
| Plot type | Count rate plots | Images |
|---|---|---|
| Comparison with Poisson distribution Blue bars denote a histogram of data divided into 1 sec bins. Red curve is a Poisson curve with rate = median count rate of data. |
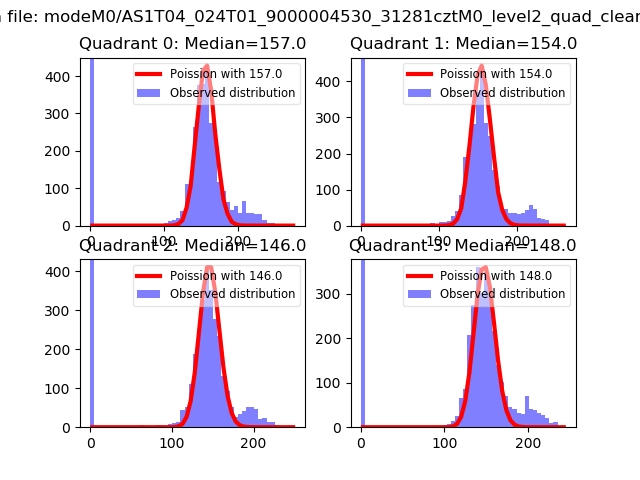 |
 |
| Quadrant-wise count rates Data is divided into 100 sec bins |
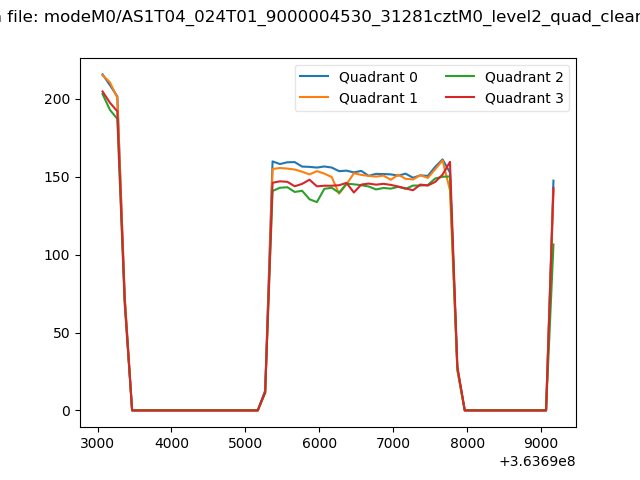 |
|
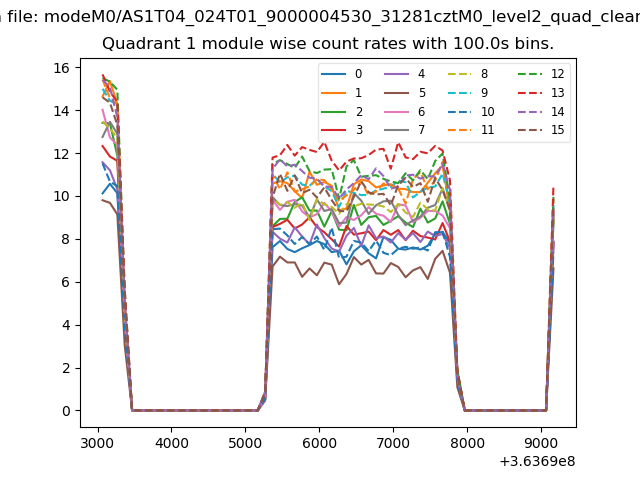
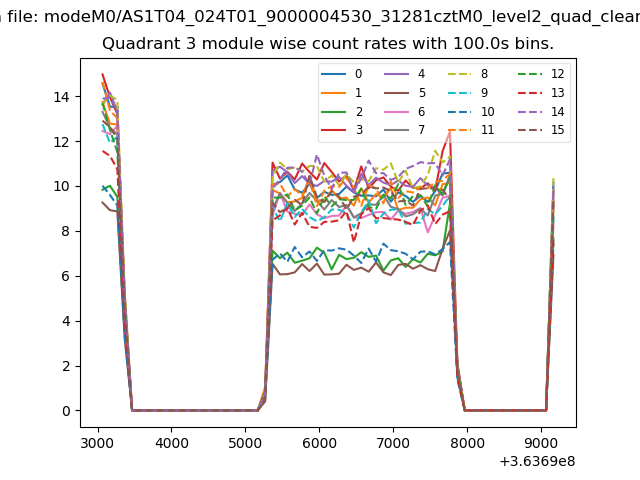
| Module-wise count rates for Quadrant A Data is divided into 100 sec bins |
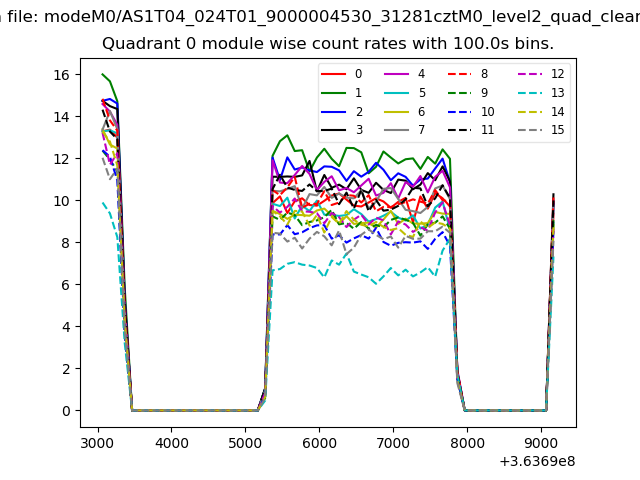 |
 |
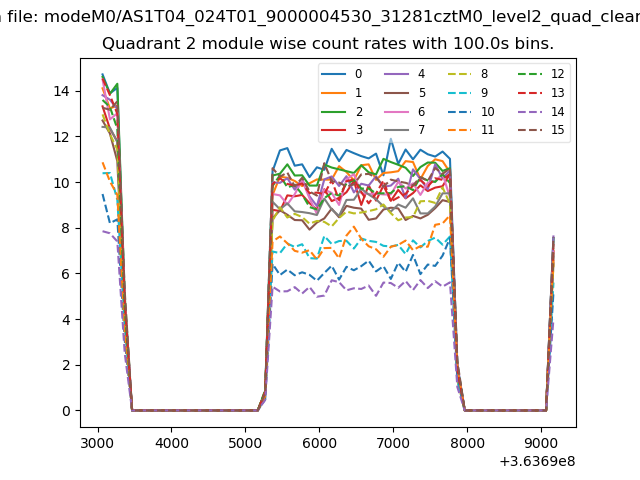
| Module-wise count rates for Quadrant B Data is divided into 100 sec bins |
 |
 |
| Module-wise count rates for Quadrant C Data is divided into 100 sec bins |
 |
 |
| Module-wise count rates for Quadrant D Data is divided into 100 sec bins |
 |
 |
| Parameter | Plot |
|---|---|
| CZT HV Monitor | 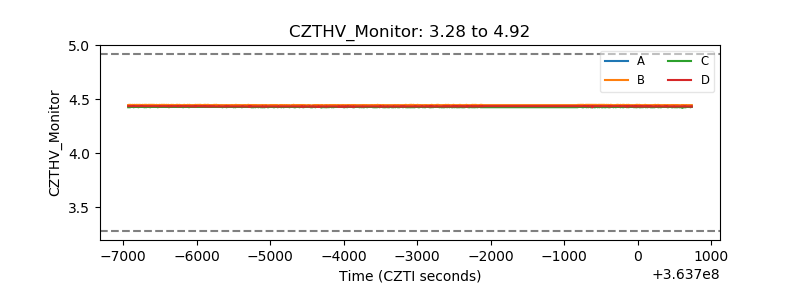 |
| D_VDD | 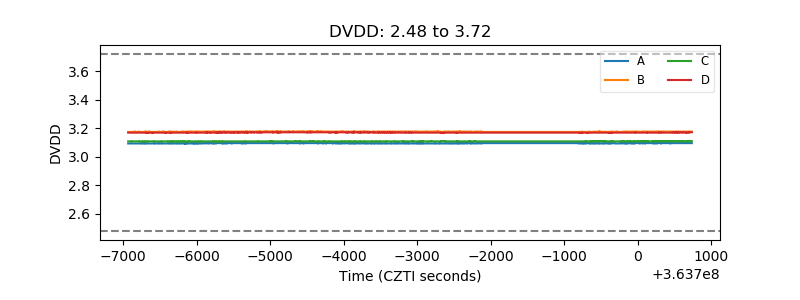 |
| Temperature 1 | 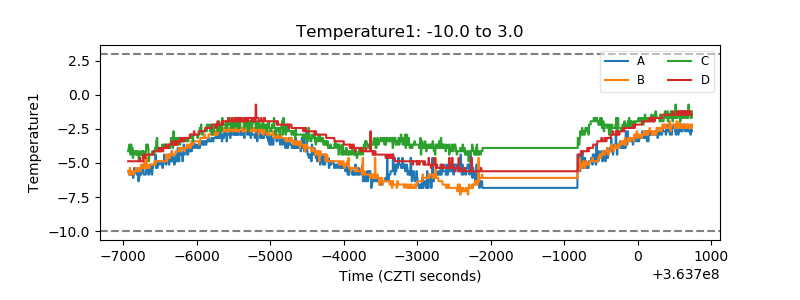 |
| Veto HV Monitor |  |
| Veto LLD | 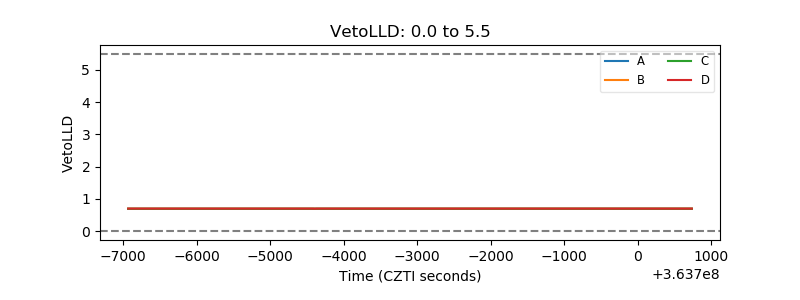 |
| Alpha Counter | 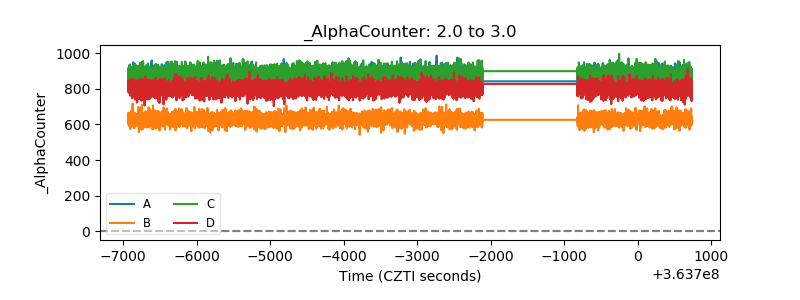 |
| _CPM_Rate | 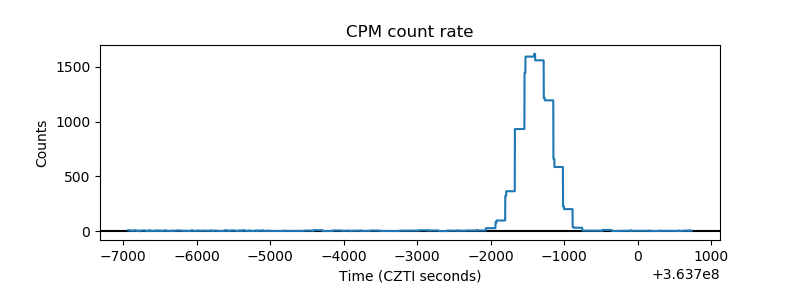 |
| CZT Counter | 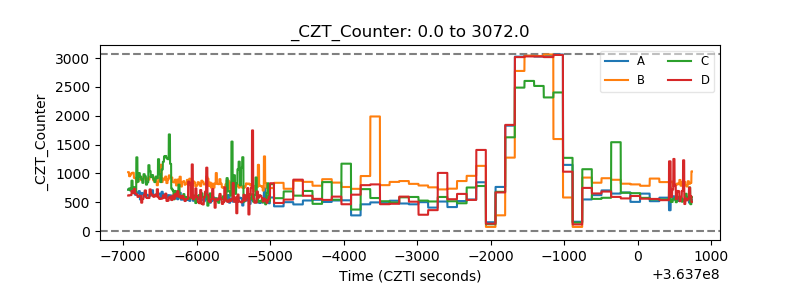 |
| +2.5 Volts monitor |  |
| +5 Volts monitor |  |
| _ROLL_ROT | 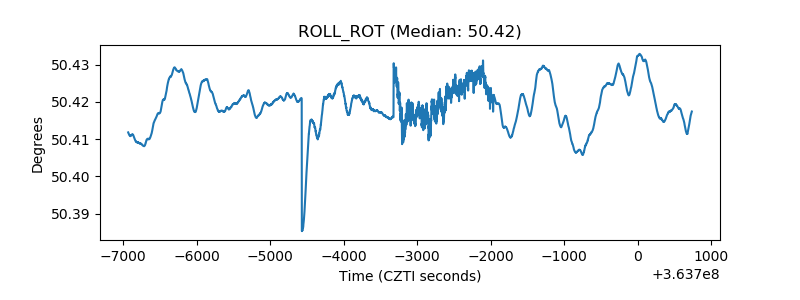 |
| _Roll_DEC | 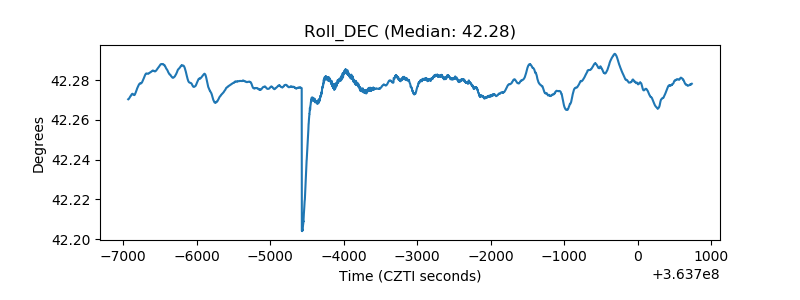 |
| _Roll_RA | 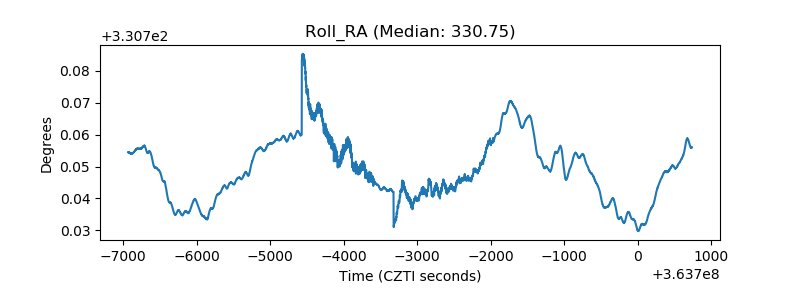 |
| Veto Counter | 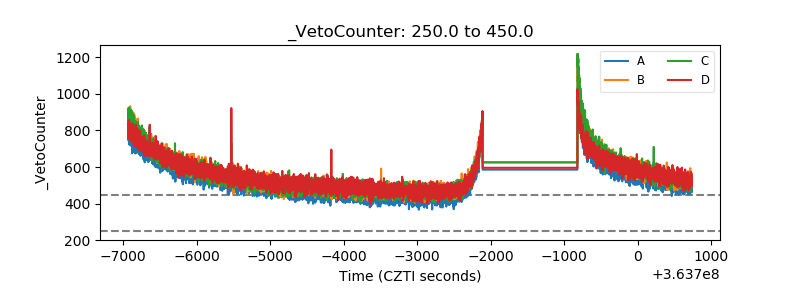 |