| Param | Original file | Final file |
|---|---|---|
| Filename | modeM0/AS1T04_024T01_9000004530_31282cztM0_level2.evt | modeM0/AS1T04_024T01_9000004530_31282cztM0_level2_quad_clean.evt |
| Size (bytes) | 567,253,440 | 73,198,080 |
| Size | 541.0 MB | 69.8 MB |
| Events in quadrant A | 3,491,254 | 457,188 |
| Events in quadrant B | 5,387,910 | 447,191 |
| Events in quadrant C | 3,874,755 | 424,684 |
| Events in quadrant D | 3,985,992 | 434,312 |
| Mode M0 | |||
|---|---|---|---|
| Quadrant | BADHDUFLAG | Total packets | Discarded packets |
| A | 0 | 14150 | 2 |
| B | 0 | 20263 | 2 |
| C | 0 | 15455 | 2 |
| D | 0 | 15980 | 2 |
| Mode SS | |||
|---|---|---|---|
| Quadrant | BADHDUFLAG | Total packets | Discarded packets |
| A | 0 | 132 | 0 |
| B | 0 | 132 | 0 |
| C | 0 | 132 | 0 |
| D | 0 | 132 | 0 |
| Mode M9 | |||
|---|---|---|---|
| Quadrant | BADHDUFLAG | Total packets | Discarded packets |
| A | 0 | 12 | 0 |
| B | 0 | 12 | 0 |
| C | 0 | 12 | 0 |
| D | 0 | 12 | 0 |
| Quadrant | Total seconds | Saturated seconds | Saturation percentage |
|---|---|---|---|
| A | 6493 | 112 | 1.724935% |
| B | 6493 | 207 | 3.188049% |
| C | 6494 | 236 | 3.634124% |
| D | 6494 | 106 | 1.632276% |
Noise dominated data is calculated using 1-second bins in cleaned event files. If a bin has >2000 counts, and if more than 50% of those come from <1% of pixels, then it is considered to be noise-dominated and hence unusable.
| Quadrant | # 1 sec bins | Bins with >0 counts | Bins with >2000 counts | High rate bins dominated by noise | Noise dominated (total time) | Noise dominated (detector-on time) | Marked lightcurve |
|---|---|---|---|---|---|---|---|
| A | 7693 | 6494 | 0 | 0 | 0.00% | 0.00% | 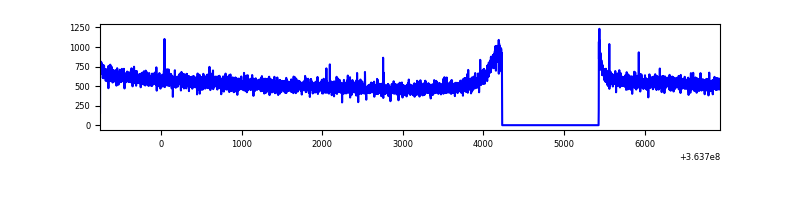 |
| B | 7693 | 6494 | 7 | 7 | 0.09% | 0.11% | 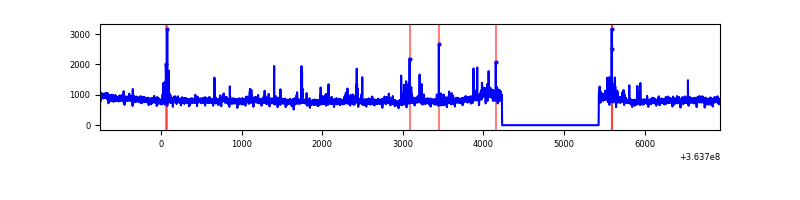 |
| C | 7694 | 6495 | 10 | 10 | 0.13% | 0.15% | 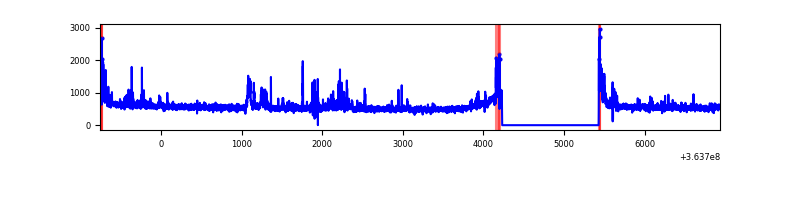 |
| D | 7694 | 6495 | 20 | 20 | 0.26% | 0.31% |  |
Top three noisy pixels from each quadrant. If the there are fewer than three noisy pixels in the level2.evt file, extra rows are filled as -1
| Pixel properties | Quadrant properties | ||||||
|---|---|---|---|---|---|---|---|
| Quadrant | DetID | PixID | Counts | Sigma | Mean | Median | Sigma |
| A | 13 | 254 | 13440 | 69.73 | 905 | 890 | 180.0 |
| A | 3 | 137 | 8522 | 42.4 | 905 | 890 | 180.0 |
| A | 0 | 226 | 7678 | 37.71 | 905 | 890 | 180.0 |
| B | 6 | 159 | 1723251 | 10401.33 | 879 | 858 | 165.6 |
| B | 4 | 80 | 158235 | 950.38 | 879 | 858 | 165.6 |
| B | 4 | 187 | 25831 | 150.81 | 879 | 858 | 165.6 |
| C | 3 | 233 | 204288 | 1051.73 | 842 | 851 | 193.4 |
| C | 0 | 10 | 178580 | 918.82 | 842 | 851 | 193.4 |
| C | 14 | 238 | 161102 | 828.46 | 842 | 851 | 193.4 |
| D | 8 | 195 | 552800 | 2554.23 | 868 | 848 | 216.1 |
| D | 2 | 250 | 88927 | 407.6 | 868 | 848 | 216.1 |
| D | 2 | 120 | 36261 | 163.88 | 868 | 848 | 216.1 |
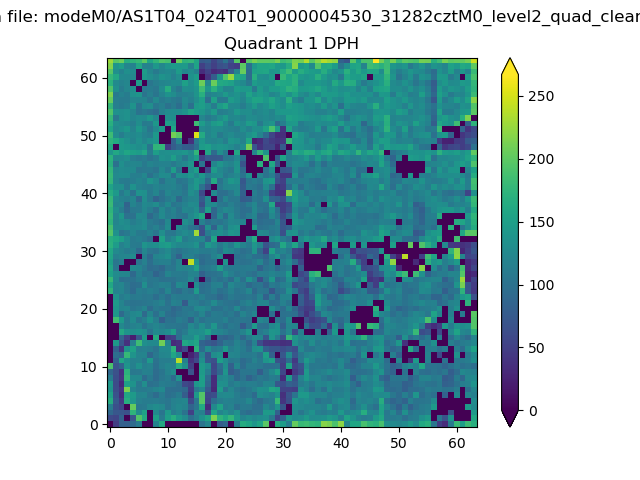
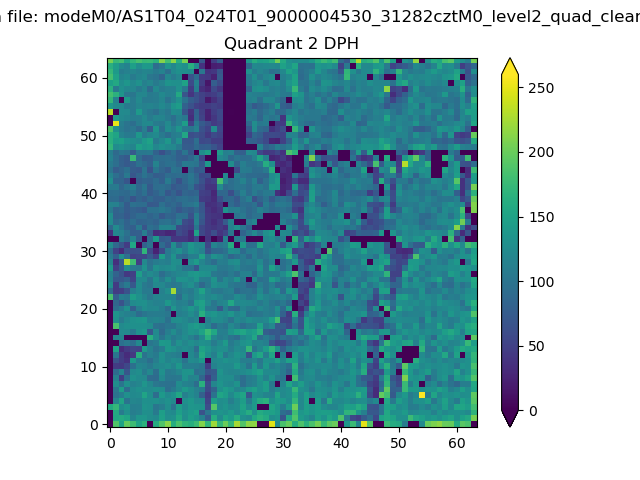
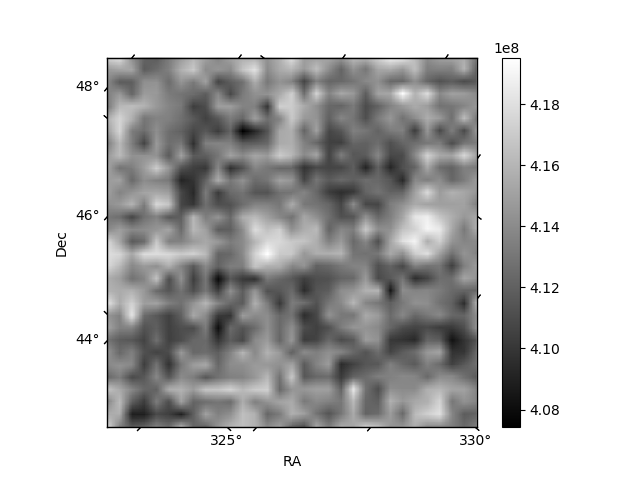
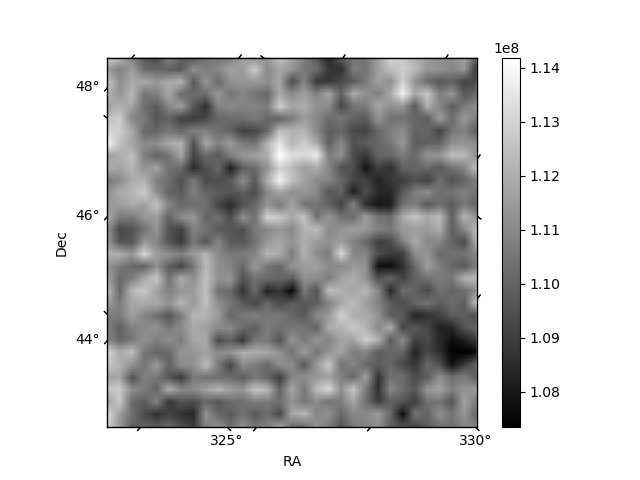
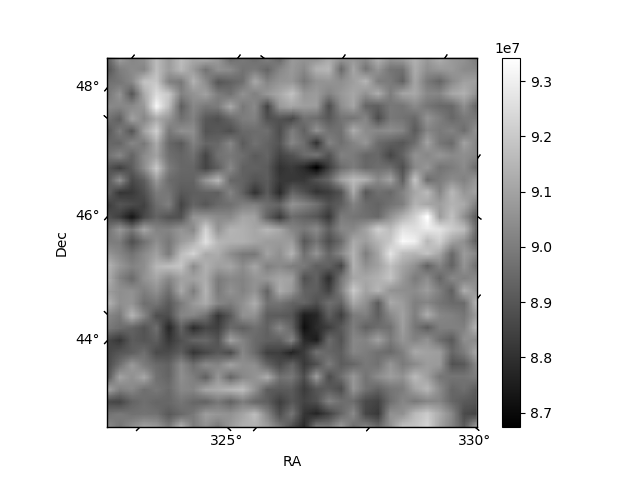
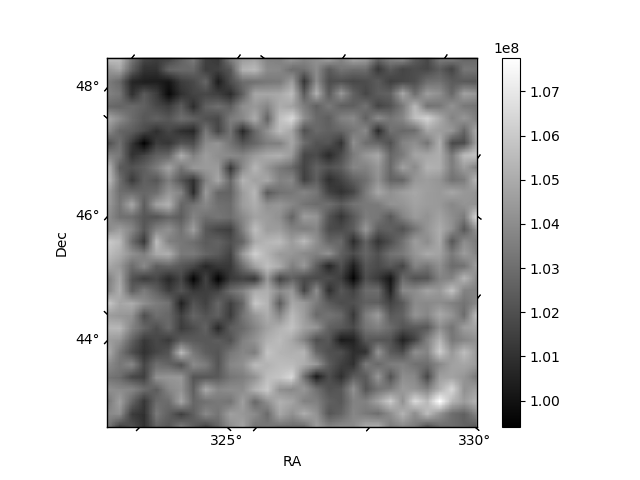
Histogram calculated using DETX and DETY for each event in the final _common_clean file
| Quadrant A | 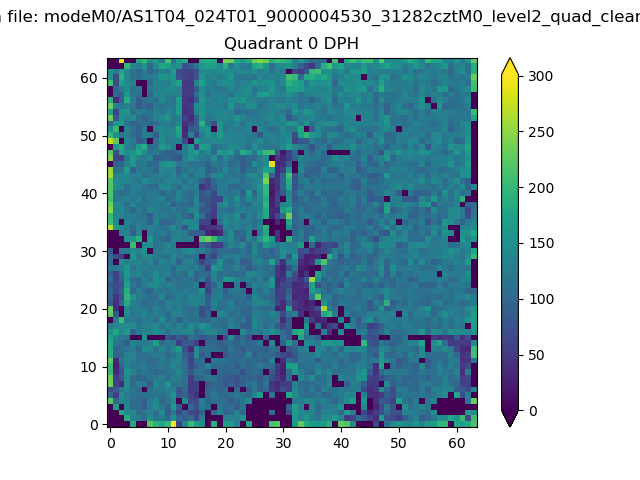 |
 |
Quadrant B |
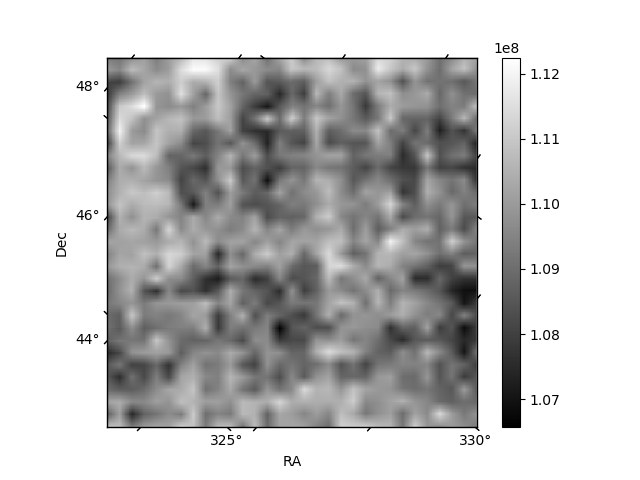
|---|---|---|---|
| Quadrant D | 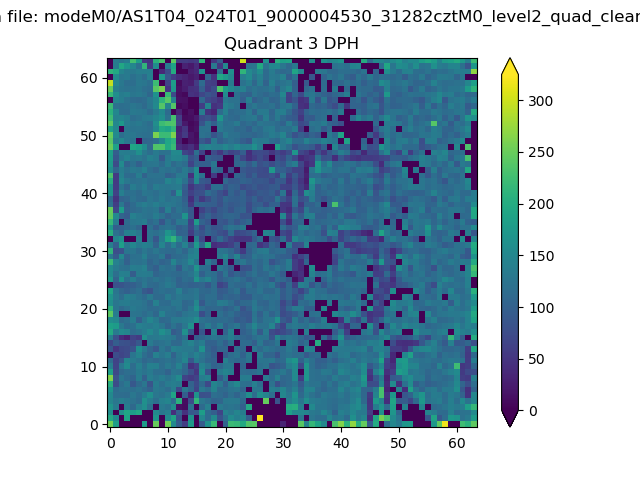 |
 |
Quadrant C |
| Plot type | Count rate plots | Images |
|---|---|---|
| Comparison with Poisson distribution Blue bars denote a histogram of data divided into 1 sec bins. Red curve is a Poisson curve with rate = median count rate of data. |
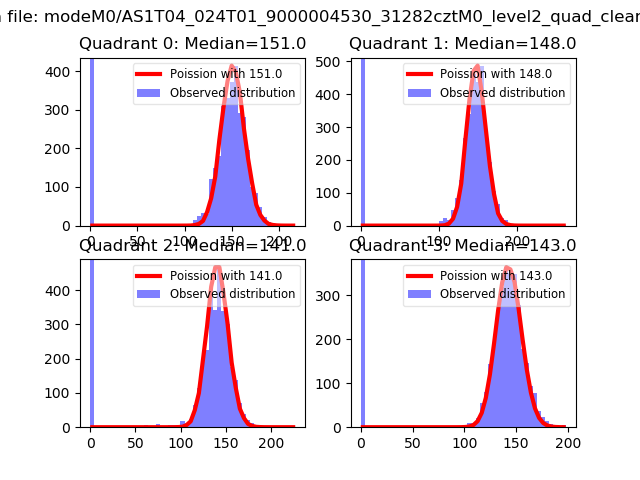 |
 |
| Quadrant-wise count rates Data is divided into 100 sec bins |
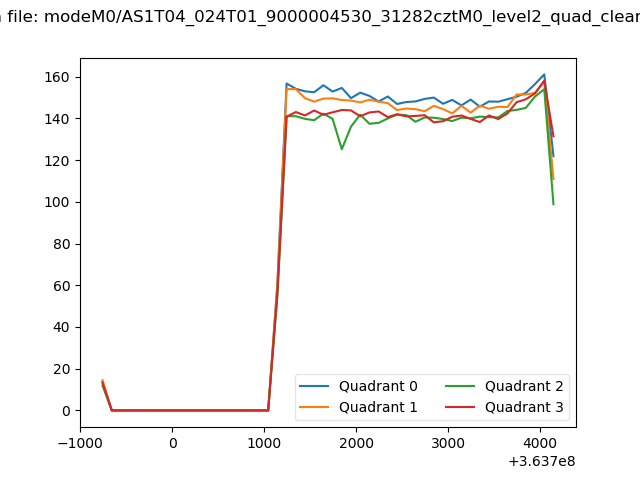 |
|
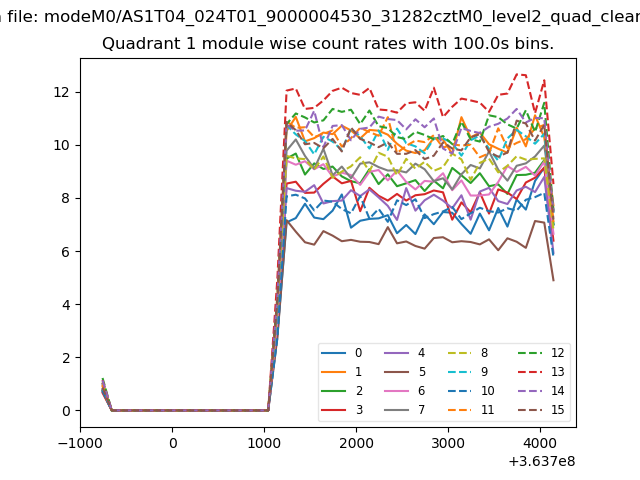
| Module-wise count rates for Quadrant A Data is divided into 100 sec bins |
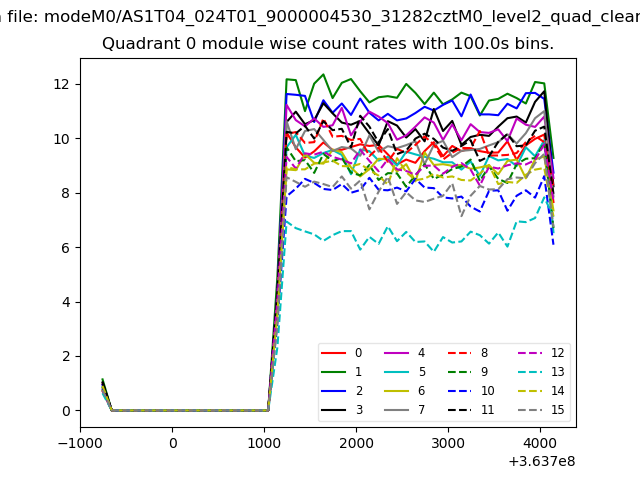 |
 |
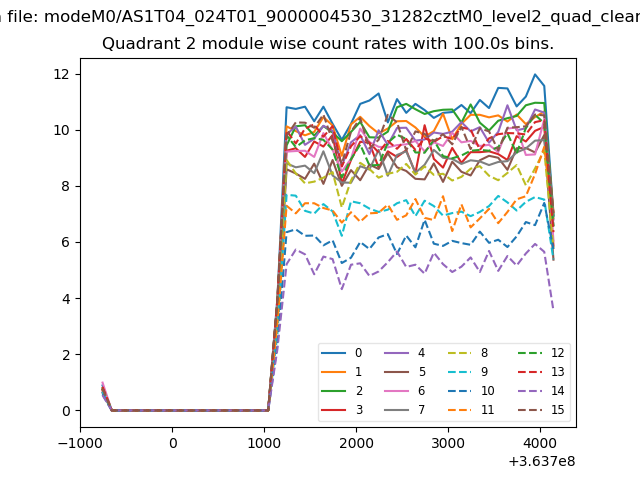
| Module-wise count rates for Quadrant B Data is divided into 100 sec bins |
 |
 |
| Module-wise count rates for Quadrant C Data is divided into 100 sec bins |
 |
 |
| Module-wise count rates for Quadrant D Data is divided into 100 sec bins |
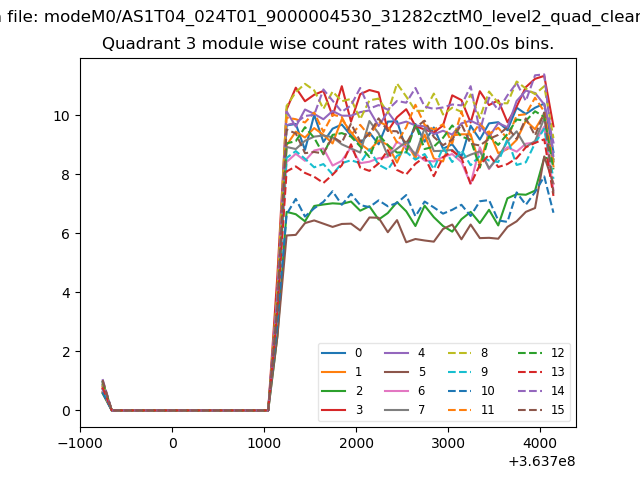 |
 |
| Parameter | Plot |
|---|---|
| CZT HV Monitor | 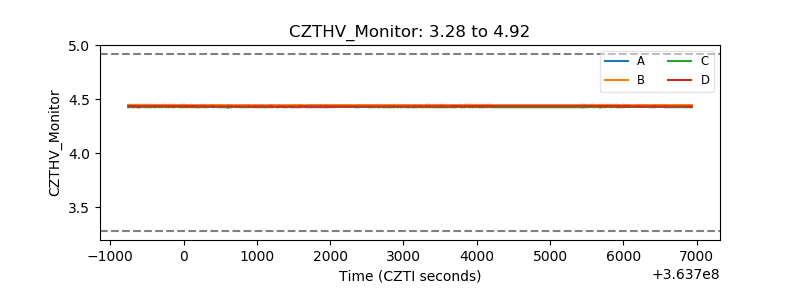 |
| D_VDD | 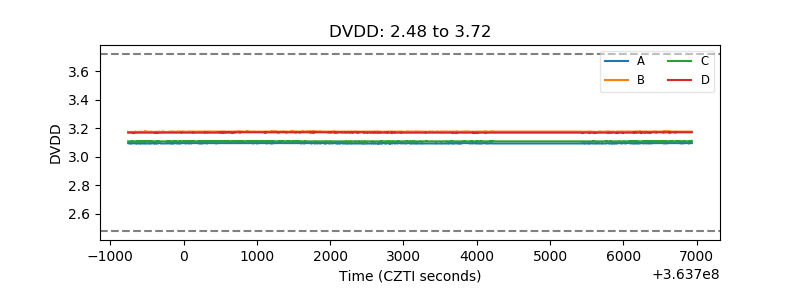 |
| Temperature 1 | 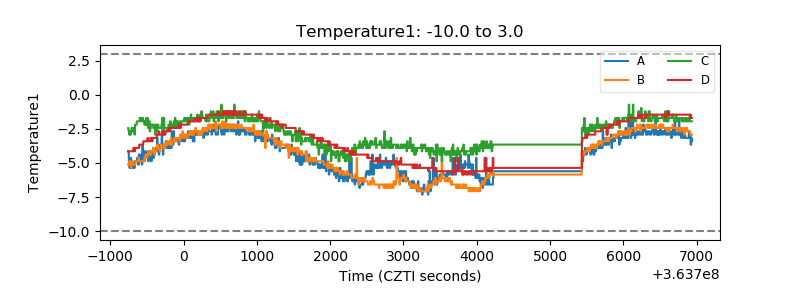 |
| Veto HV Monitor | 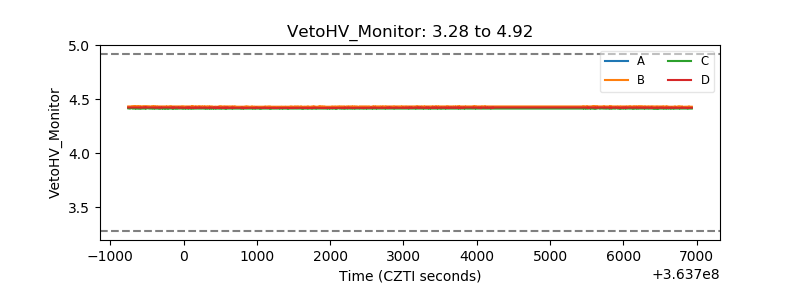 |
| Veto LLD |  |
| Alpha Counter | 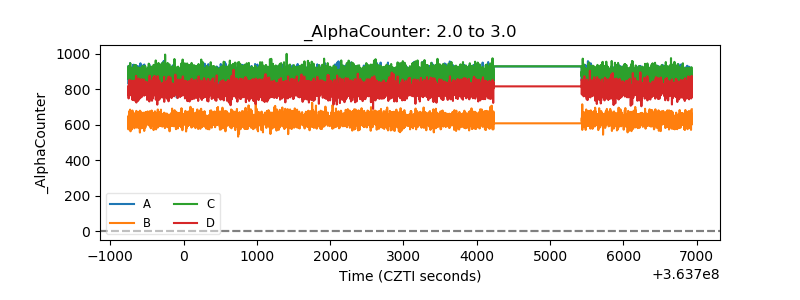 |
| _CPM_Rate | 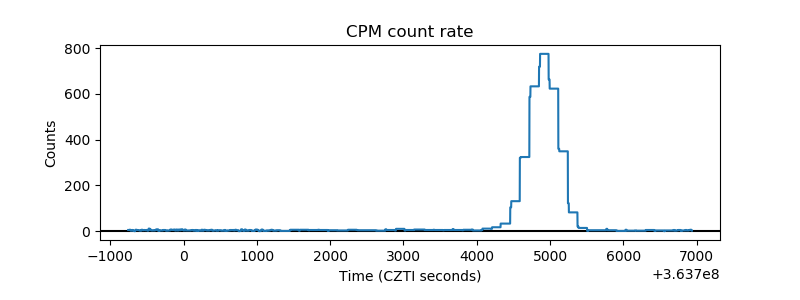 |
| CZT Counter | 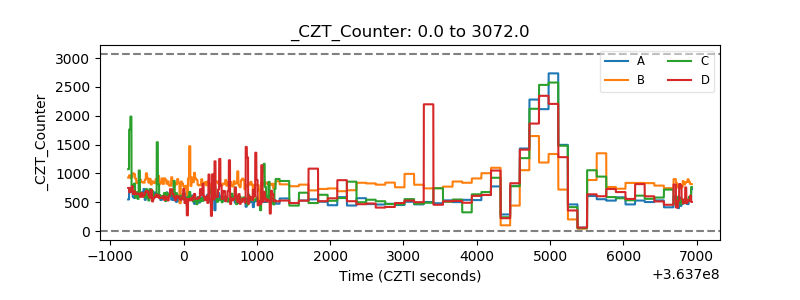 |
| +2.5 Volts monitor | 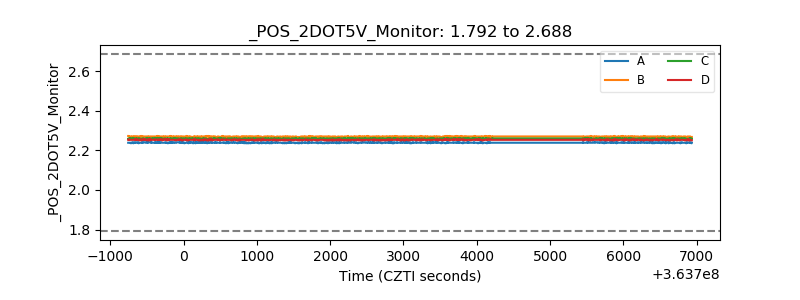 |
| +5 Volts monitor |  |
| _ROLL_ROT | 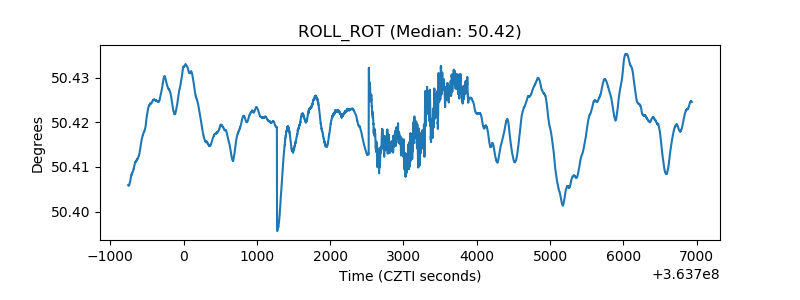 |
| _Roll_DEC | 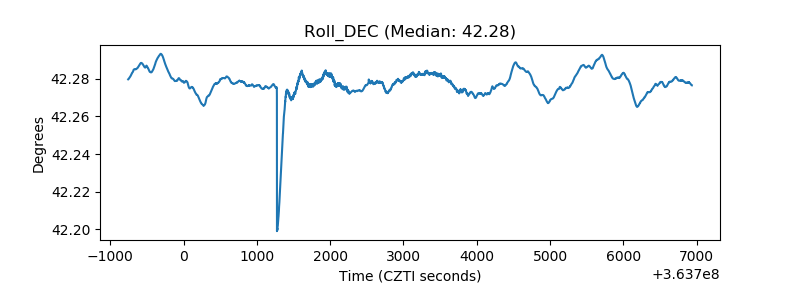 |
| _Roll_RA | 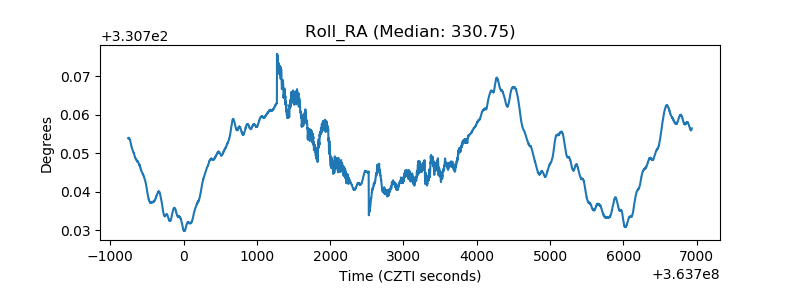 |
| Veto Counter | 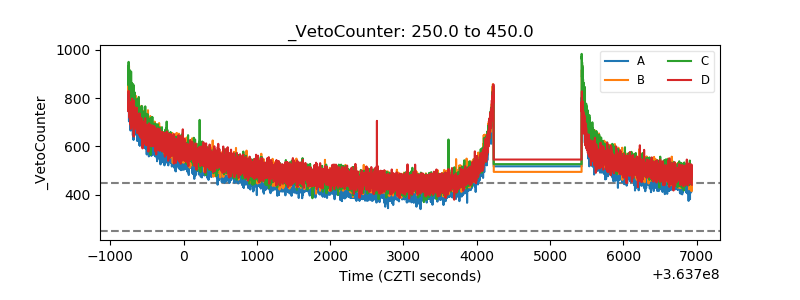 |