| Param | Original file | Final file |
|---|---|---|
| Filename | modeM0/AS1T04_024T01_9000004530_31289cztM0_level2.evt | modeM0/AS1T04_024T01_9000004530_31289cztM0_level2_quad_clean.evt |
| Size (bytes) | 1,538,985,600 | 250,937,280 |
| Size | 1.4 GB | 239.3 MB |
| Events in quadrant A | 8,996,880 | 1,611,737 |
| Events in quadrant B | 14,937,958 | 1,595,951 |
| Events in quadrant C | 10,043,177 | 1,528,215 |
| Events in quadrant D | 11,332,465 | 1,538,892 |
| Mode M0 | |||
|---|---|---|---|
| Quadrant | BADHDUFLAG | Total packets | Discarded packets |
| A | 0 | 39688 | 4 |
| B | 0 | 58974 | 4 |
| C | 0 | 42388 | 4 |
| D | 0 | 47435 | 4 |
| Mode SS | |||
|---|---|---|---|
| Quadrant | BADHDUFLAG | Total packets | Discarded packets |
| A | 0 | 390 | 0 |
| B | 0 | 390 | 0 |
| C | 0 | 390 | 0 |
| D | 0 | 390 | 0 |
| Mode M9 | |||
|---|---|---|---|
| Quadrant | BADHDUFLAG | Total packets | Discarded packets |
| A | 0 | 24 | 0 |
| B | 0 | 24 | 0 |
| C | 0 | 24 | 0 |
| D | 0 | 24 | 0 |
| Quadrant | Total seconds | Saturated seconds | Saturation percentage |
|---|---|---|---|
| A | 19248 | 112 | 0.581879% |
| B | 19249 | 422 | 2.192322% |
| C | 19249 | 732 | 3.802795% |
| D | 19249 | 578 | 3.002753% |
Noise dominated data is calculated using 1-second bins in cleaned event files. If a bin has >2000 counts, and if more than 50% of those come from <1% of pixels, then it is considered to be noise-dominated and hence unusable.
| Quadrant | # 1 sec bins | Bins with >0 counts | Bins with >2000 counts | High rate bins dominated by noise | Noise dominated (total time) | Noise dominated (detector-on time) | Marked lightcurve |
|---|---|---|---|---|---|---|---|
| A | 21523 | 19252 | 0 | 0 | 0.00% | 0.00% | 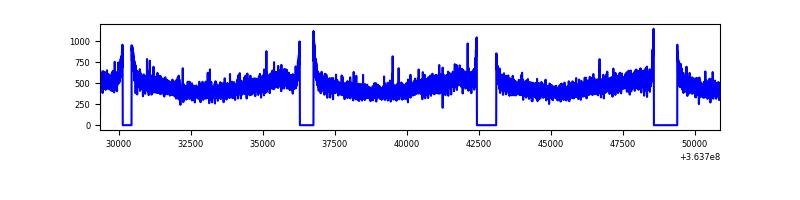 |
| B | 21524 | 19253 | 18 | 18 | 0.08% | 0.09% | 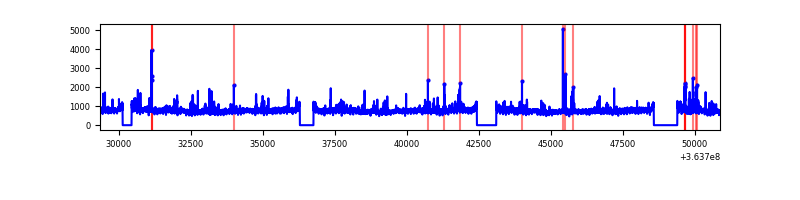 |
| C | 21524 | 19253 | 14 | 14 | 0.07% | 0.07% | 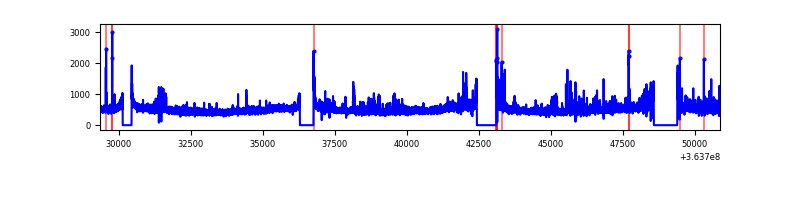 |
| D | 21524 | 19253 | 342 | 342 | 1.59% | 1.78% | 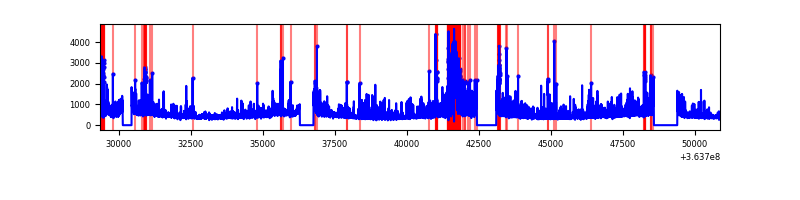 |
Top three noisy pixels from each quadrant. If the there are fewer than three noisy pixels in the level2.evt file, extra rows are filled as -1
| Pixel properties | Quadrant properties | ||||||
|---|---|---|---|---|---|---|---|
| Quadrant | DetID | PixID | Counts | Sigma | Mean | Median | Sigma |
| A | 13 | 254 | 34360 | 68.88 | 2331 | 2280 | 465.7 |
| A | 3 | 137 | 24349 | 47.39 | 2331 | 2280 | 465.7 |
| A | 0 | 226 | 19233 | 36.4 | 2331 | 2280 | 465.7 |
| B | 6 | 159 | 5348884 | 12096.06 | 2299 | 2235 | 442.0 |
| B | 4 | 80 | 469850 | 1057.91 | 2299 | 2235 | 442.0 |
| B | 12 | 111 | 56015 | 121.67 | 2299 | 2235 | 442.0 |
| C | 3 | 233 | 610446 | 1180.95 | 2208 | 2218 | 515.0 |
| C | 14 | 238 | 460426 | 889.67 | 2208 | 2218 | 515.0 |
| C | 14 | 254 | 142462 | 272.3 | 2208 | 2218 | 515.0 |
| D | 8 | 195 | 1367543 | 2426.61 | 2216 | 2162 | 562.7 |
| D | 12 | 233 | 1139401 | 2021.15 | 2216 | 2162 | 562.7 |
| D | 2 | 250 | 203549 | 357.91 | 2216 | 2162 | 562.7 |
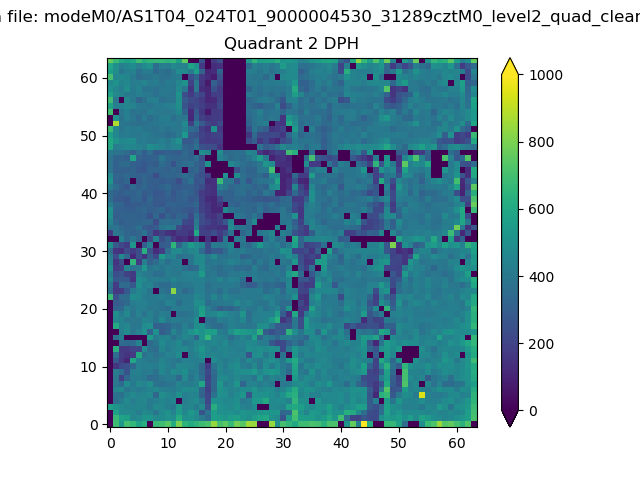
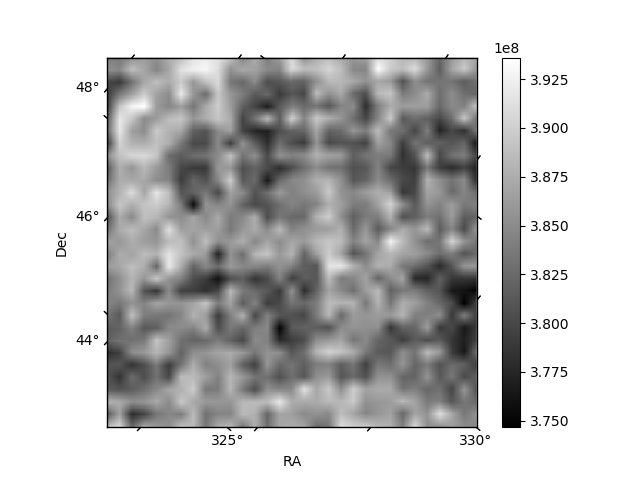
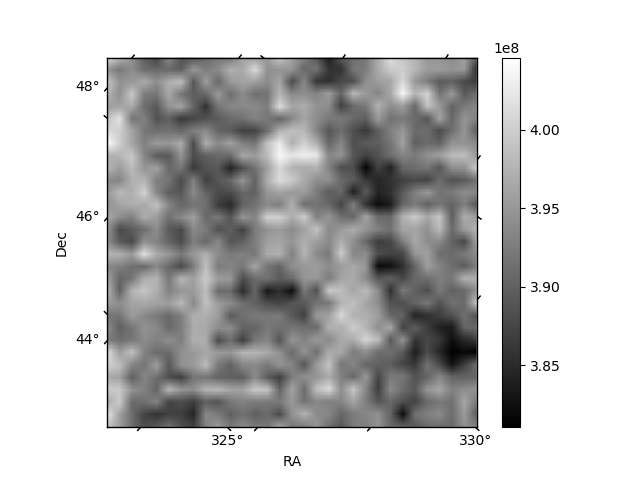
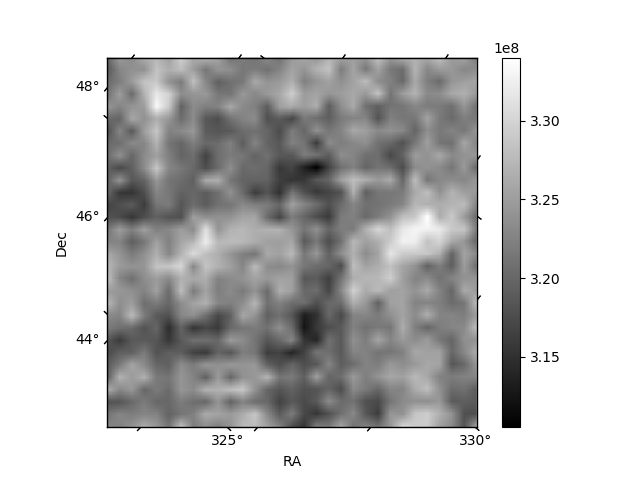
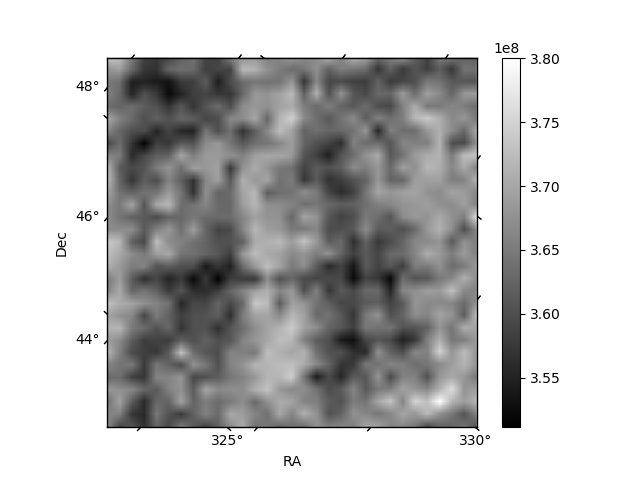
Histogram calculated using DETX and DETY for each event in the final _common_clean file
| Quadrant A | 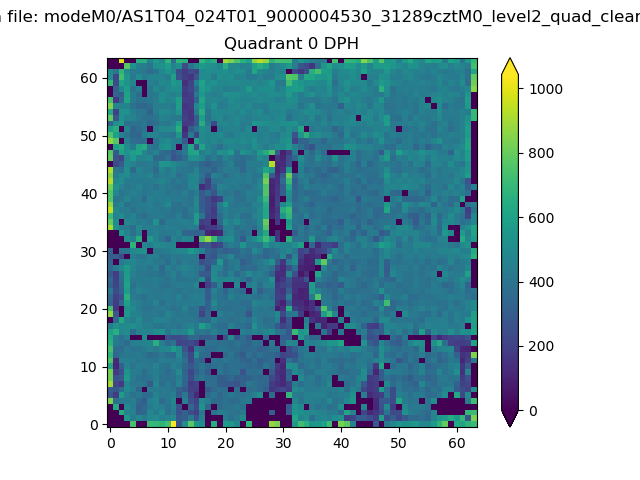 |
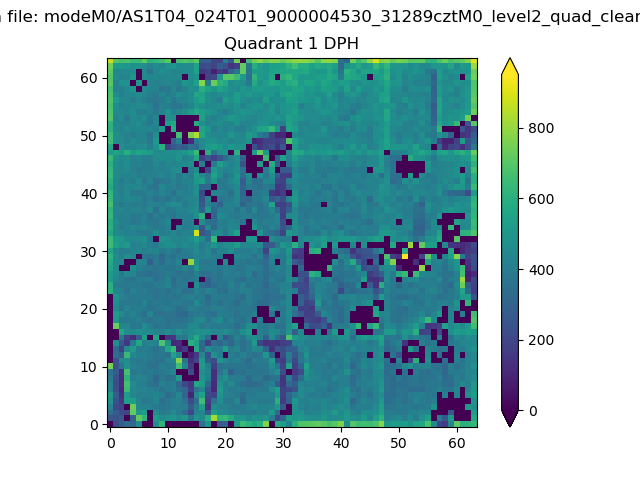 |
Quadrant B |
|---|---|---|---|
| Quadrant D | 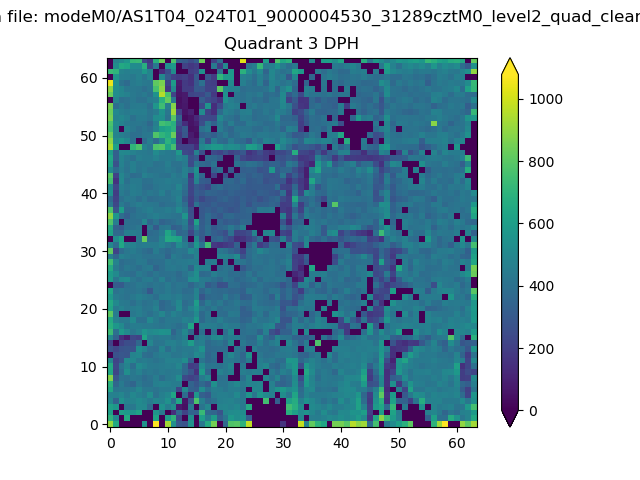 |
 |
Quadrant C |
| Plot type | Count rate plots | Images |
|---|---|---|
| Comparison with Poisson distribution Blue bars denote a histogram of data divided into 1 sec bins. Red curve is a Poisson curve with rate = median count rate of data. |
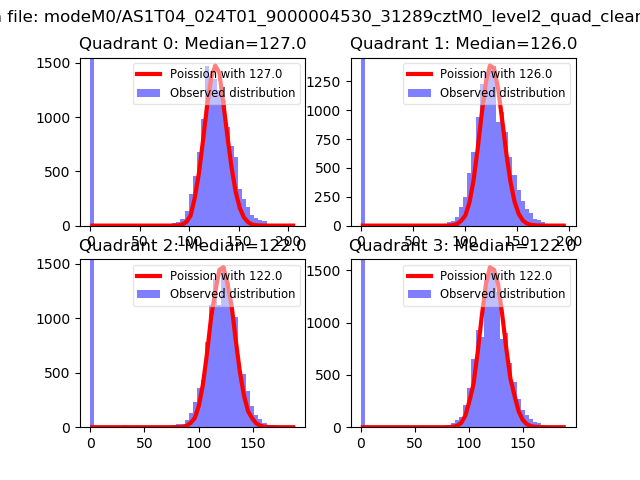 |
 |
| Quadrant-wise count rates Data is divided into 100 sec bins |
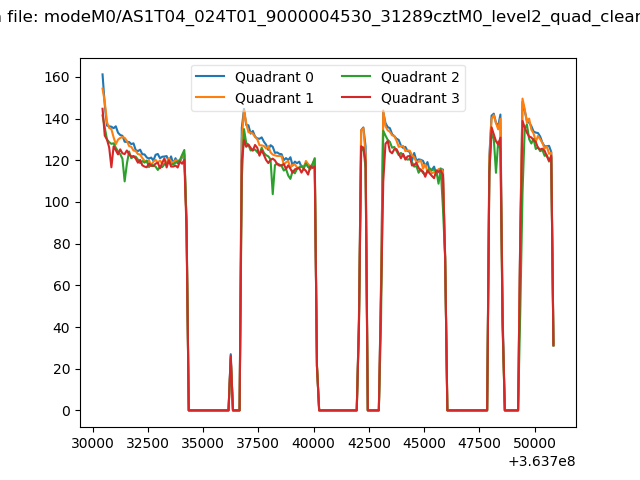 |
|
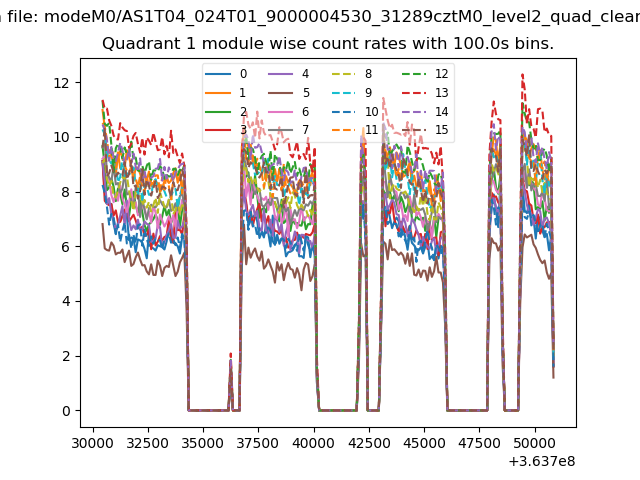
| Module-wise count rates for Quadrant A Data is divided into 100 sec bins |
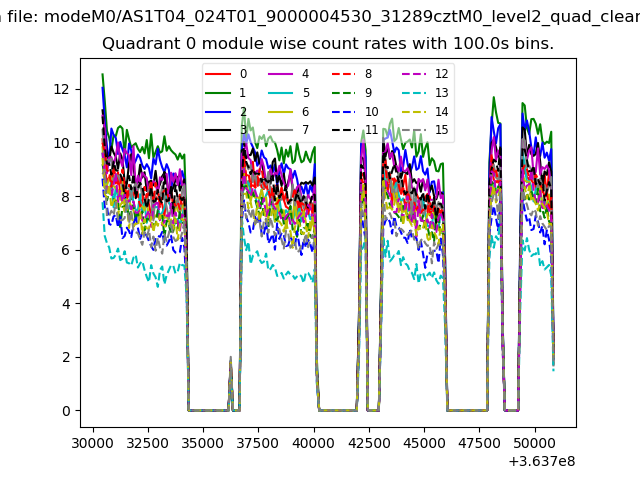 |
 |
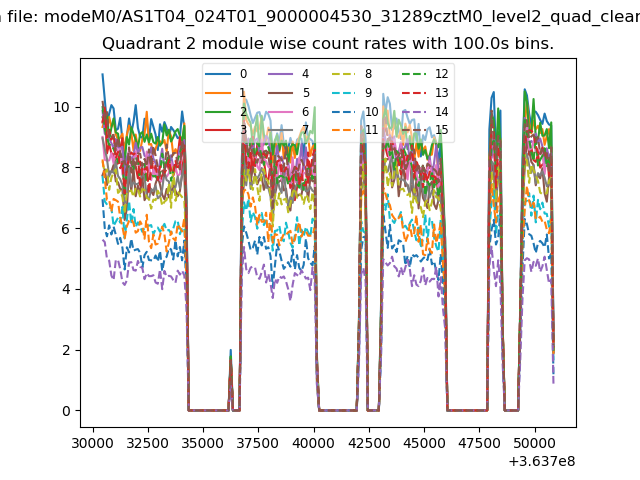
| Module-wise count rates for Quadrant B Data is divided into 100 sec bins |
 |
 |
| Module-wise count rates for Quadrant C Data is divided into 100 sec bins |
 |
 |
| Module-wise count rates for Quadrant D Data is divided into 100 sec bins |
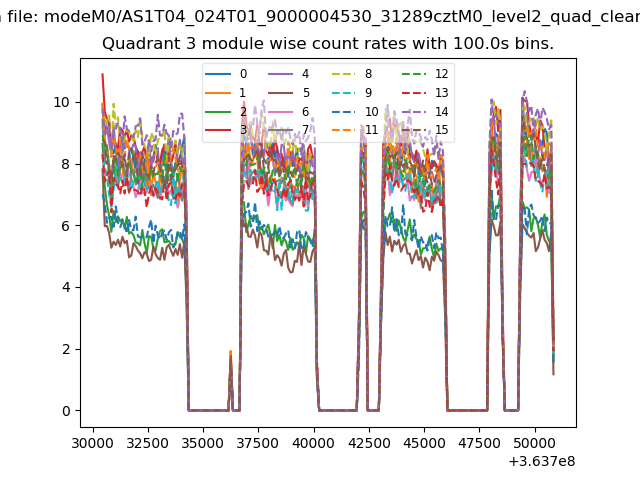 |
 |
| Parameter | Plot |
|---|---|
| CZT HV Monitor |  |
| D_VDD | 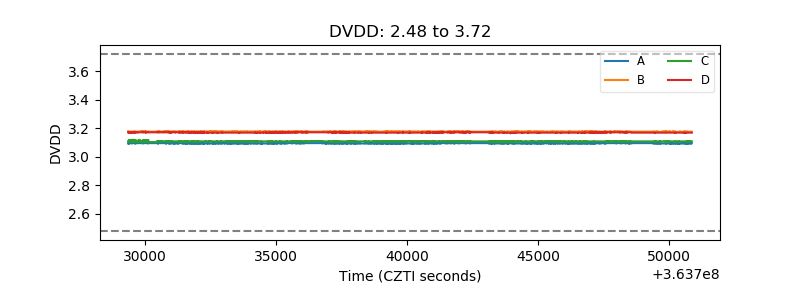 |
| Temperature 1 | 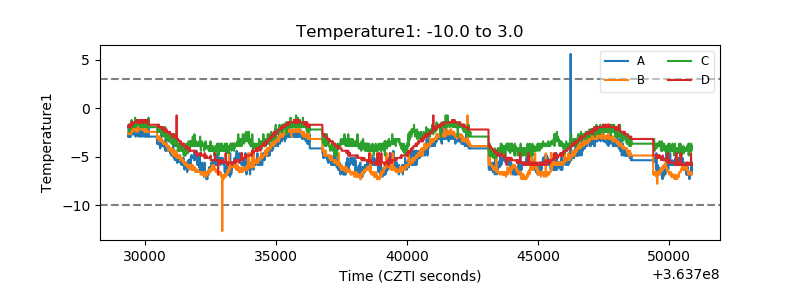 |
| Veto HV Monitor | 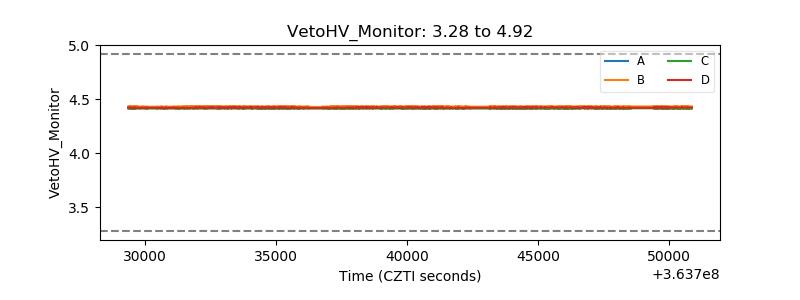 |
| Veto LLD | 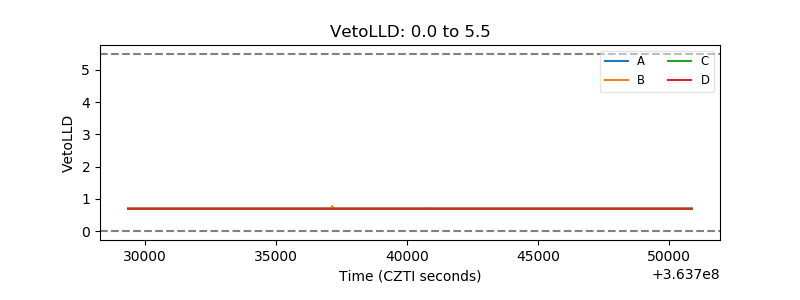 |
| Alpha Counter | 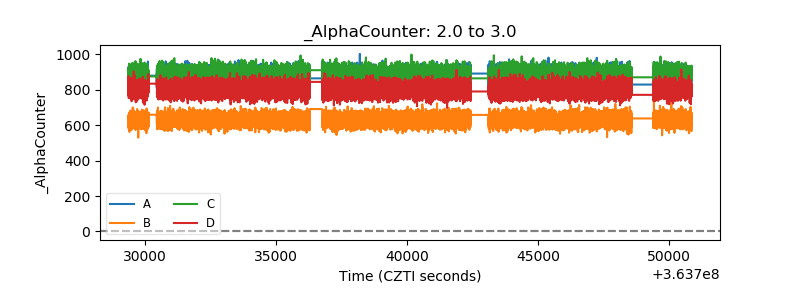 |
| _CPM_Rate | 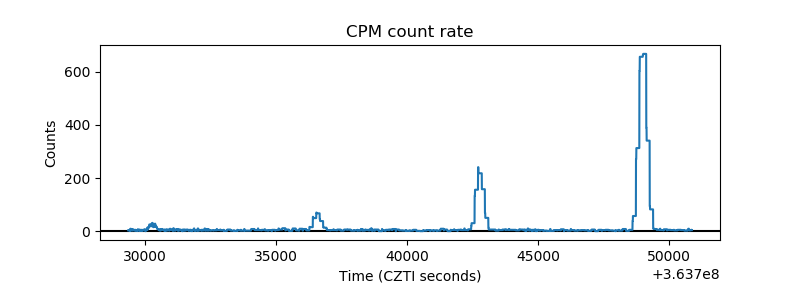 |
| CZT Counter | 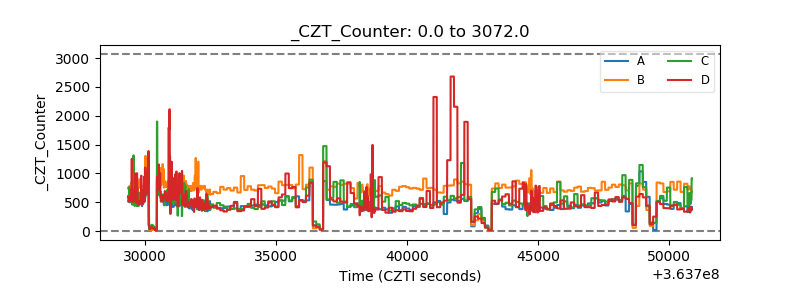 |
| +2.5 Volts monitor |  |
| +5 Volts monitor |  |
| _ROLL_ROT | 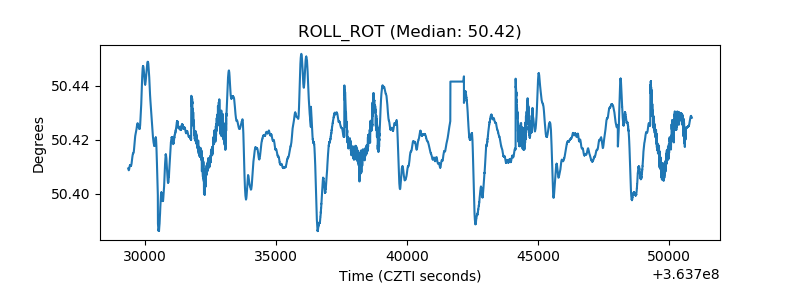 |
| _Roll_DEC | 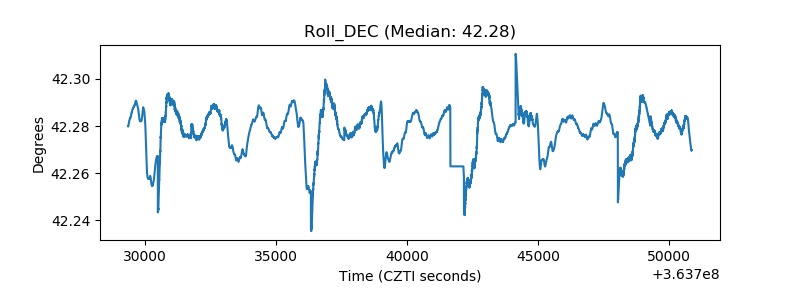 |
| _Roll_RA | 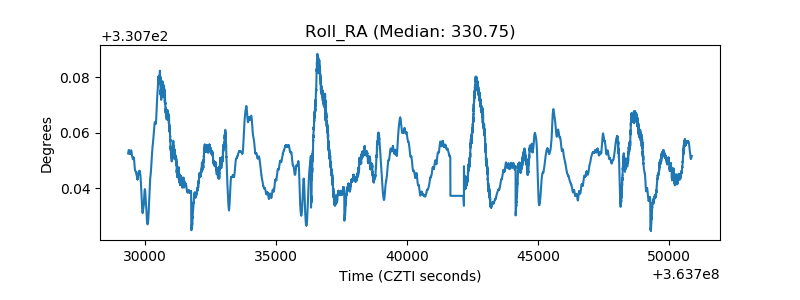 |
| Veto Counter | 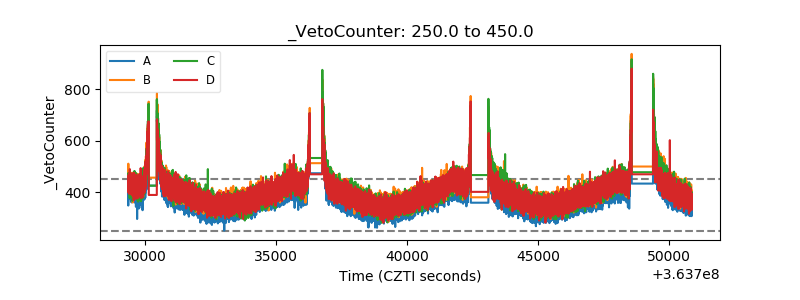 |