| Param | Original file | Final file |
|---|---|---|
| Filename | modeM0/AS1T04_024T01_9000004530_31290cztM0_level2.evt | modeM0/AS1T04_024T01_9000004530_31290cztM0_level2_quad_clean.evt |
| Size (bytes) | 516,021,120 | 95,866,560 |
| Size | 492.1 MB | 91.4 MB |
| Events in quadrant A | 3,071,798 | 627,289 |
| Events in quadrant B | 5,091,198 | 626,972 |
| Events in quadrant C | 3,736,112 | 585,876 |
| Events in quadrant D | 3,280,011 | 601,773 |
| Mode M0 | |||
|---|---|---|---|
| Quadrant | BADHDUFLAG | Total packets | Discarded packets |
| A | 0 | 13437 | 1 |
| B | 0 | 20292 | 1 |
| C | 0 | 15388 | 1 |
| D | 0 | 14452 | 1 |
| Mode SS | |||
|---|---|---|---|
| Quadrant | BADHDUFLAG | Total packets | Discarded packets |
| A | 0 | 134 | 0 |
| B | 0 | 134 | 0 |
| C | 0 | 134 | 0 |
| D | 0 | 134 | 0 |
| Mode M9 | |||
|---|---|---|---|
| Quadrant | BADHDUFLAG | Total packets | Discarded packets |
| A | 0 | 10 | 0 |
| B | 0 | 10 | 0 |
| C | 0 | 10 | 0 |
| D | 0 | 10 | 0 |
| Quadrant | Total seconds | Saturated seconds | Saturation percentage |
|---|---|---|---|
| A | 6615 | 24 | 0.362812% |
| B | 6616 | 98 | 1.481258% |
| C | 6616 | 314 | 4.746070% |
| D | 6616 | 27 | 0.408102% |
Noise dominated data is calculated using 1-second bins in cleaned event files. If a bin has >2000 counts, and if more than 50% of those come from <1% of pixels, then it is considered to be noise-dominated and hence unusable.
| Quadrant | # 1 sec bins | Bins with >0 counts | Bins with >2000 counts | High rate bins dominated by noise | Noise dominated (total time) | Noise dominated (detector-on time) | Marked lightcurve |
|---|---|---|---|---|---|---|---|
| A | 7625 | 6616 | 0 | 0 | 0.00% | 0.00% | 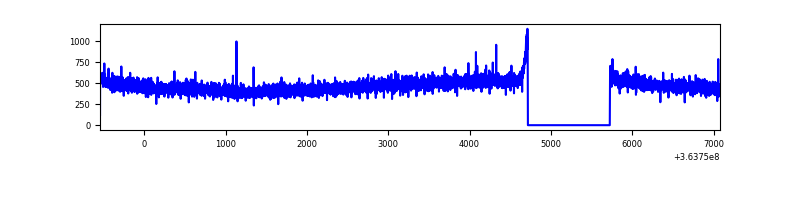 |
| B | 7626 | 6617 | 12 | 12 | 0.16% | 0.18% | 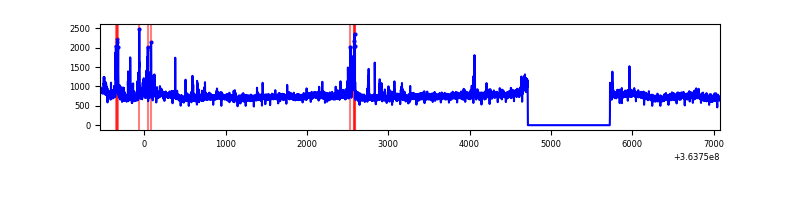 |
| C | 7626 | 6617 | 11 | 11 | 0.14% | 0.17% | 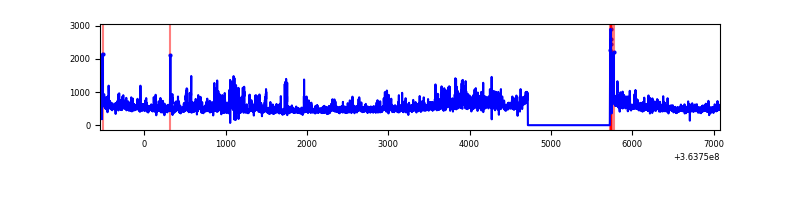 |
| D | 7626 | 6617 | 11 | 11 | 0.14% | 0.17% | 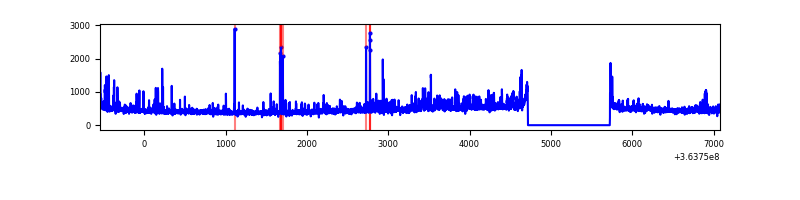 |
Top three noisy pixels from each quadrant. If the there are fewer than three noisy pixels in the level2.evt file, extra rows are filled as -1
| Pixel properties | Quadrant properties | ||||||
|---|---|---|---|---|---|---|---|
| Quadrant | DetID | PixID | Counts | Sigma | Mean | Median | Sigma |
| A | 13 | 254 | 12759 | 75.08 | 795 | 780 | 159.5 |
| A | 3 | 137 | 8090 | 45.82 | 795 | 780 | 159.5 |
| A | 0 | 226 | 6667 | 36.9 | 795 | 780 | 159.5 |
| B | 6 | 159 | 1778476 | 11765.26 | 787 | 765 | 151.1 |
| B | 4 | 80 | 199764 | 1317.01 | 787 | 765 | 151.1 |
| B | 12 | 111 | 18846 | 119.66 | 787 | 765 | 151.1 |
| C | 3 | 233 | 395852 | 2266.56 | 747 | 753 | 174.3 |
| C | 14 | 238 | 201090 | 1149.27 | 747 | 753 | 174.3 |
| C | 14 | 254 | 109334 | 622.89 | 747 | 753 | 174.3 |
| D | 8 | 195 | 337059 | 1802.29 | 762 | 743 | 186.6 |
| D | 12 | 233 | 25458 | 132.45 | 762 | 743 | 186.6 |
| D | 2 | 234 | 23697 | 123.01 | 762 | 743 | 186.6 |
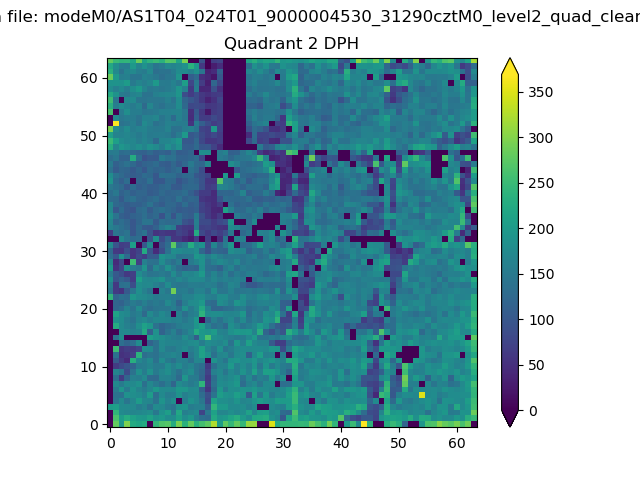
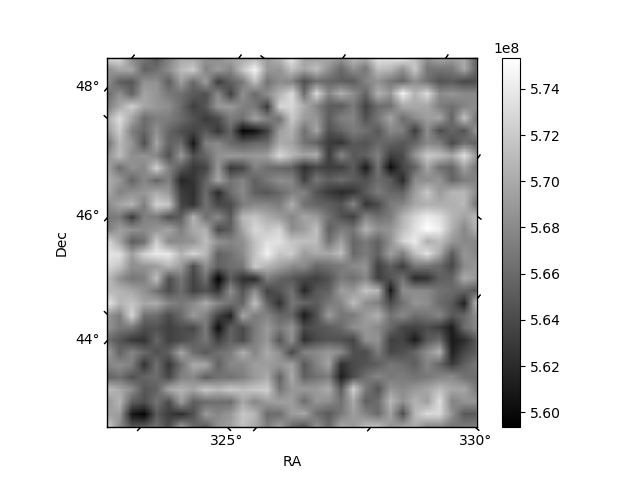
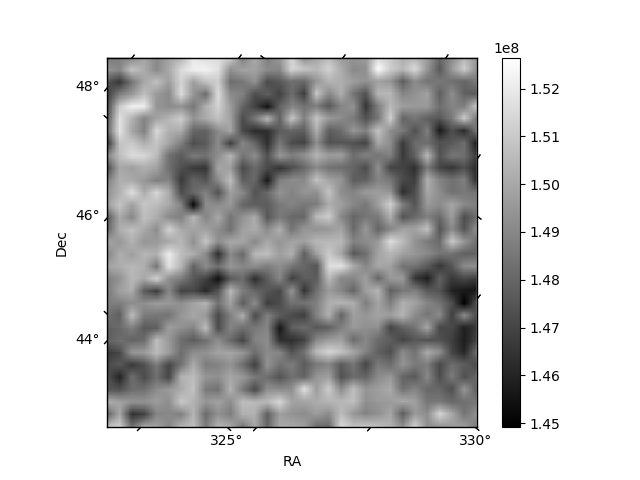
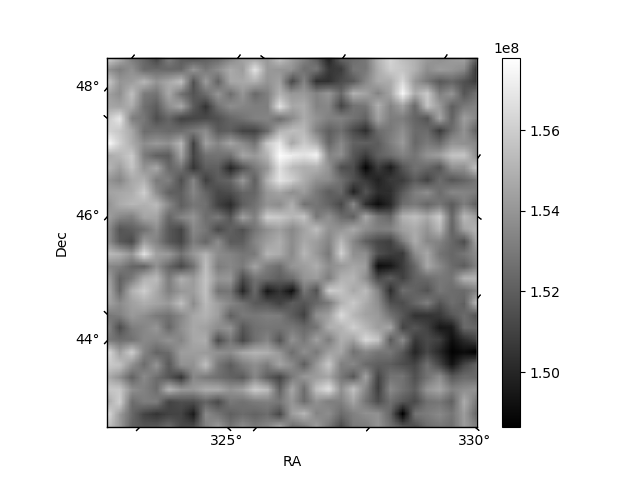
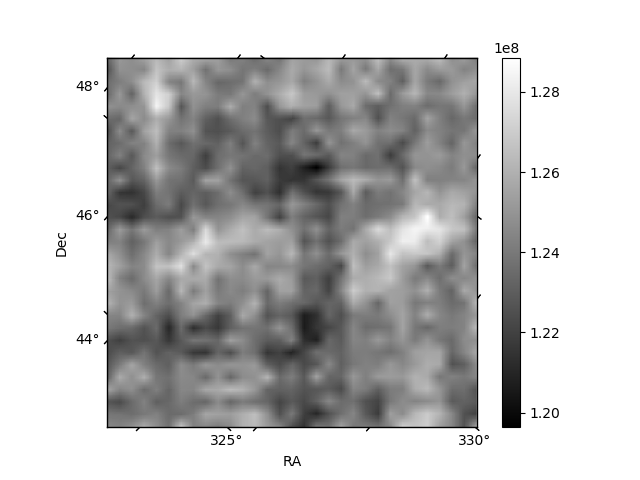
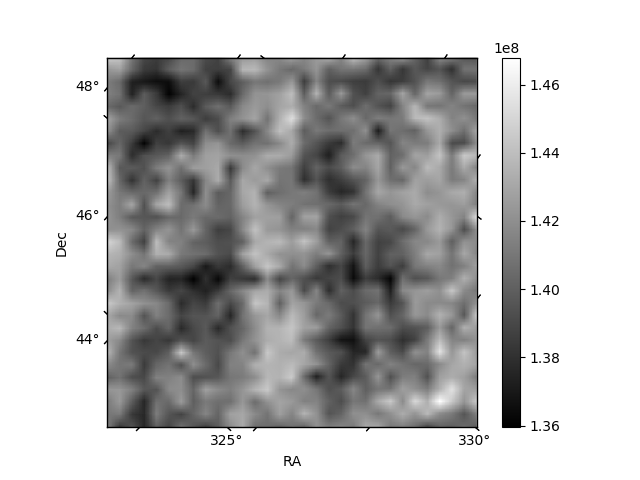
Histogram calculated using DETX and DETY for each event in the final _common_clean file
| Quadrant A | 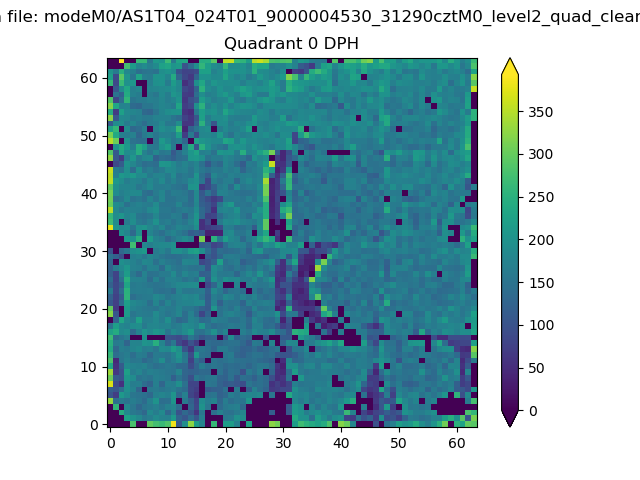 |
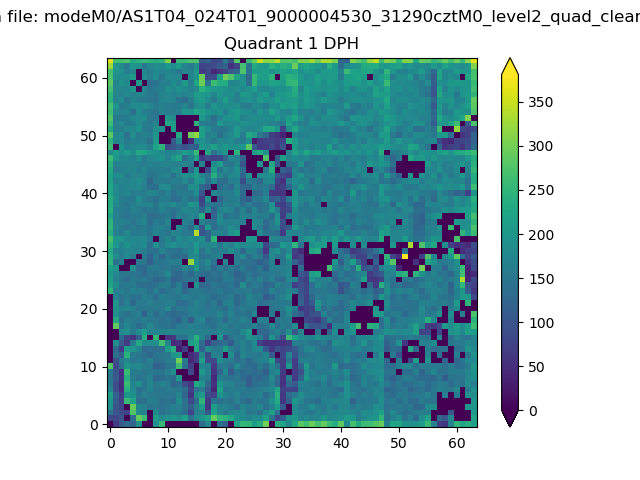 |
Quadrant B |
|---|---|---|---|
| Quadrant D | 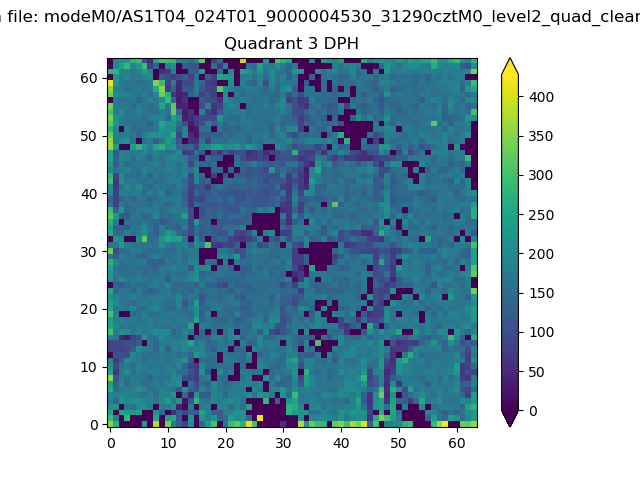 |
 |
Quadrant C |
| Plot type | Count rate plots | Images |
|---|---|---|
| Comparison with Poisson distribution Blue bars denote a histogram of data divided into 1 sec bins. Red curve is a Poisson curve with rate = median count rate of data. |
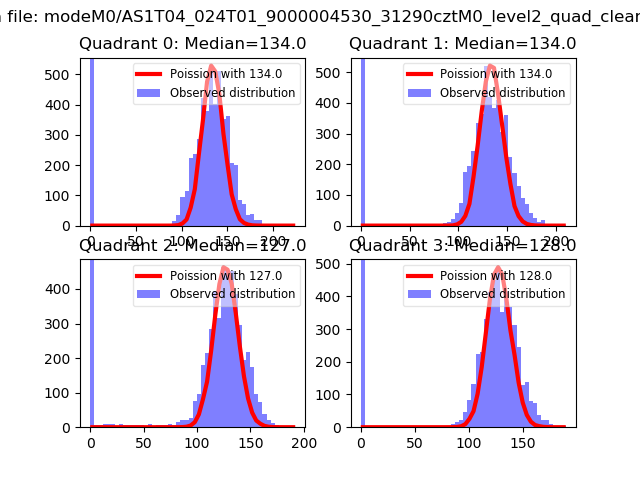 |
 |
| Quadrant-wise count rates Data is divided into 100 sec bins |
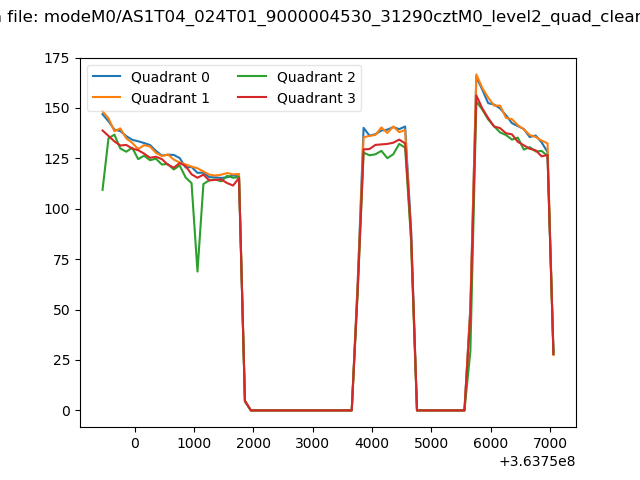 |
|
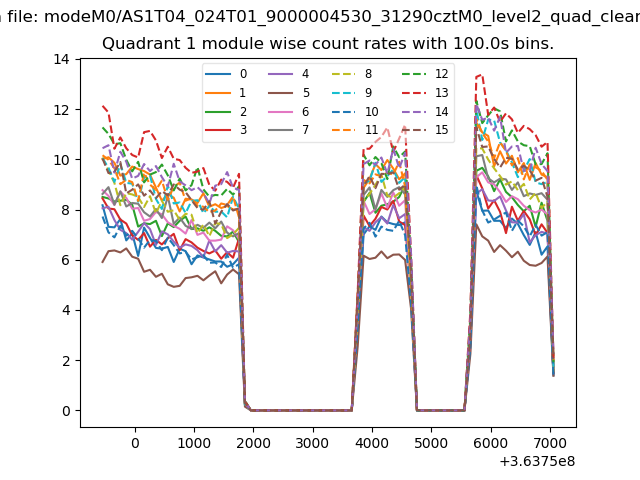
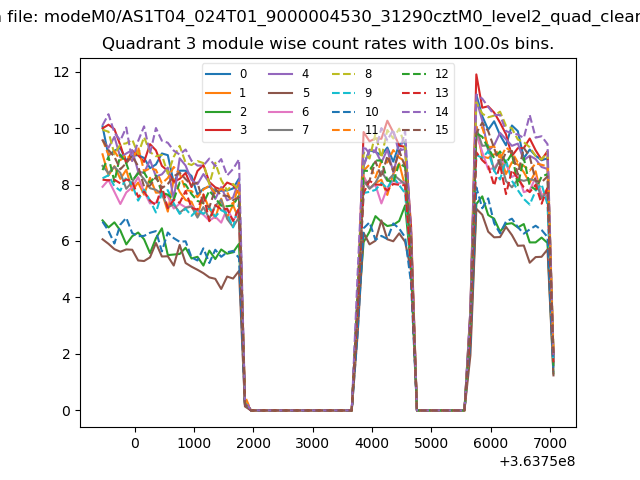
| Module-wise count rates for Quadrant A Data is divided into 100 sec bins |
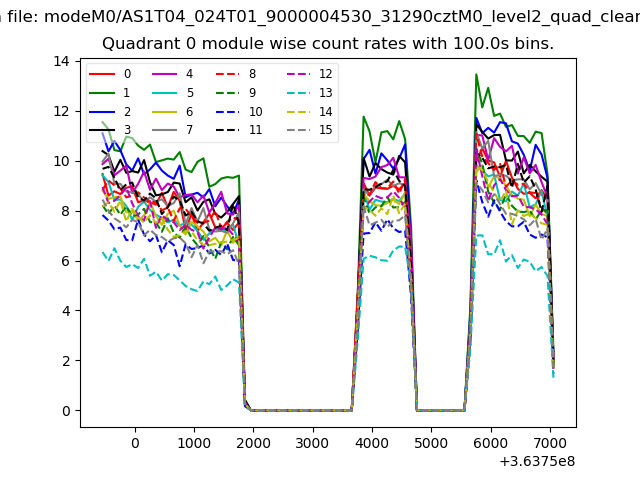 |
 |
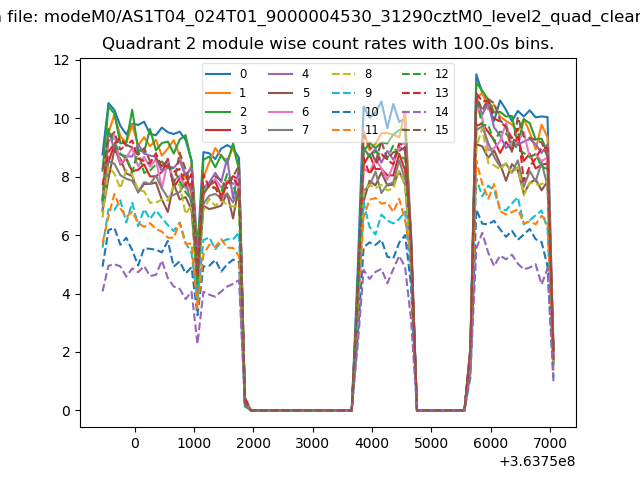
| Module-wise count rates for Quadrant B Data is divided into 100 sec bins |
 |
 |
| Module-wise count rates for Quadrant C Data is divided into 100 sec bins |
 |
 |
| Module-wise count rates for Quadrant D Data is divided into 100 sec bins |
 |
 |
| Parameter | Plot |
|---|---|
| CZT HV Monitor | 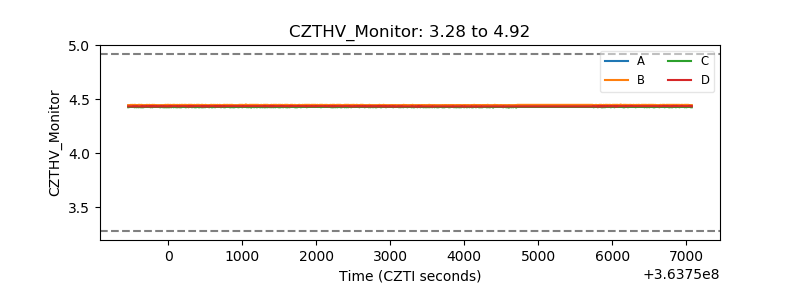 |
| D_VDD | 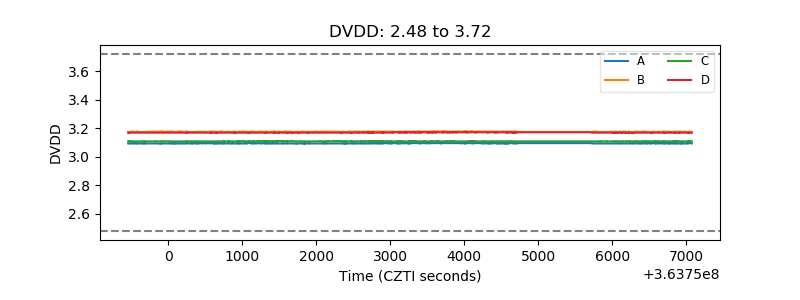 |
| Temperature 1 | 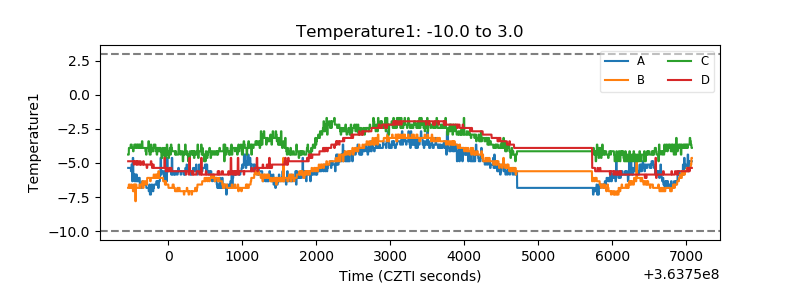 |
| Veto HV Monitor | 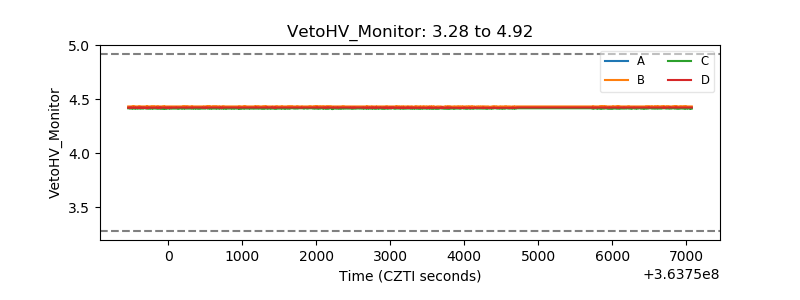 |
| Veto LLD | 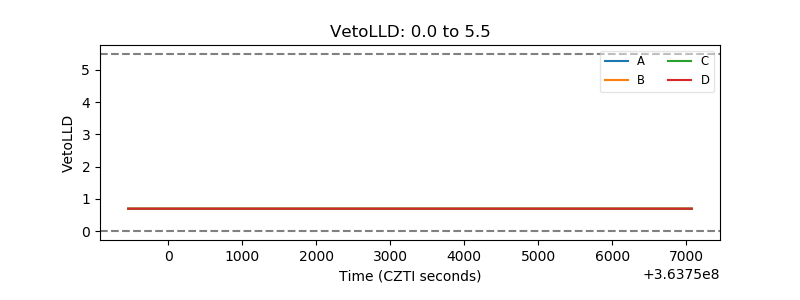 |
| Alpha Counter | 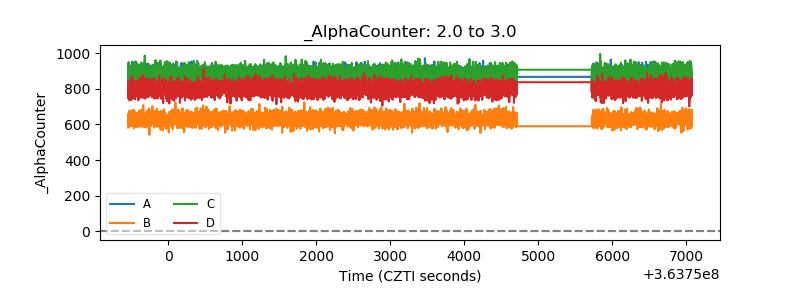 |
| _CPM_Rate | 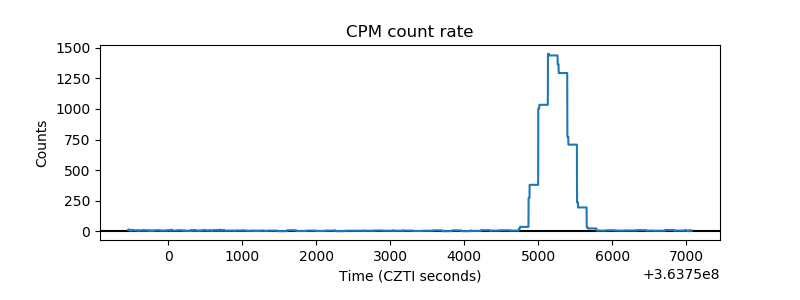 |
| CZT Counter | 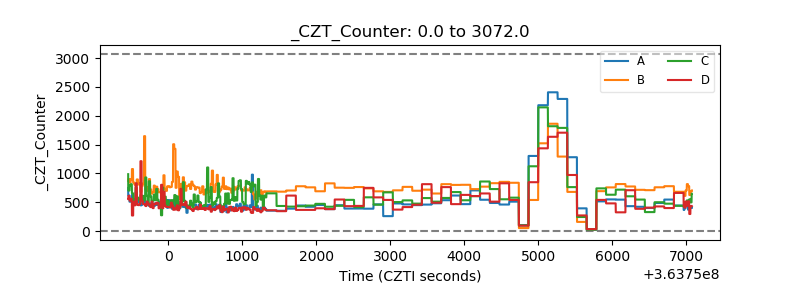 |
| +2.5 Volts monitor |  |
| +5 Volts monitor |  |
| _ROLL_ROT | 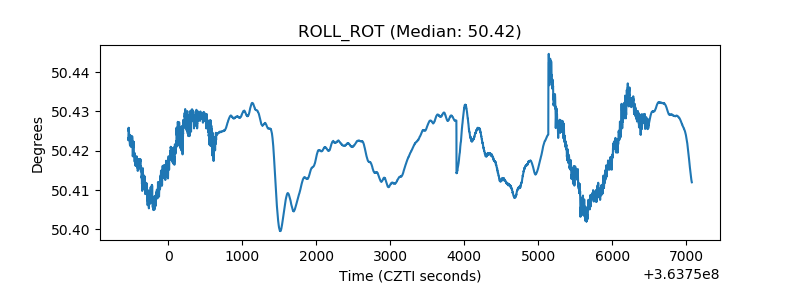 |
| _Roll_DEC | 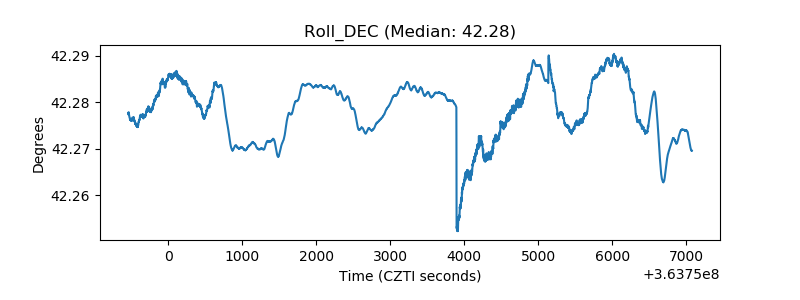 |
| _Roll_RA | 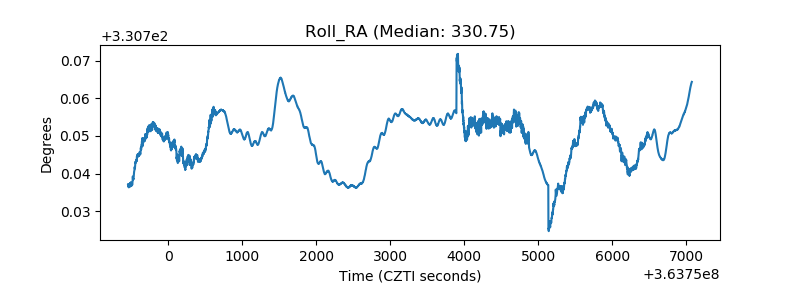 |
| Veto Counter | 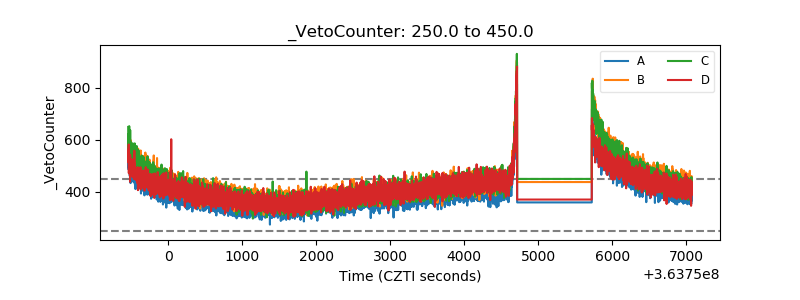 |