| Param | Original file | Final file |
|---|---|---|
| Filename | modeM0/AS1T04_024T01_9000004530_31292cztM0_level2.evt | modeM0/AS1T04_024T01_9000004530_31292cztM0_level2_quad_clean.evt |
| Size (bytes) | 518,676,480 | 100,080,000 |
| Size | 494.6 MB | 95.4 MB |
| Events in quadrant A | 3,154,451 | 667,326 |
| Events in quadrant B | 5,085,919 | 663,149 |
| Events in quadrant C | 3,573,752 | 618,399 |
| Events in quadrant D | 3,453,538 | 628,836 |
| Mode M0 | |||
|---|---|---|---|
| Quadrant | BADHDUFLAG | Total packets | Discarded packets |
| A | 0 | 13380 | 2 |
| B | 0 | 20122 | 2 |
| C | 0 | 14688 | 2 |
| D | 0 | 14529 | 2 |
| Mode SS | |||
|---|---|---|---|
| Quadrant | BADHDUFLAG | Total packets | Discarded packets |
| A | 0 | 132 | 0 |
| B | 0 | 132 | 0 |
| C | 0 | 132 | 0 |
| D | 0 | 132 | 0 |
| Mode M9 | |||
|---|---|---|---|
| Quadrant | BADHDUFLAG | Total packets | Discarded packets |
| A | 0 | 13 | 0 |
| B | 0 | 14 | 0 |
| C | 0 | 14 | 0 |
| D | 0 | 14 | 0 |
| Quadrant | Total seconds | Saturated seconds | Saturation percentage |
|---|---|---|---|
| A | 6496 | 42 | 0.646552% |
| B | 6496 | 172 | 2.647783% |
| C | 6496 | 277 | 4.264163% |
| D | 6496 | 95 | 1.462438% |
Noise dominated data is calculated using 1-second bins in cleaned event files. If a bin has >2000 counts, and if more than 50% of those come from <1% of pixels, then it is considered to be noise-dominated and hence unusable.
| Quadrant | # 1 sec bins | Bins with >0 counts | Bins with >2000 counts | High rate bins dominated by noise | Noise dominated (total time) | Noise dominated (detector-on time) | Marked lightcurve |
|---|---|---|---|---|---|---|---|
| A | 7606 | 6497 | 0 | 0 | 0.00% | 0.00% | 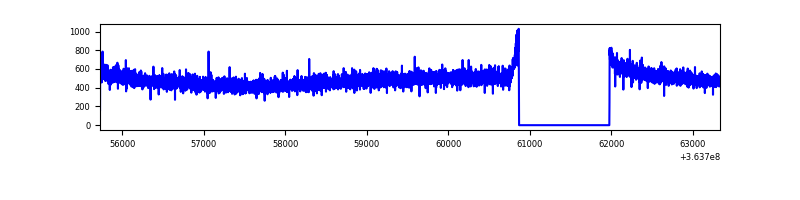 |
| B | 7606 | 6497 | 39 | 39 | 0.51% | 0.60% | 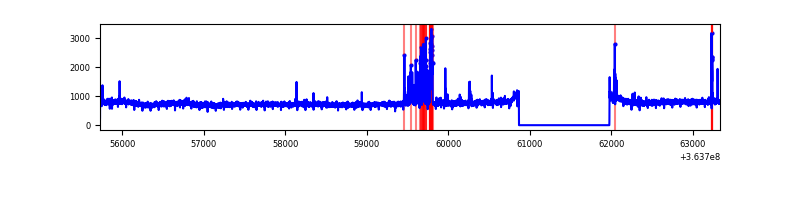 |
| C | 7606 | 6497 | 35 | 35 | 0.46% | 0.54% | 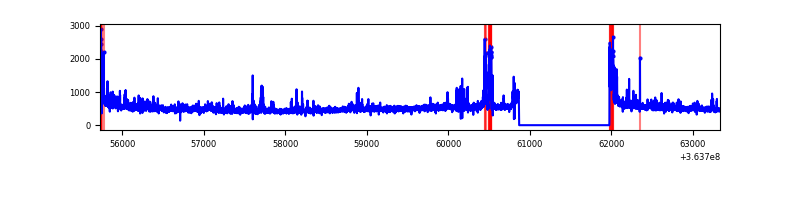 |
| D | 7606 | 6497 | 46 | 46 | 0.60% | 0.71% | 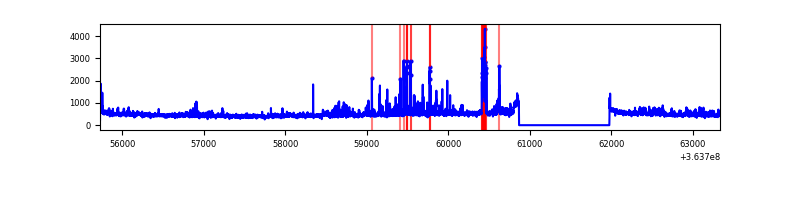 |
Top three noisy pixels from each quadrant. If the there are fewer than three noisy pixels in the level2.evt file, extra rows are filled as -1
| Pixel properties | Quadrant properties | ||||||
|---|---|---|---|---|---|---|---|
| Quadrant | DetID | PixID | Counts | Sigma | Mean | Median | Sigma |
| A | 13 | 254 | 12531 | 72.18 | 817 | 804 | 162.5 |
| A | 3 | 137 | 7879 | 43.55 | 817 | 804 | 162.5 |
| A | 0 | 226 | 6760 | 36.66 | 817 | 804 | 162.5 |
| B | 6 | 159 | 1711479 | 11206.02 | 801 | 780 | 152.7 |
| B | 4 | 80 | 223813 | 1460.99 | 801 | 780 | 152.7 |
| B | 12 | 111 | 18706 | 117.43 | 801 | 780 | 152.7 |
| C | 14 | 238 | 160554 | 909.59 | 761 | 766 | 175.7 |
| C | 0 | 10 | 160037 | 906.65 | 761 | 766 | 175.7 |
| C | 3 | 233 | 140900 | 797.71 | 761 | 766 | 175.7 |
| D | 8 | 195 | 324412 | 1704.4 | 773 | 754 | 189.9 |
| D | 12 | 233 | 120273 | 629.39 | 773 | 754 | 189.9 |
| D | 12 | 218 | 42240 | 218.47 | 773 | 754 | 189.9 |
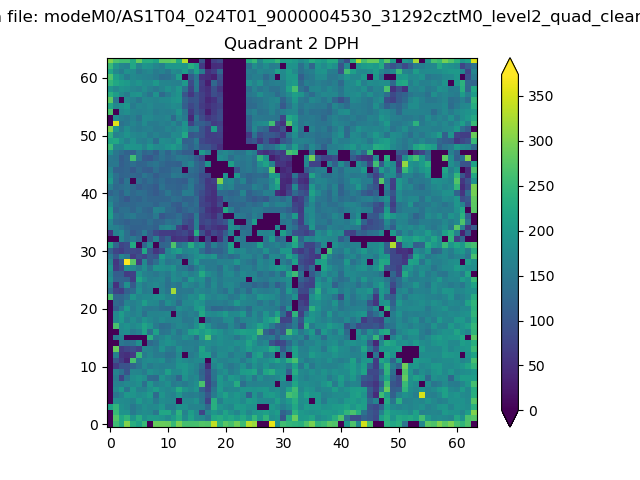
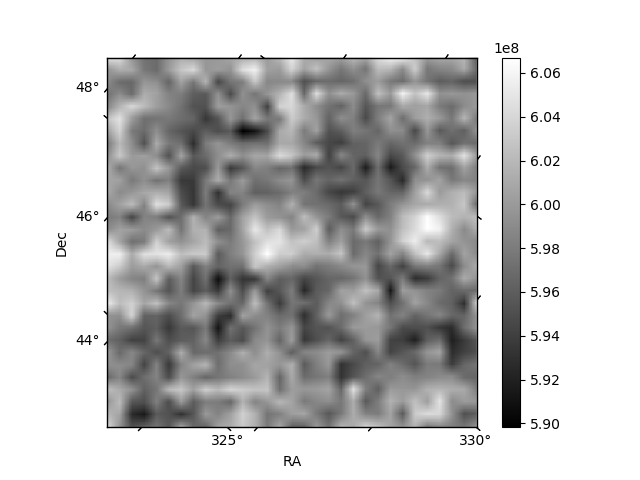
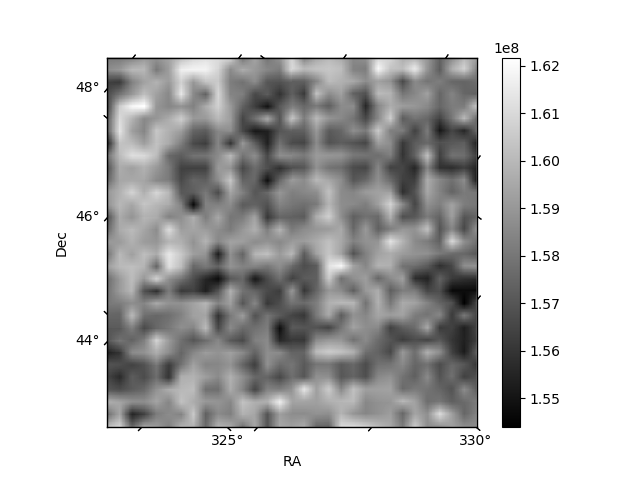
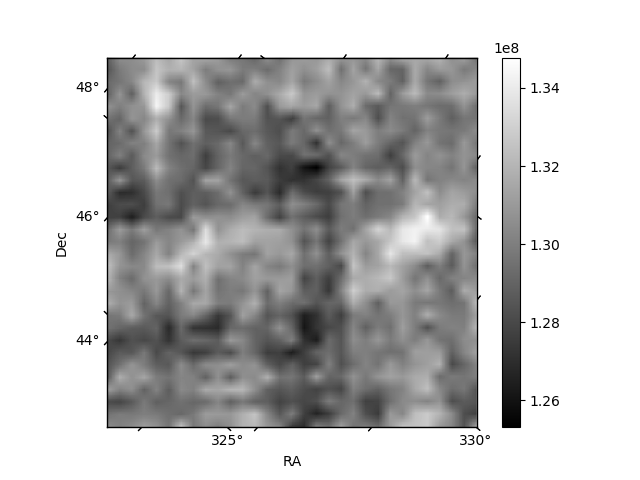
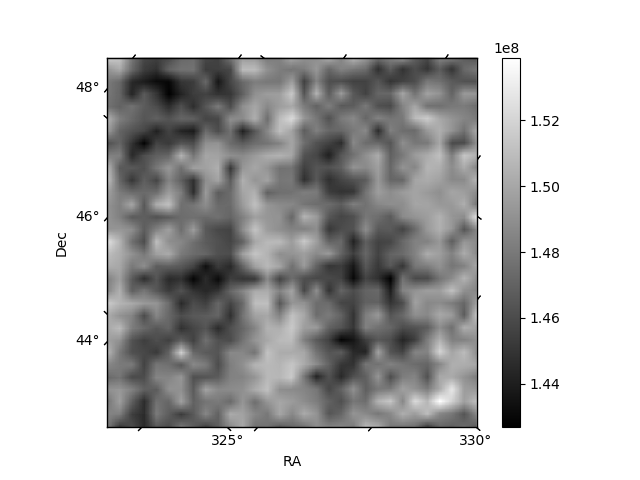
Histogram calculated using DETX and DETY for each event in the final _common_clean file
| Quadrant A | 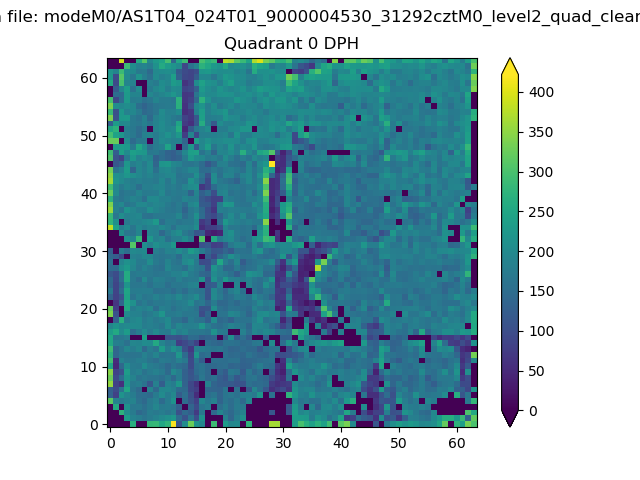 |
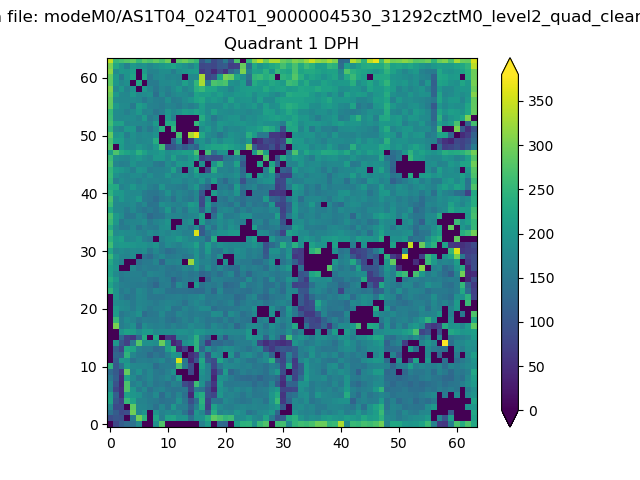 |
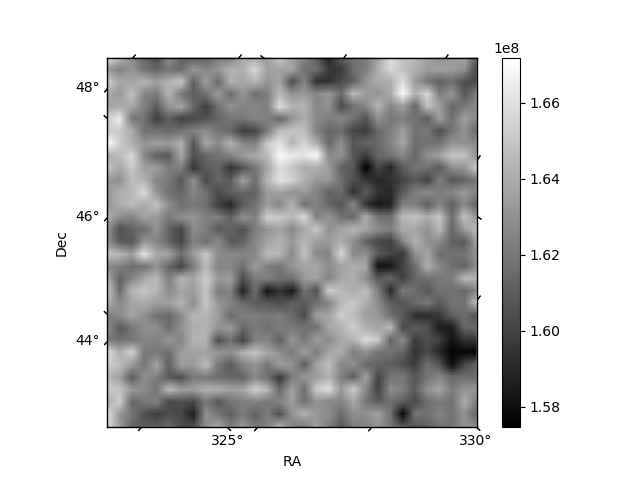
Quadrant B |
|---|---|---|---|
| Quadrant D | 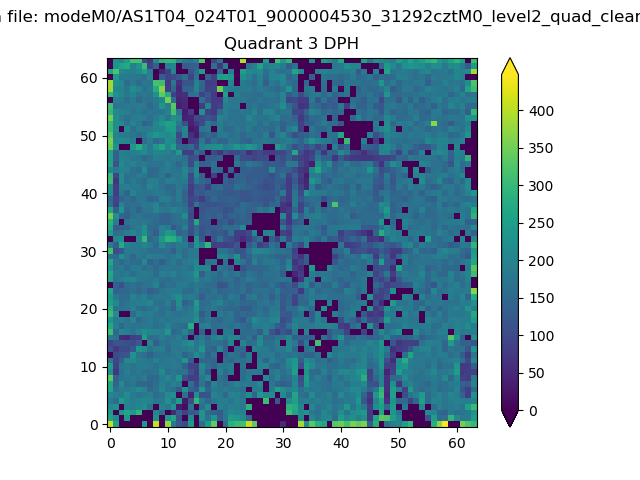 |
 |
Quadrant C |
| Plot type | Count rate plots | Images |
|---|---|---|
| Comparison with Poisson distribution Blue bars denote a histogram of data divided into 1 sec bins. Red curve is a Poisson curve with rate = median count rate of data. |
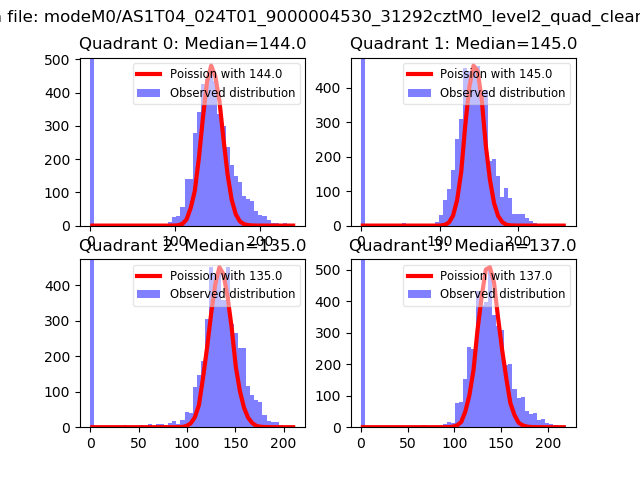 |
 |
| Quadrant-wise count rates Data is divided into 100 sec bins |
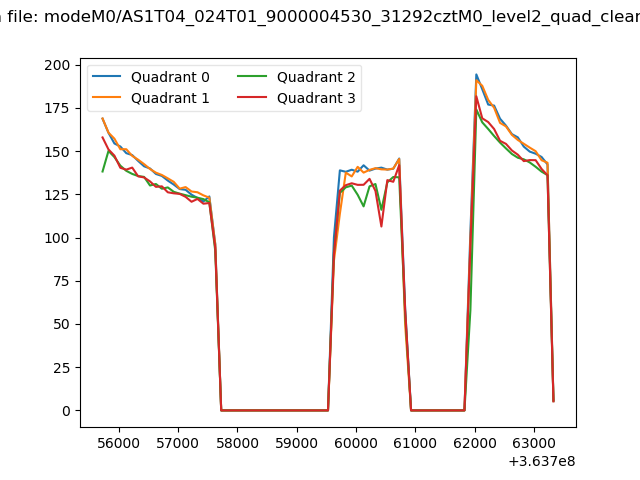 |
|
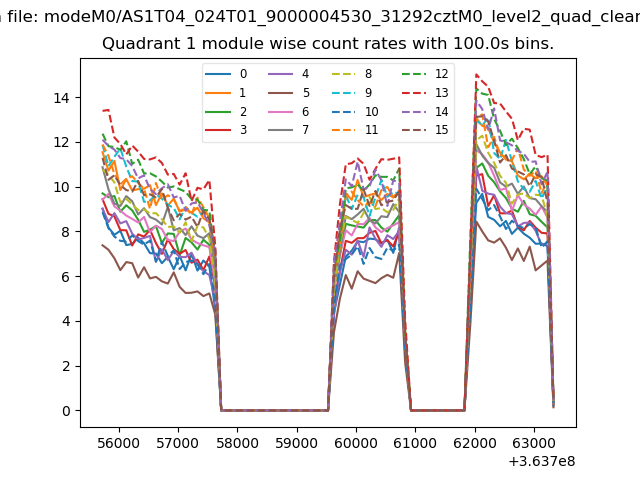
| Module-wise count rates for Quadrant A Data is divided into 100 sec bins |
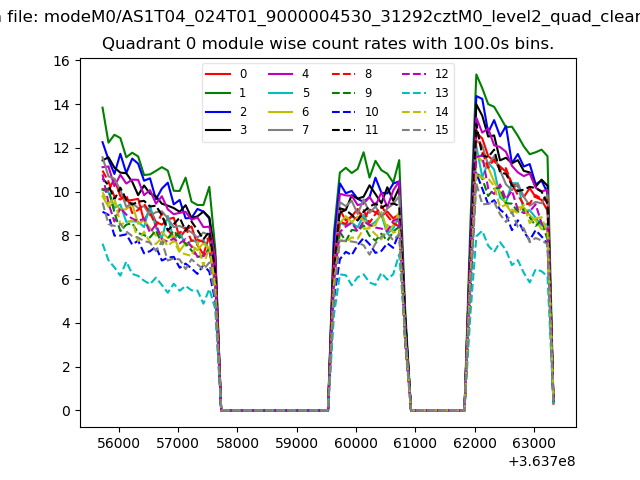 |
 |
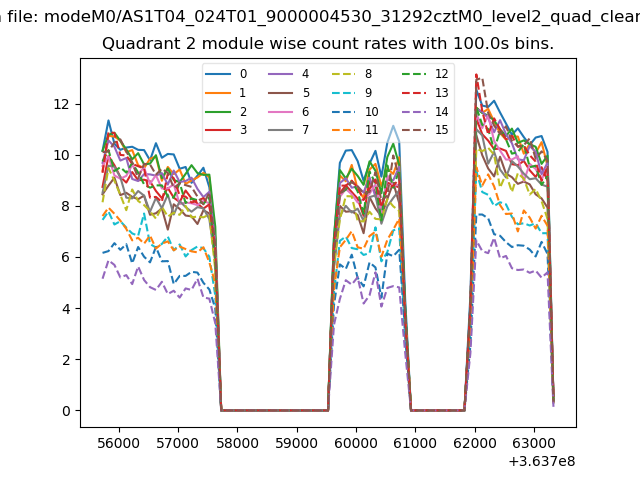
| Module-wise count rates for Quadrant B Data is divided into 100 sec bins |
 |
 |
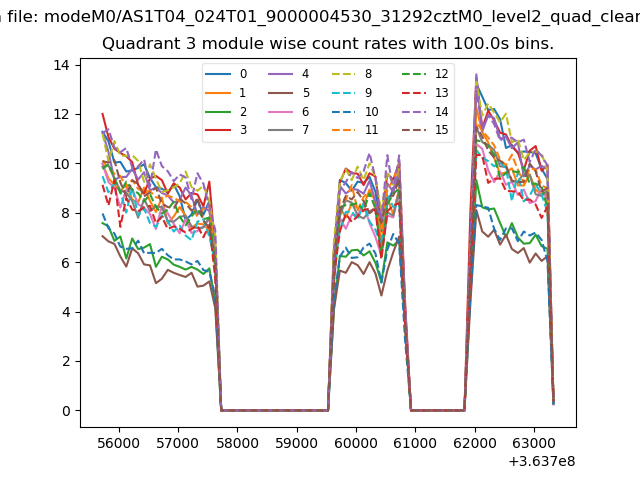
| Module-wise count rates for Quadrant C Data is divided into 100 sec bins |
 |
 |
| Module-wise count rates for Quadrant D Data is divided into 100 sec bins |
 |
 |
| Parameter | Plot |
|---|---|
| CZT HV Monitor | 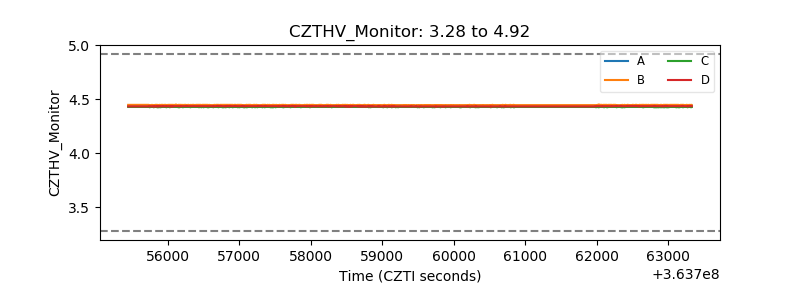 |
| D_VDD | 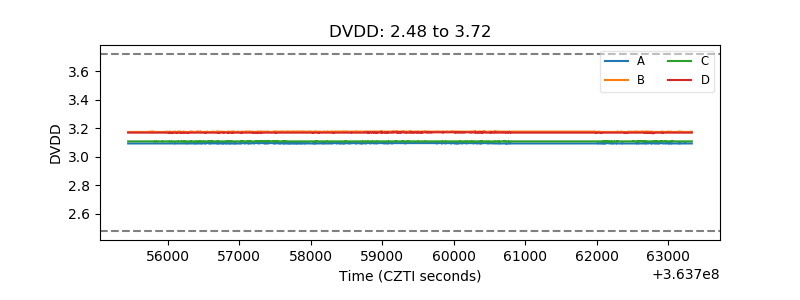 |
| Temperature 1 | 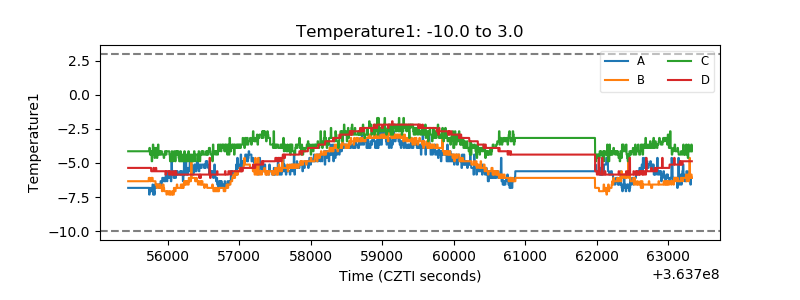 |
| Veto HV Monitor | 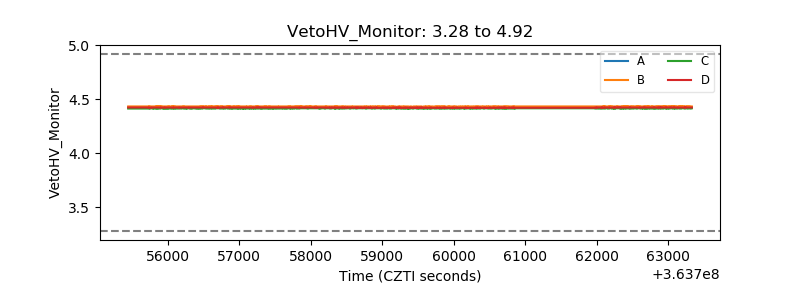 |
| Veto LLD | 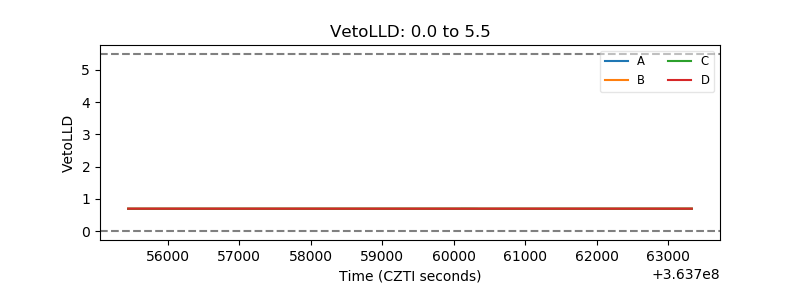 |
| Alpha Counter | 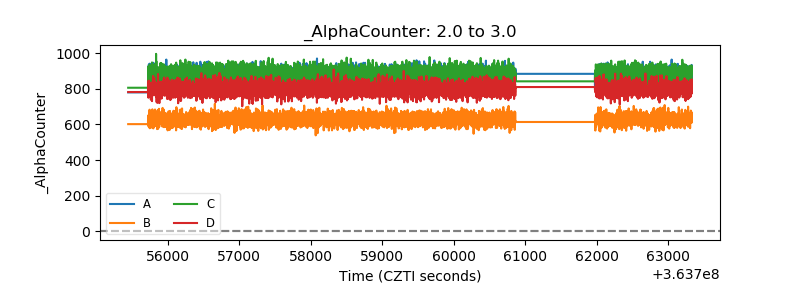 |
| _CPM_Rate | 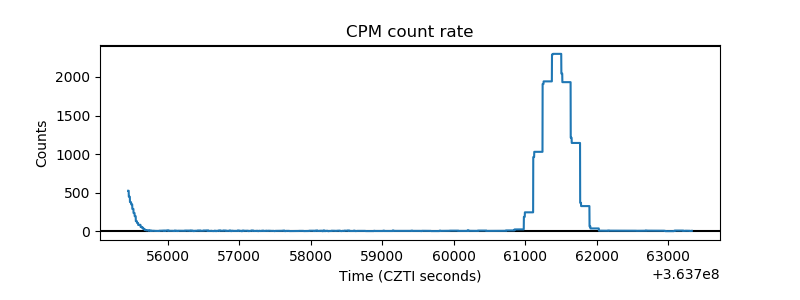 |
| CZT Counter | 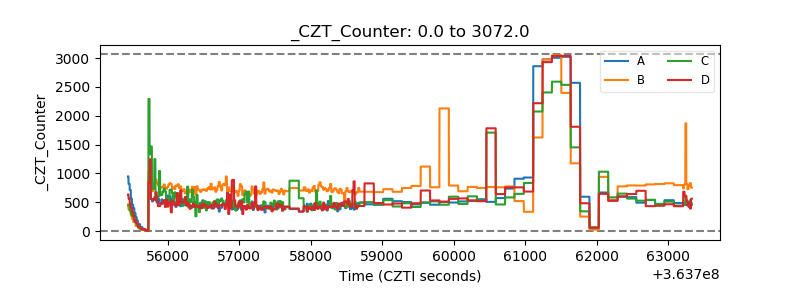 |
| +2.5 Volts monitor |  |
| +5 Volts monitor |  |
| _ROLL_ROT | 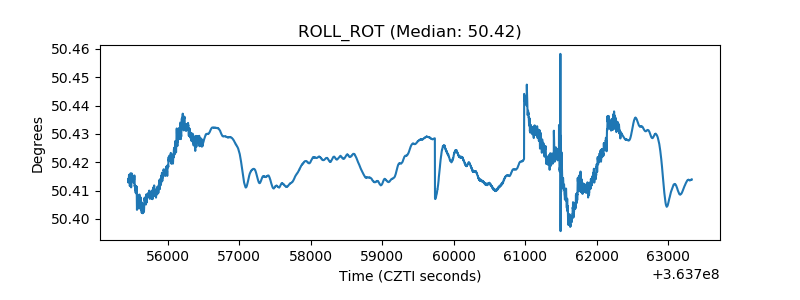 |
| _Roll_DEC | 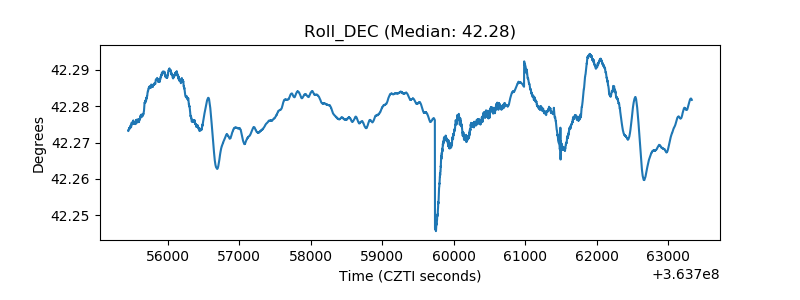 |
| _Roll_RA | 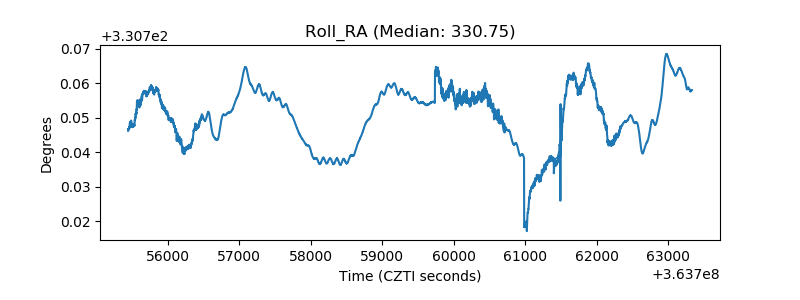 |
| Veto Counter | 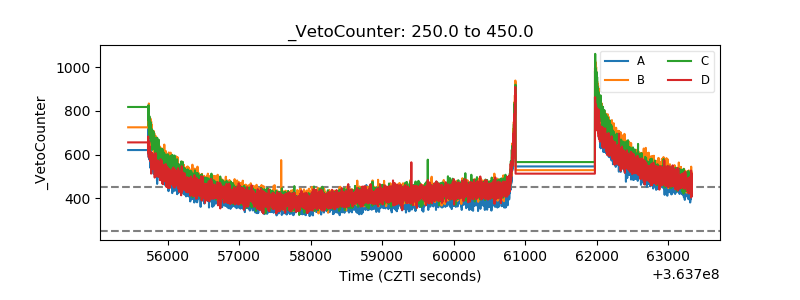 |