| Param | Original file | Final file |
|---|---|---|
| Filename | modeM0/AS1T04_024T01_9000004530_31294cztM0_level2.evt | modeM0/AS1T04_024T01_9000004530_31294cztM0_level2_quad_clean.evt |
| Size (bytes) | 958,705,920 | 153,285,120 |
| Size | 914.3 MB | 146.2 MB |
| Events in quadrant A | 5,773,545 | 1,008,501 |
| Events in quadrant B | 8,923,163 | 1,001,008 |
| Events in quadrant C | 7,271,025 | 915,257 |
| Events in quadrant D | 6,323,508 | 955,068 |
| Mode M0 | |||
|---|---|---|---|
| Quadrant | BADHDUFLAG | Total packets | Discarded packets |
| A | 0 | 23605 | 2 |
| B | 0 | 33994 | 2 |
| C | 0 | 29015 | 2 |
| D | 0 | 25765 | 2 |
| Mode SS | |||
|---|---|---|---|
| Quadrant | BADHDUFLAG | Total packets | Discarded packets |
| A | 0 | 224 | 0 |
| B | 0 | 224 | 0 |
| C | 0 | 224 | 0 |
| D | 0 | 224 | 0 |
| Mode M9 | |||
|---|---|---|---|
| Quadrant | BADHDUFLAG | Total packets | Discarded packets |
| A | 0 | 25 | 0 |
| B | 0 | 25 | 0 |
| C | 0 | 25 | 0 |
| D | 0 | 25 | 0 |
| Quadrant | Total seconds | Saturated seconds | Saturation percentage |
|---|---|---|---|
| A | 11019 | 100 | 0.907523% |
| B | 11019 | 255 | 2.314185% |
| C | 11019 | 603 | 5.472366% |
| D | 11019 | 117 | 1.061802% |
Noise dominated data is calculated using 1-second bins in cleaned event files. If a bin has >2000 counts, and if more than 50% of those come from <1% of pixels, then it is considered to be noise-dominated and hence unusable.
| Quadrant | # 1 sec bins | Bins with >0 counts | Bins with >2000 counts | High rate bins dominated by noise | Noise dominated (total time) | Noise dominated (detector-on time) | Marked lightcurve |
|---|---|---|---|---|---|---|---|
| A | 13534 | 11021 | 0 | 0 | 0.00% | 0.00% | 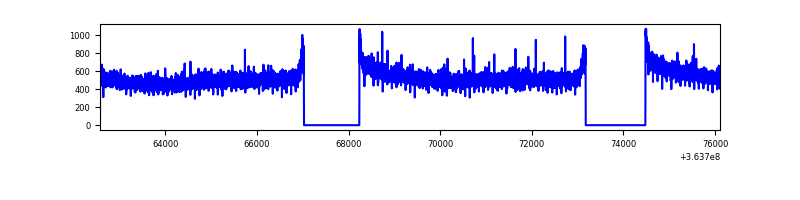 |
| B | 13534 | 11021 | 20 | 20 | 0.15% | 0.18% | 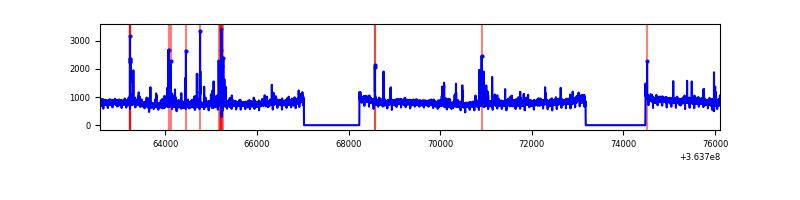 |
| C | 13534 | 11021 | 137 | 137 | 1.01% | 1.24% | 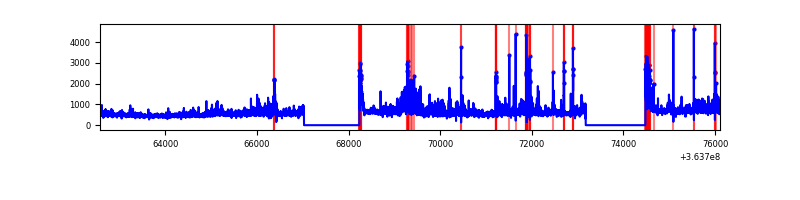 |
| D | 13534 | 11021 | 48 | 48 | 0.35% | 0.44% | 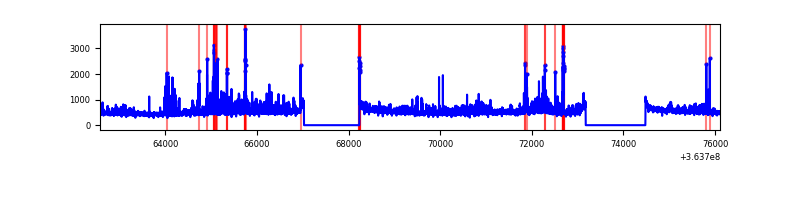 |
Top three noisy pixels from each quadrant. If the there are fewer than three noisy pixels in the level2.evt file, extra rows are filled as -1
| Pixel properties | Quadrant properties | ||||||
|---|---|---|---|---|---|---|---|
| Quadrant | DetID | PixID | Counts | Sigma | Mean | Median | Sigma |
| A | 13 | 254 | 20387 | 64.54 | 1497 | 1474 | 293.0 |
| A | 3 | 137 | 14016 | 42.8 | 1497 | 1474 | 293.0 |
| A | 0 | 226 | 12753 | 38.49 | 1497 | 1474 | 293.0 |
| B | 6 | 159 | 2927787 | 10788.46 | 1456 | 1422 | 271.2 |
| B | 4 | 80 | 248050 | 909.23 | 1456 | 1422 | 271.2 |
| B | 12 | 111 | 32439 | 114.35 | 1456 | 1422 | 271.2 |
| C | 3 | 233 | 1194060 | 3844.54 | 1364 | 1374 | 310.2 |
| C | 14 | 238 | 296485 | 951.27 | 1364 | 1374 | 310.2 |
| C | 0 | 10 | 256028 | 820.86 | 1364 | 1374 | 310.2 |
| D | 8 | 195 | 536544 | 1569.78 | 1419 | 1388 | 340.9 |
| D | 12 | 233 | 210790 | 614.24 | 1419 | 1388 | 340.9 |
| D | 2 | 250 | 170339 | 495.59 | 1419 | 1388 | 340.9 |
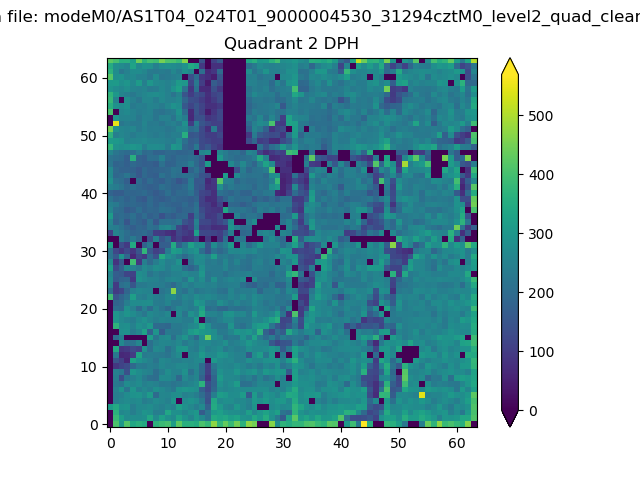
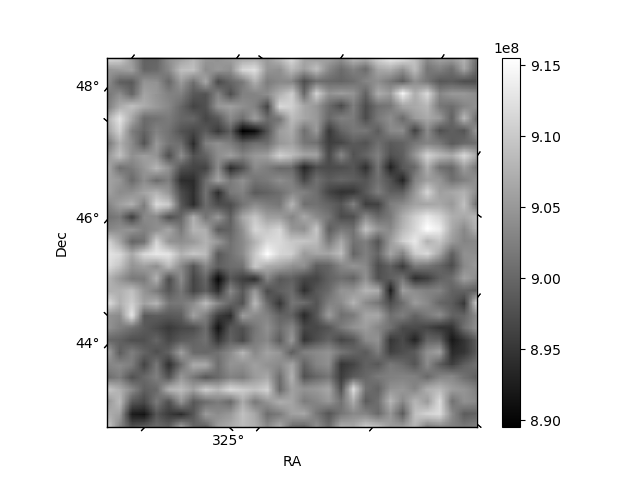
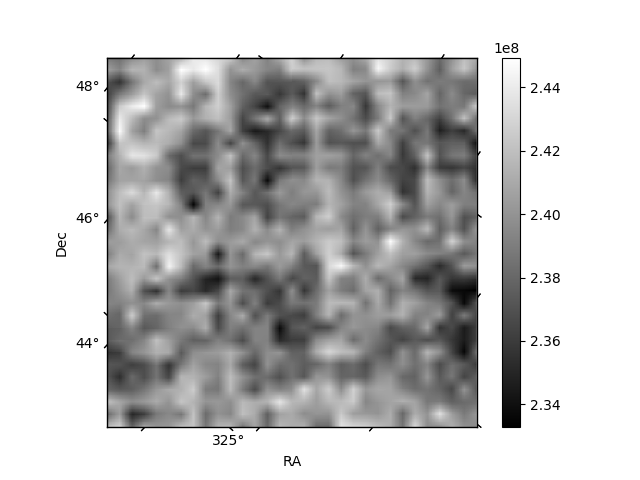
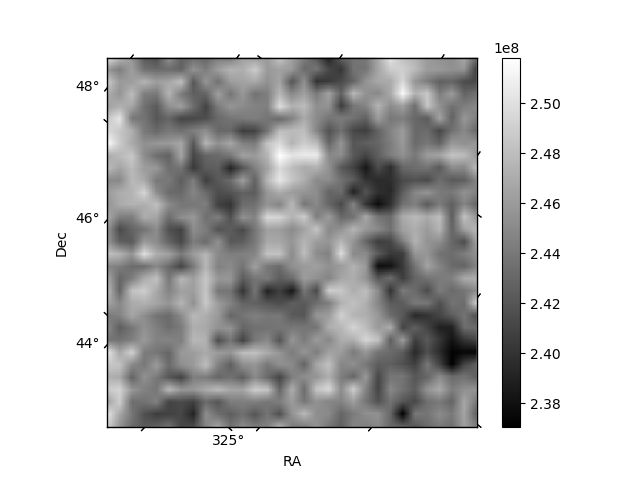
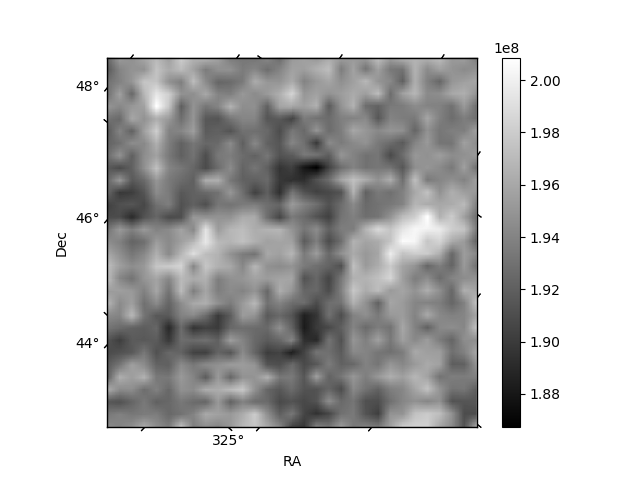
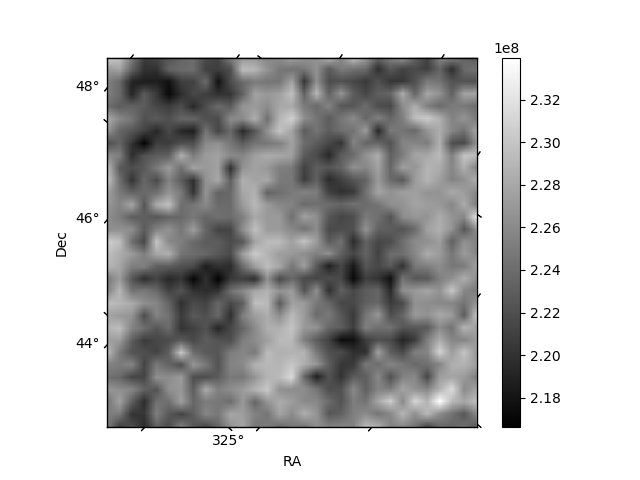
Histogram calculated using DETX and DETY for each event in the final _common_clean file
| Quadrant A | 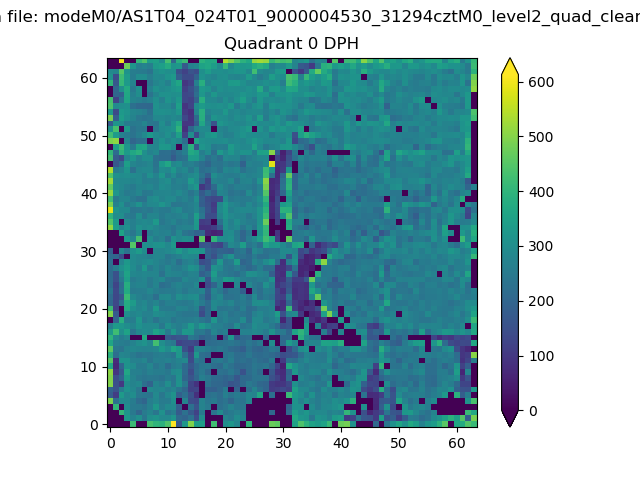 |
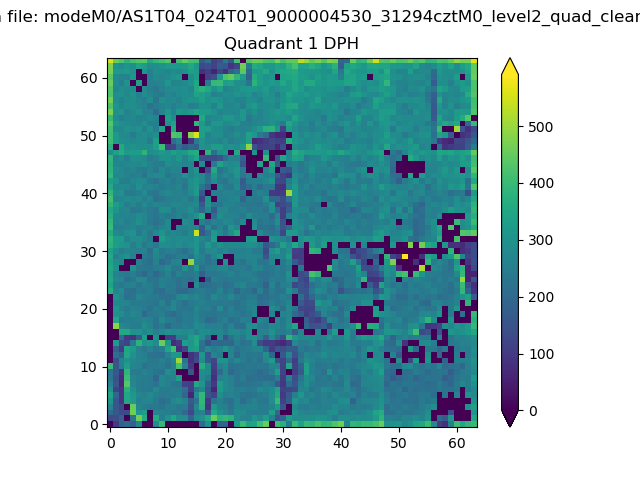 |
Quadrant B |
|---|---|---|---|
| Quadrant D | 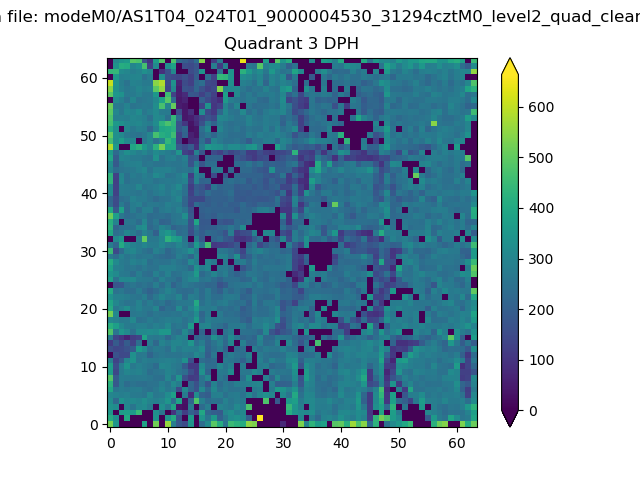 |
 |
Quadrant C |
| Plot type | Count rate plots | Images |
|---|---|---|
| Comparison with Poisson distribution Blue bars denote a histogram of data divided into 1 sec bins. Red curve is a Poisson curve with rate = median count rate of data. |
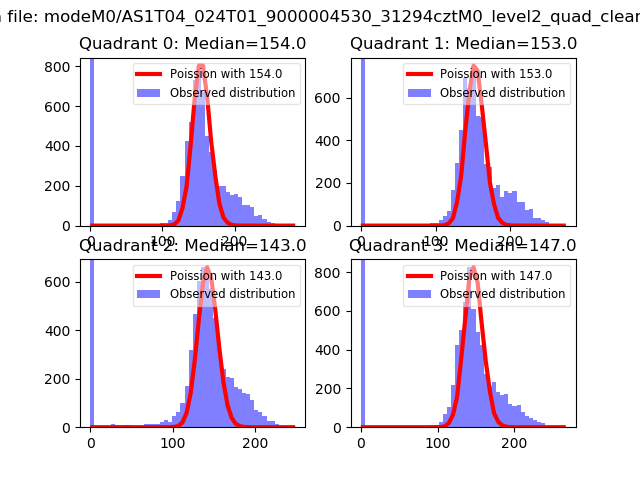 |
 |
| Quadrant-wise count rates Data is divided into 100 sec bins |
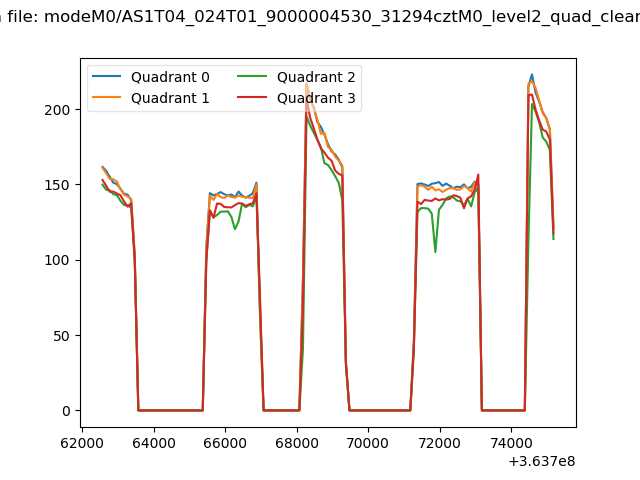 |
|
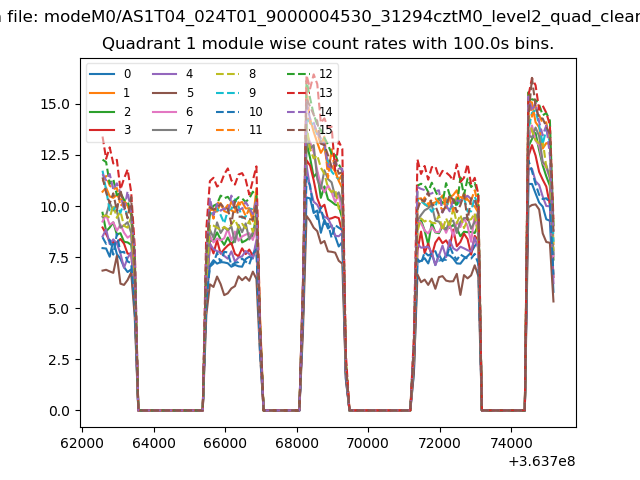
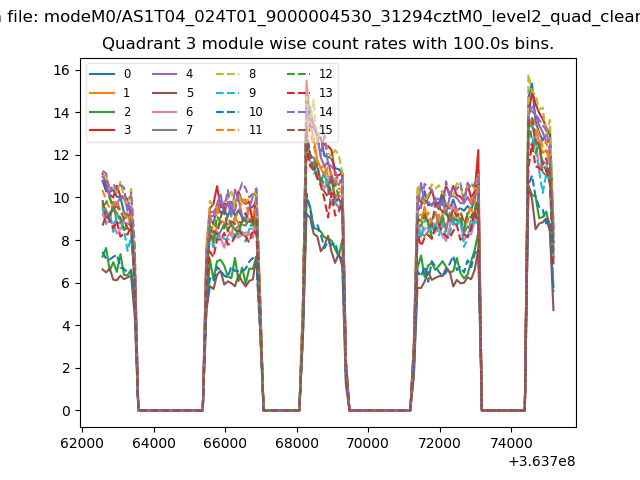
| Module-wise count rates for Quadrant A Data is divided into 100 sec bins |
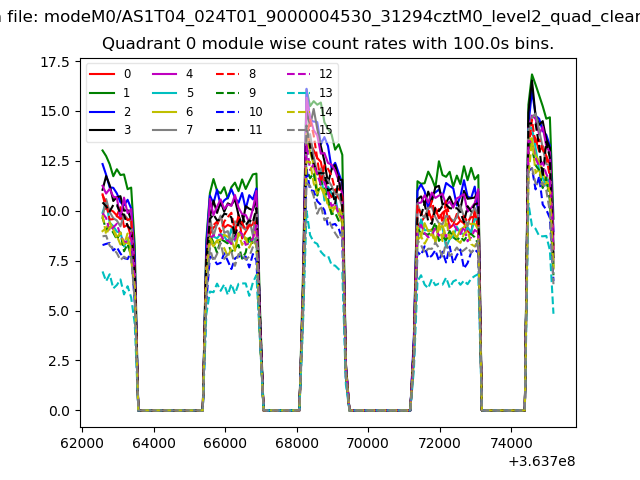 |
 |
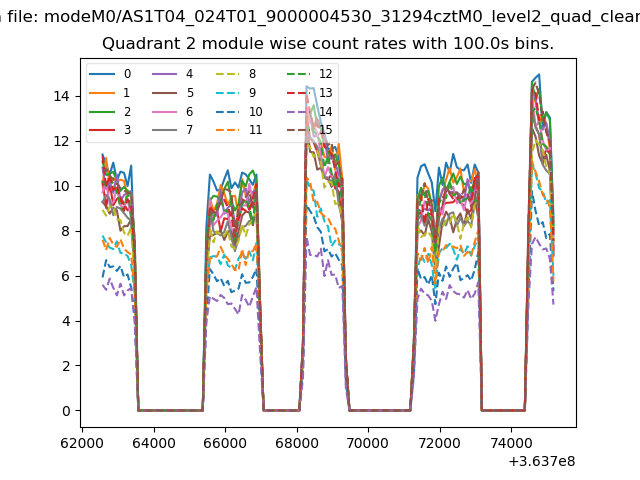
| Module-wise count rates for Quadrant B Data is divided into 100 sec bins |
 |
 |
| Module-wise count rates for Quadrant C Data is divided into 100 sec bins |
 |
 |
| Module-wise count rates for Quadrant D Data is divided into 100 sec bins |
 |
 |
| Parameter | Plot |
|---|---|
| CZT HV Monitor | 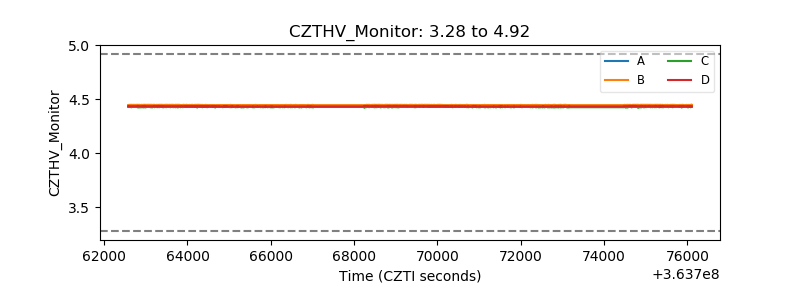 |
| D_VDD | 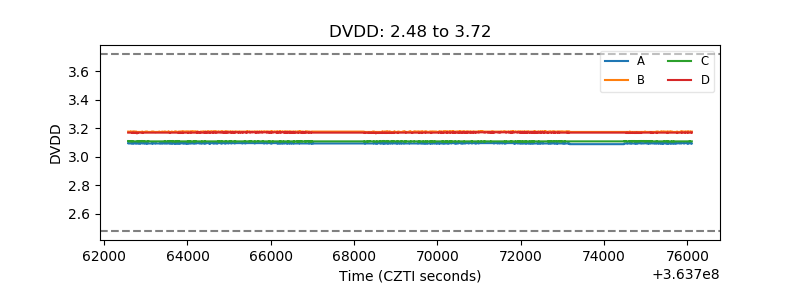 |
| Temperature 1 | 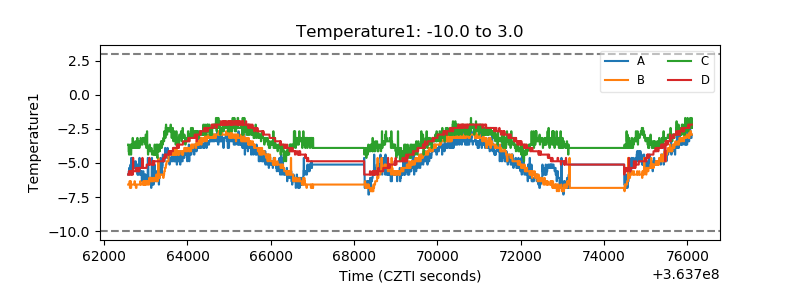 |
| Veto HV Monitor | 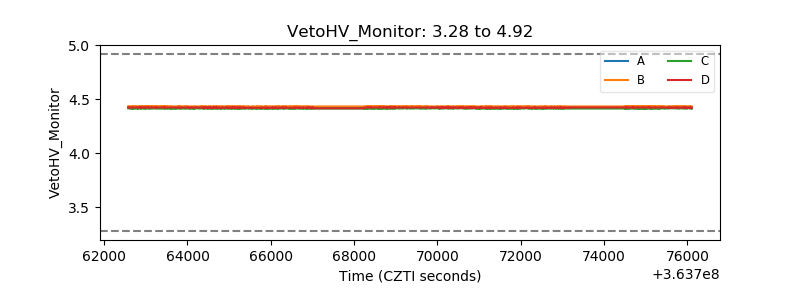 |
| Veto LLD | 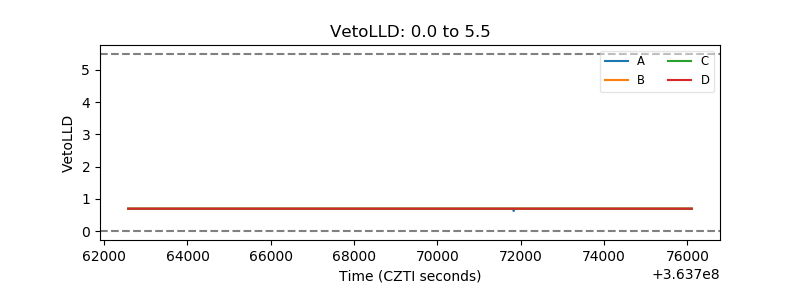 |
| Alpha Counter | 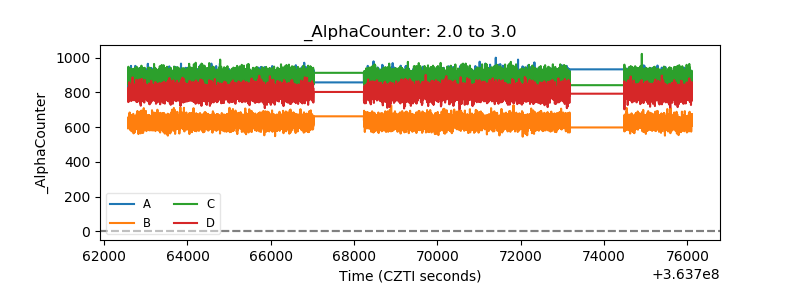 |
| _CPM_Rate | 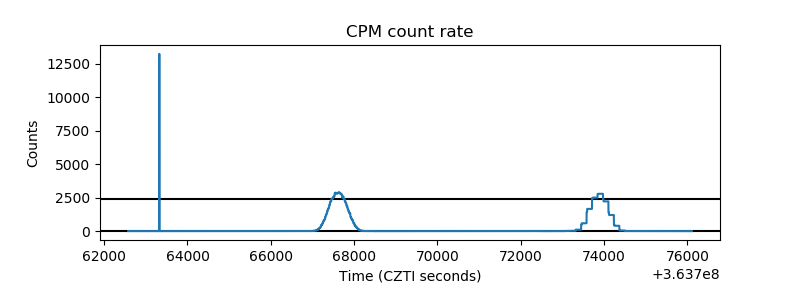 |
| CZT Counter | 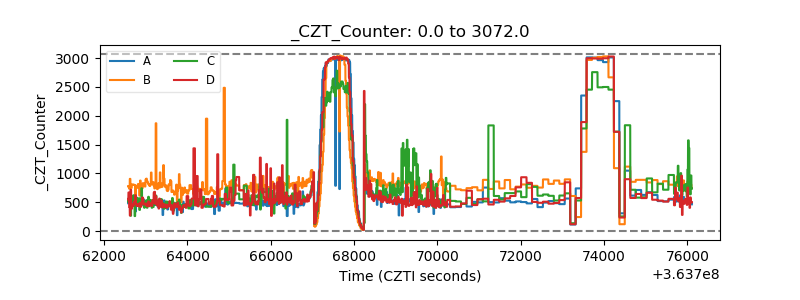 |
| +2.5 Volts monitor |  |
| +5 Volts monitor |  |
| _ROLL_ROT | 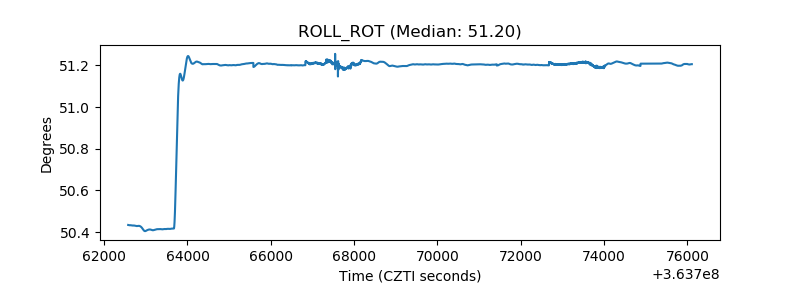 |
| _Roll_DEC | 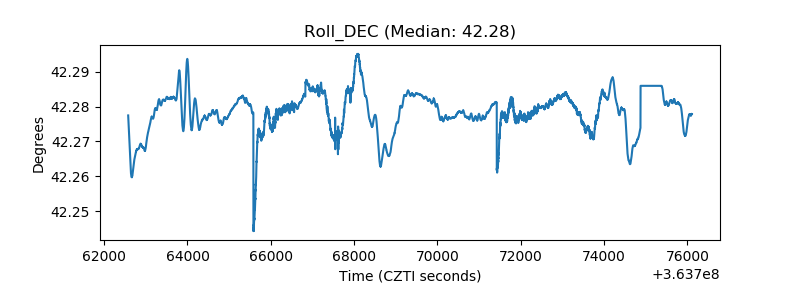 |
| _Roll_RA | 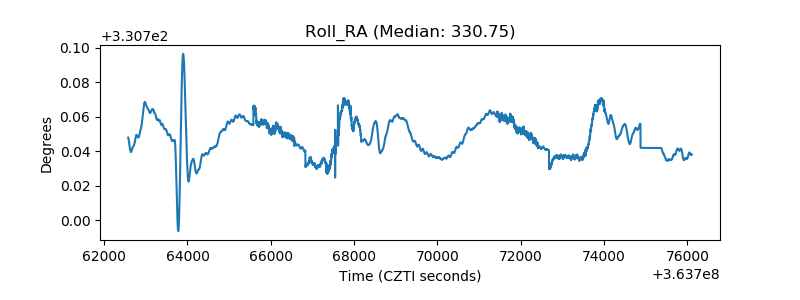 |
| Veto Counter | 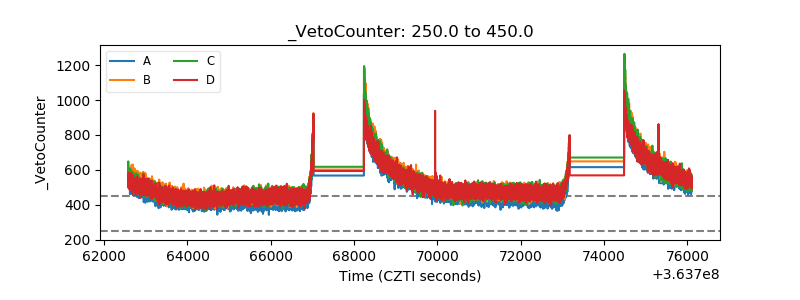 |