| Param | Original file | Final file |
|---|---|---|
| Filename | modeM0/AS1T04_024T01_9000004530_31295cztM0_level2.evt | modeM0/AS1T04_024T01_9000004530_31295cztM0_level2_quad_clean.evt |
| Size (bytes) | 608,005,440 | 87,036,480 |
| Size | 579.8 MB | 83.0 MB |
| Events in quadrant A | 3,625,539 | 571,196 |
| Events in quadrant B | 5,397,724 | 564,680 |
| Events in quadrant C | 5,175,116 | 508,222 |
| Events in quadrant D | 3,778,259 | 540,580 |
| Mode M0 | |||
|---|---|---|---|
| Quadrant | BADHDUFLAG | Total packets | Discarded packets |
| A | 0 | 14662 | 2 |
| B | 0 | 20137 | 2 |
| C | 0 | 20003 | 7 |
| D | 0 | 15116 | 2 |
| Mode SS | |||
|---|---|---|---|
| Quadrant | BADHDUFLAG | Total packets | Discarded packets |
| A | 0 | 132 | 0 |
| B | 0 | 132 | 0 |
| C | 0 | 132 | 0 |
| D | 0 | 132 | 0 |
| Mode M9 | |||
|---|---|---|---|
| Quadrant | BADHDUFLAG | Total packets | Discarded packets |
| A | 0 | 14 | 0 |
| B | 0 | 15 | 0 |
| C | 0 | 15 | 0 |
| D | 0 | 15 | 0 |
| Quadrant | Total seconds | Saturated seconds | Saturation percentage |
|---|---|---|---|
| A | 6459 | 85 | 1.315993% |
| B | 6459 | 167 | 2.585540% |
| C | 6458 | 590 | 9.135955% |
| D | 6458 | 64 | 0.991019% |
Noise dominated data is calculated using 1-second bins in cleaned event files. If a bin has >2000 counts, and if more than 50% of those come from <1% of pixels, then it is considered to be noise-dominated and hence unusable.
| Quadrant | # 1 sec bins | Bins with >0 counts | Bins with >2000 counts | High rate bins dominated by noise | Noise dominated (total time) | Noise dominated (detector-on time) | Marked lightcurve |
|---|---|---|---|---|---|---|---|
| A | 7794 | 6460 | 0 | 0 | 0.00% | 0.00% | 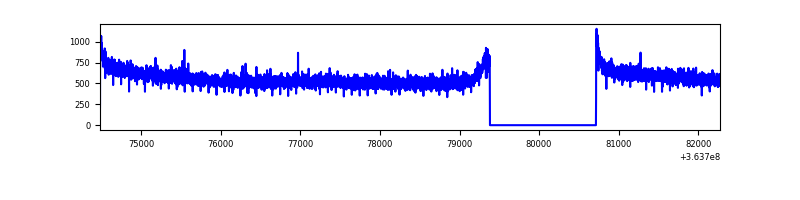 |
| B | 7794 | 6460 | 4 | 4 | 0.05% | 0.06% | 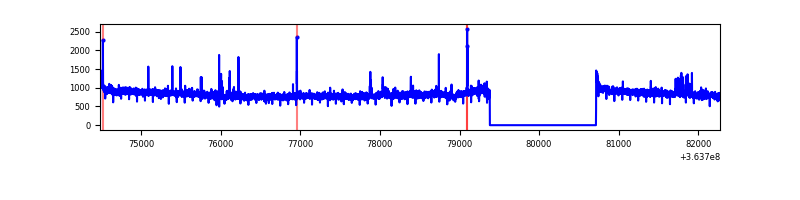 |
| C | 7792 | 6458 | 151 | 151 | 1.94% | 2.34% | 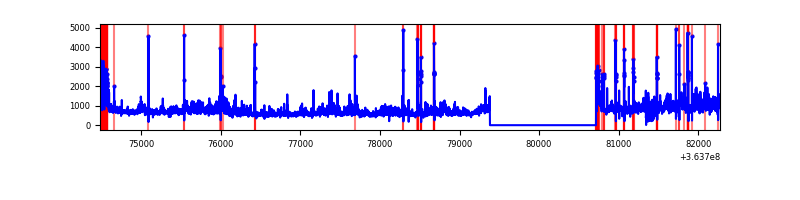 |
| D | 7793 | 6459 | 4 | 4 | 0.05% | 0.06% | 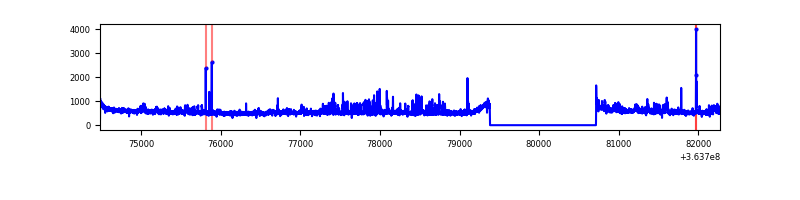 |
Top three noisy pixels from each quadrant. If the there are fewer than three noisy pixels in the level2.evt file, extra rows are filled as -1
| Pixel properties | Quadrant properties | ||||||
|---|---|---|---|---|---|---|---|
| Quadrant | DetID | PixID | Counts | Sigma | Mean | Median | Sigma |
| A | 13 | 254 | 11977 | 59.8 | 940 | 925 | 184.8 |
| A | 3 | 137 | 8541 | 41.21 | 940 | 925 | 184.8 |
| A | 0 | 226 | 8190 | 39.31 | 940 | 925 | 184.8 |
| B | 6 | 159 | 1729412 | 10172.21 | 911 | 894 | 169.9 |
| B | 4 | 80 | 77269 | 449.46 | 911 | 894 | 169.9 |
| B | 12 | 111 | 19813 | 111.34 | 911 | 894 | 169.9 |
| C | 3 | 233 | 1249551 | 6584.44 | 834 | 842 | 189.6 |
| C | 0 | 10 | 292937 | 1540.22 | 834 | 842 | 189.6 |
| C | 14 | 238 | 213881 | 1123.35 | 834 | 842 | 189.6 |
| D | 8 | 195 | 326773 | 1514.47 | 892 | 871 | 215.2 |
| D | 12 | 233 | 37201 | 168.82 | 892 | 871 | 215.2 |
| D | 2 | 234 | 24659 | 110.54 | 892 | 871 | 215.2 |
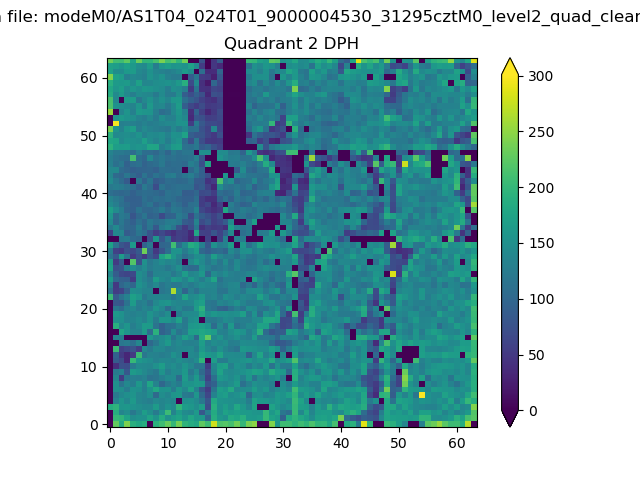
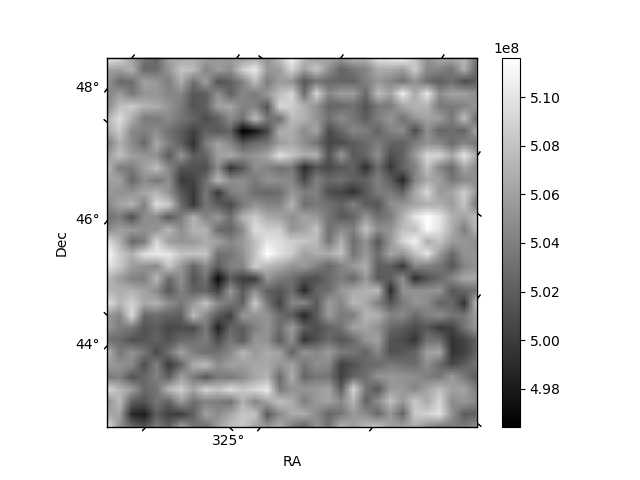
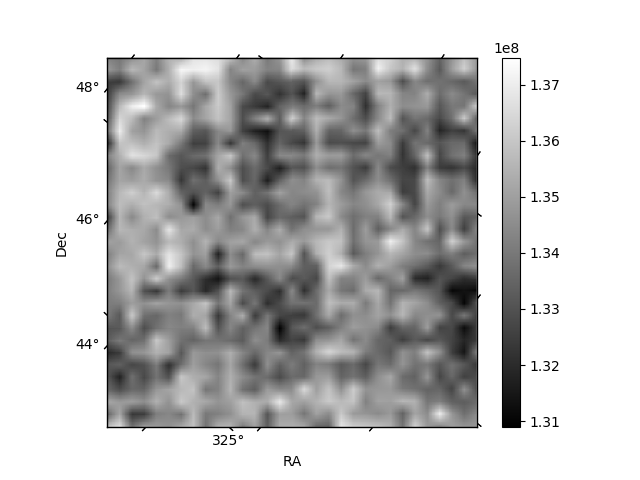
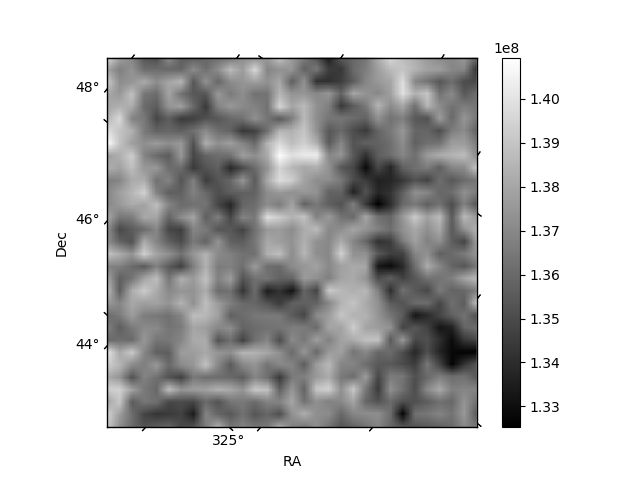
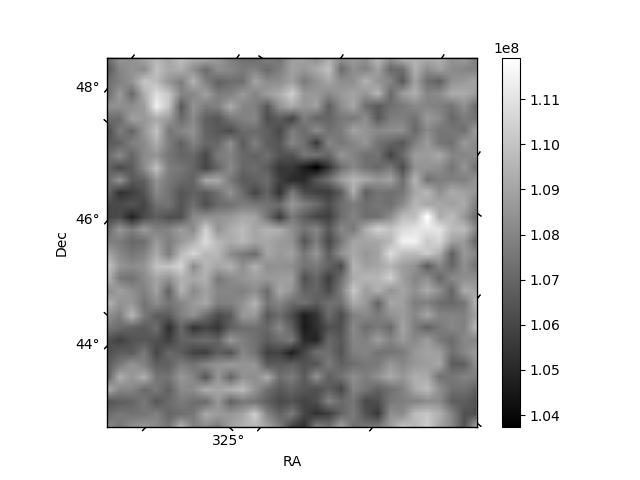
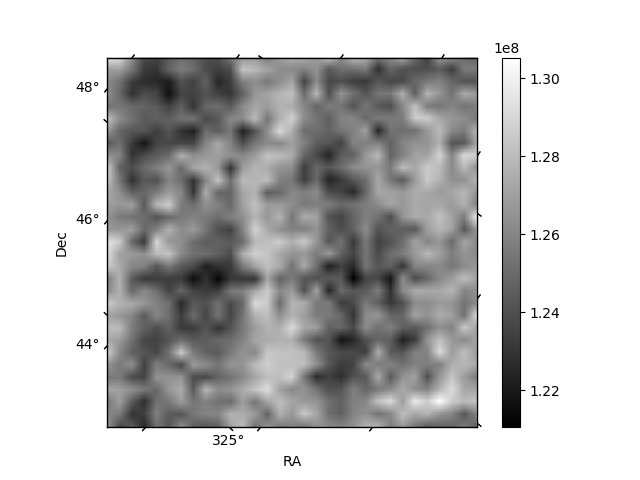
Histogram calculated using DETX and DETY for each event in the final _common_clean file
| Quadrant A | 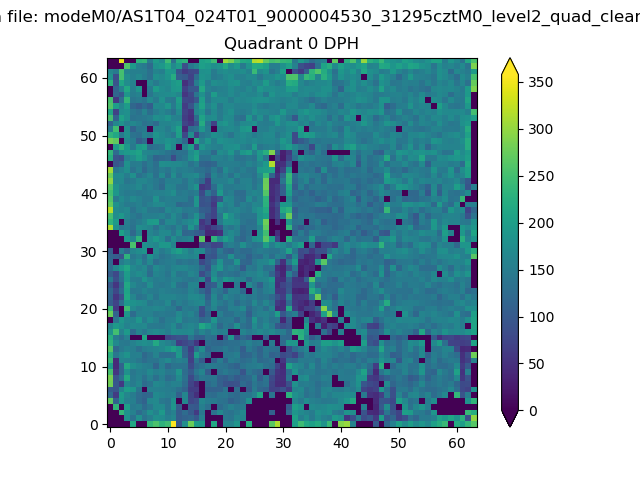 |
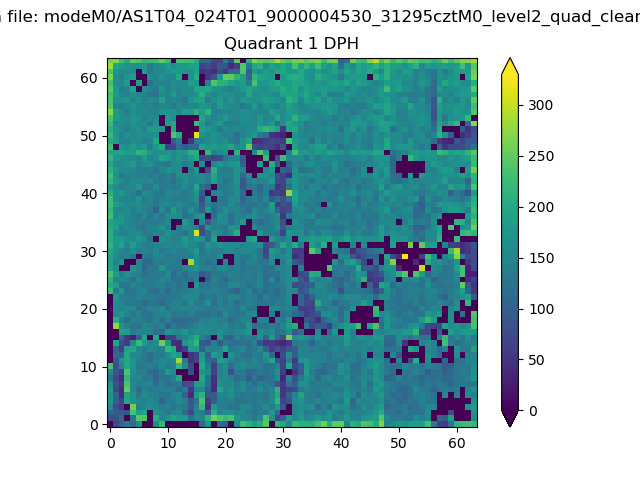 |
Quadrant B |
|---|---|---|---|
| Quadrant D | 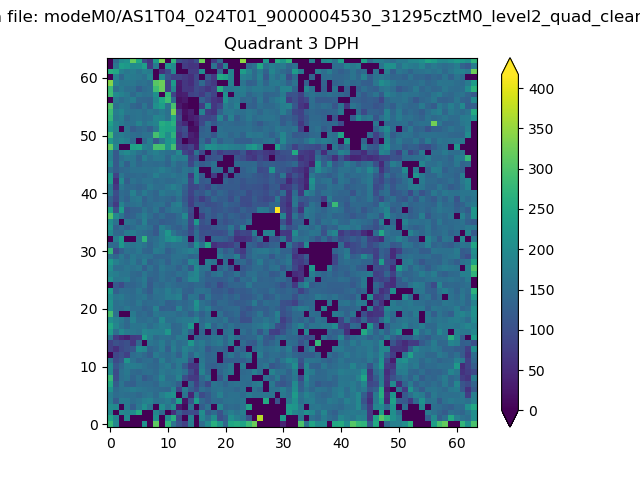 |
 |
Quadrant C |
| Plot type | Count rate plots | Images |
|---|---|---|
| Comparison with Poisson distribution Blue bars denote a histogram of data divided into 1 sec bins. Red curve is a Poisson curve with rate = median count rate of data. |
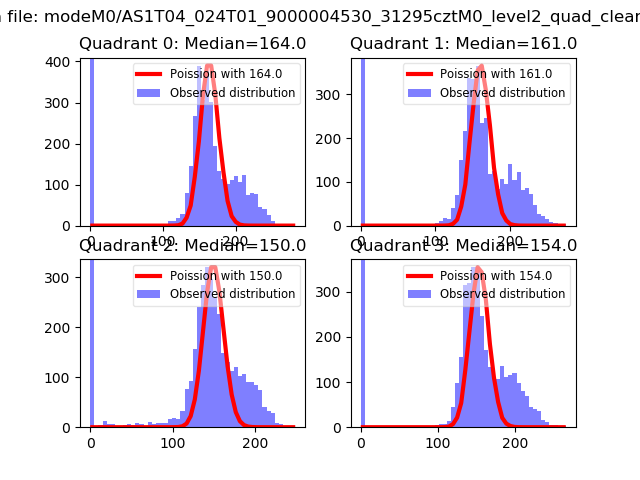 |
 |
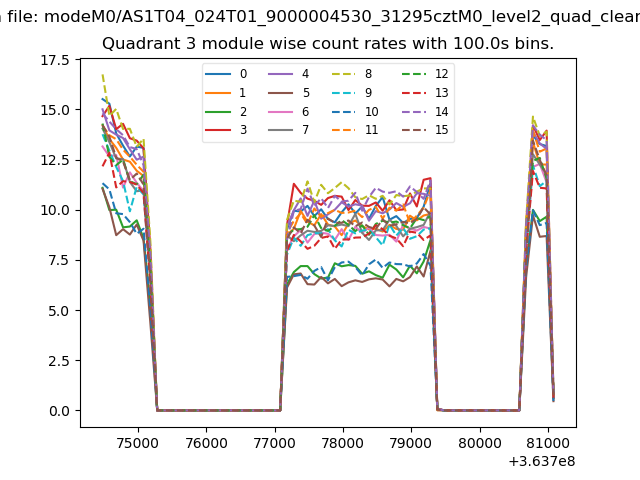
| Quadrant-wise count rates Data is divided into 100 sec bins |
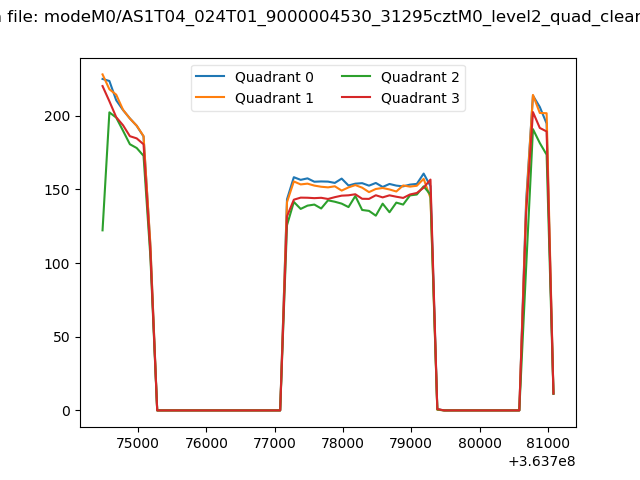 |
|
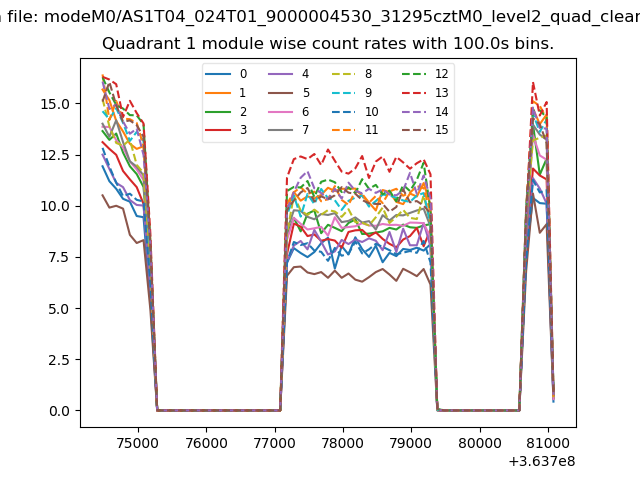
| Module-wise count rates for Quadrant A Data is divided into 100 sec bins |
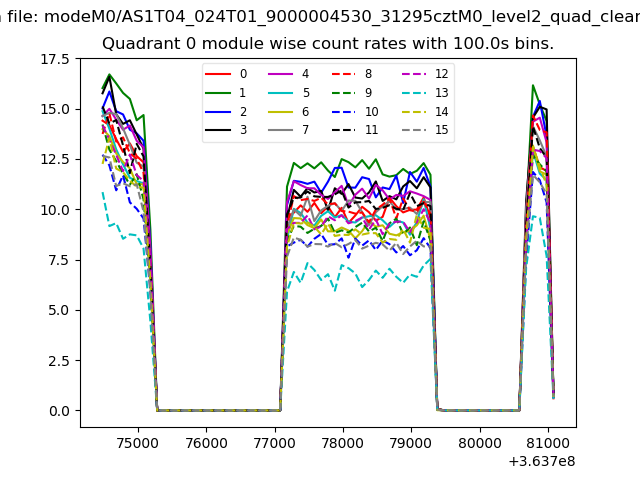 |
 |
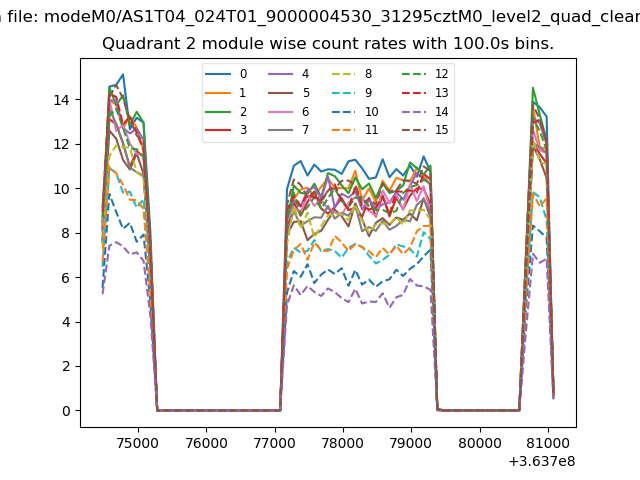
| Module-wise count rates for Quadrant B Data is divided into 100 sec bins |
 |
 |
| Module-wise count rates for Quadrant C Data is divided into 100 sec bins |
 |
 |
| Module-wise count rates for Quadrant D Data is divided into 100 sec bins |
 |
 |
| Parameter | Plot |
|---|---|
| CZT HV Monitor | 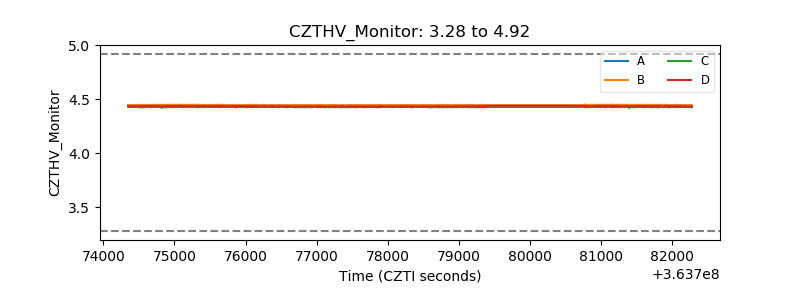 |
| D_VDD | 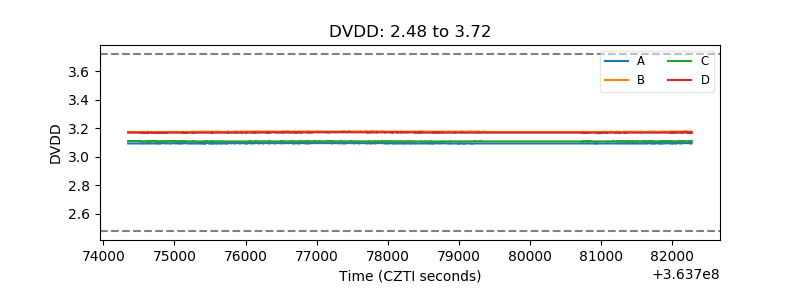 |
| Temperature 1 | 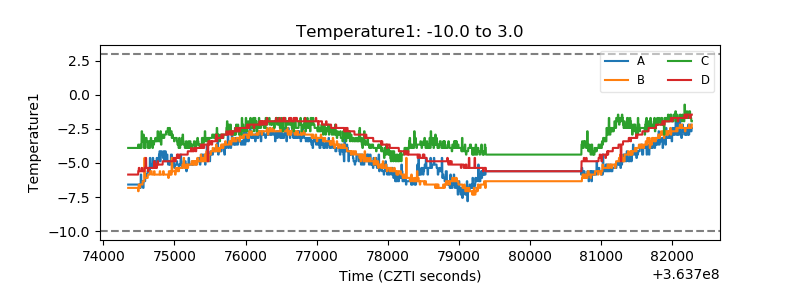 |
| Veto HV Monitor | 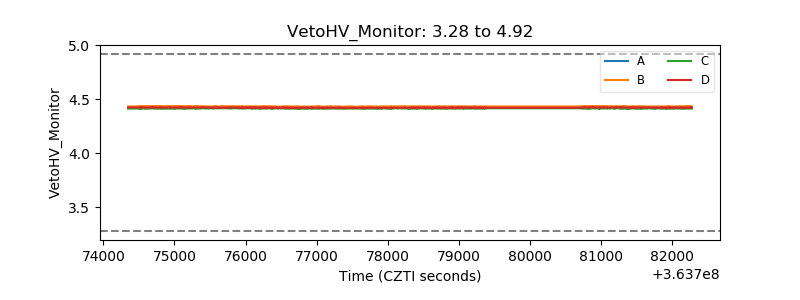 |
| Veto LLD | 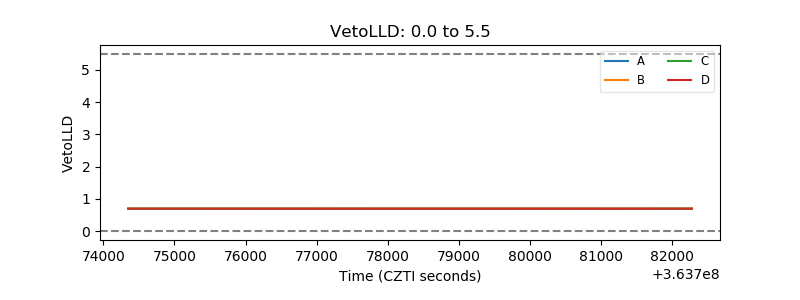 |
| Alpha Counter | 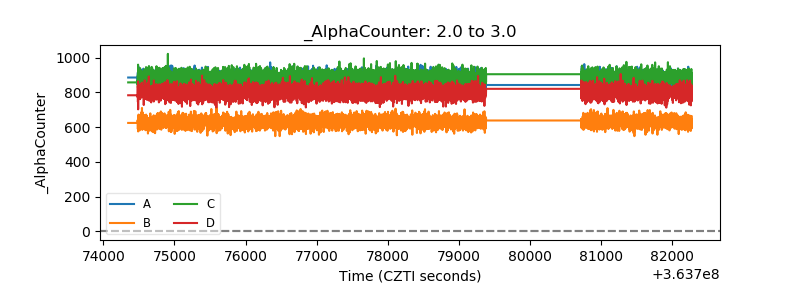 |
| _CPM_Rate | 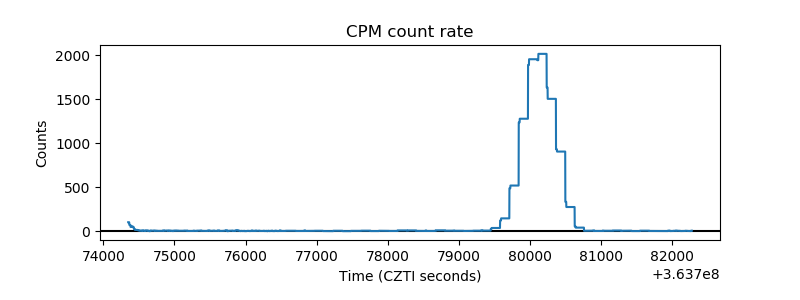 |
| CZT Counter | 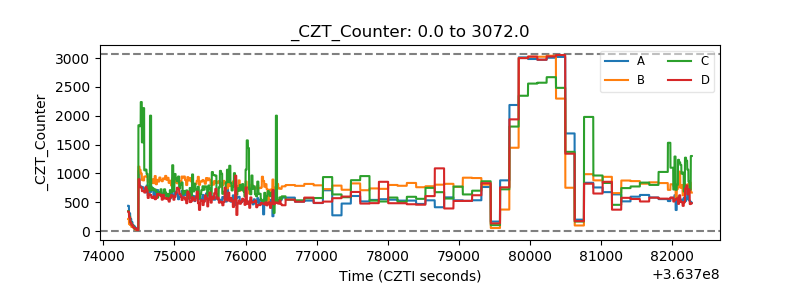 |
| +2.5 Volts monitor |  |
| +5 Volts monitor |  |
| _ROLL_ROT | 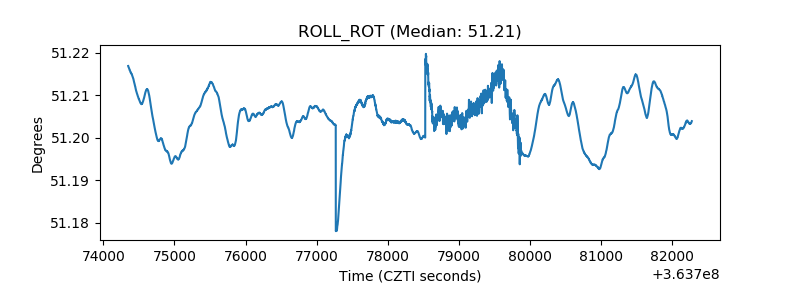 |
| _Roll_DEC |  |
| _Roll_RA | 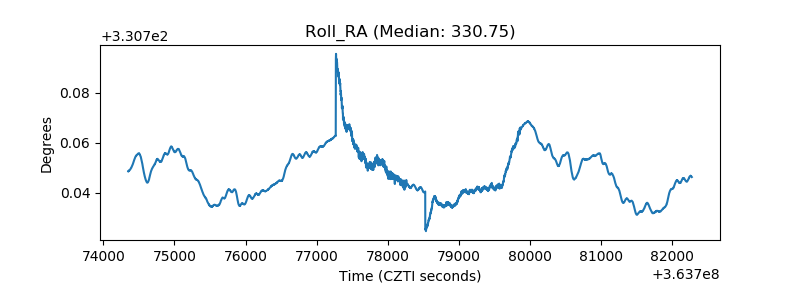 |
| Veto Counter | 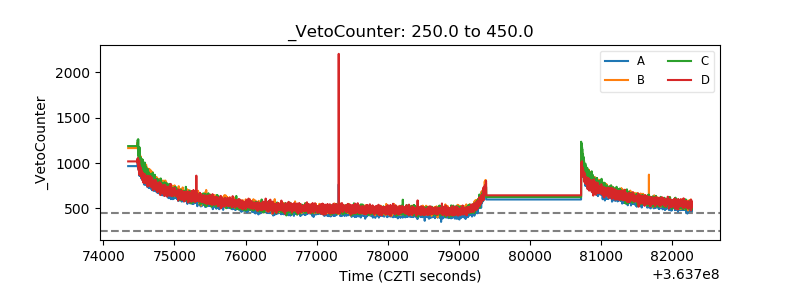 |