| Param | Original file | Final file |
|---|---|---|
| Filename | modeM0/AS1T04_024T01_9000004530_31296cztM0_level2.evt | modeM0/AS1T04_024T01_9000004530_31296cztM0_level2_quad_clean.evt |
| Size (bytes) | 655,240,320 | 76,227,840 |
| Size | 624.9 MB | 72.7 MB |
| Events in quadrant A | 3,596,212 | 486,271 |
| Events in quadrant B | 5,429,251 | 477,532 |
| Events in quadrant C | 6,581,168 | 430,934 |
| Events in quadrant D | 3,798,647 | 460,306 |
| Mode M0 | |||
|---|---|---|---|
| Quadrant | BADHDUFLAG | Total packets | Discarded packets |
| A | 0 | 14494 | 2 |
| B | 0 | 20321 | 4 |
| C | 0 | 24228 | 2 |
| D | 0 | 15164 | 2 |
| Mode SS | |||
|---|---|---|---|
| Quadrant | BADHDUFLAG | Total packets | Discarded packets |
| A | 0 | 132 | 0 |
| B | 0 | 132 | 0 |
| C | 0 | 132 | 0 |
| D | 0 | 132 | 0 |
| Mode M9 | |||
|---|---|---|---|
| Quadrant | BADHDUFLAG | Total packets | Discarded packets |
| A | 0 | 15 | 0 |
| B | 0 | 16 | 0 |
| C | 0 | 16 | 0 |
| D | 0 | 16 | 0 |
| Quadrant | Total seconds | Saturated seconds | Saturation percentage |
|---|---|---|---|
| A | 6493 | 159 | 2.448791% |
| B | 6492 | 260 | 4.004929% |
| C | 6492 | 883 | 13.601356% |
| D | 6492 | 140 | 2.156500% |
Noise dominated data is calculated using 1-second bins in cleaned event files. If a bin has >2000 counts, and if more than 50% of those come from <1% of pixels, then it is considered to be noise-dominated and hence unusable.
| Quadrant | # 1 sec bins | Bins with >0 counts | Bins with >2000 counts | High rate bins dominated by noise | Noise dominated (total time) | Noise dominated (detector-on time) | Marked lightcurve |
|---|---|---|---|---|---|---|---|
| A | 7728 | 6493 | 0 | 0 | 0.00% | 0.00% | 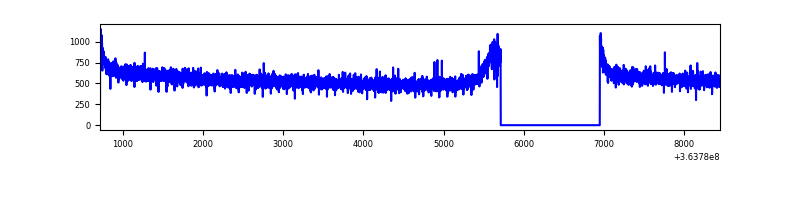 |
| B | 7727 | 6492 | 12 | 12 | 0.16% | 0.18% | 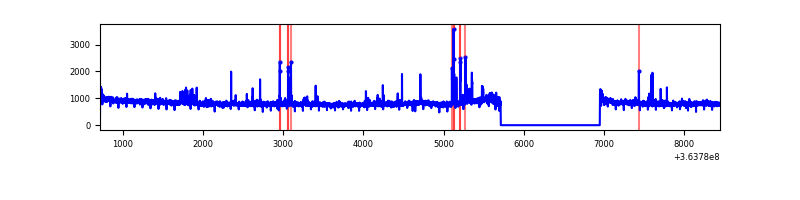 |
| C | 7727 | 6492 | 191 | 191 | 2.47% | 2.94% | 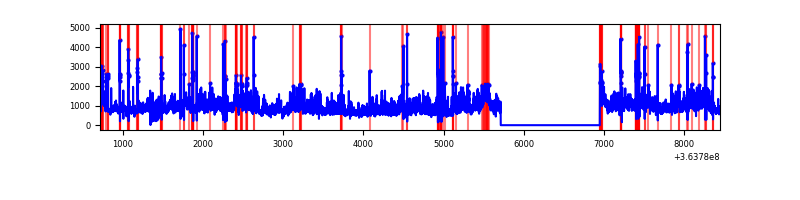 |
| D | 7727 | 6492 | 18 | 18 | 0.23% | 0.28% | 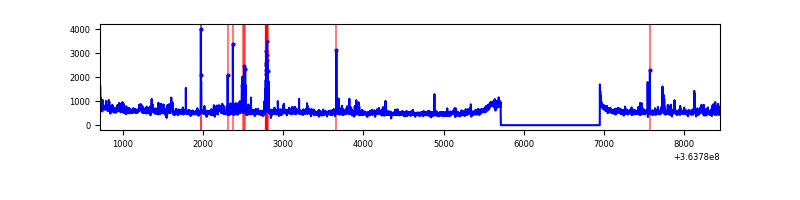 |
Top three noisy pixels from each quadrant. If the there are fewer than three noisy pixels in the level2.evt file, extra rows are filled as -1
| Pixel properties | Quadrant properties | ||||||
|---|---|---|---|---|---|---|---|
| Quadrant | DetID | PixID | Counts | Sigma | Mean | Median | Sigma |
| A | 13 | 254 | 12506 | 63.06 | 932 | 917 | 183.8 |
| A | 3 | 137 | 8648 | 42.07 | 932 | 917 | 183.8 |
| A | 0 | 226 | 7965 | 38.35 | 932 | 917 | 183.8 |
| B | 6 | 159 | 1725418 | 10142.87 | 902 | 880 | 170.0 |
| B | 4 | 80 | 150817 | 881.85 | 902 | 880 | 170.0 |
| B | 12 | 111 | 20122 | 113.17 | 902 | 880 | 170.0 |
| C | 3 | 233 | 2852147 | 15211.44 | 824 | 832 | 187.4 |
| C | 14 | 238 | 177861 | 944.43 | 824 | 832 | 187.4 |
| C | 0 | 10 | 154874 | 821.8 | 824 | 832 | 187.4 |
| D | 8 | 195 | 242359 | 1096.05 | 891 | 871 | 220.3 |
| D | 12 | 233 | 115377 | 519.71 | 891 | 871 | 220.3 |
| D | 2 | 250 | 29205 | 128.6 | 891 | 871 | 220.3 |
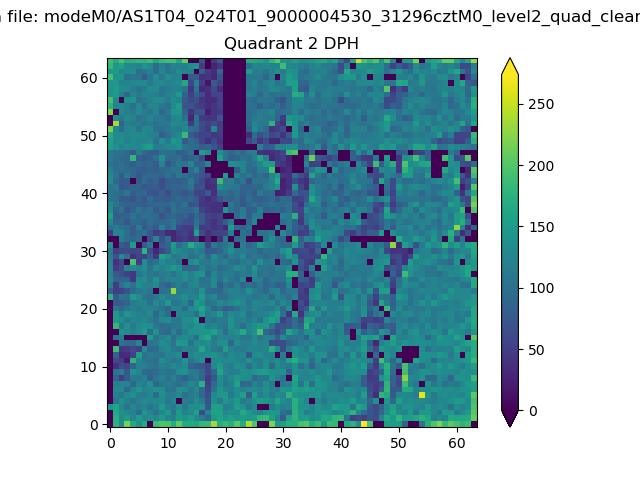
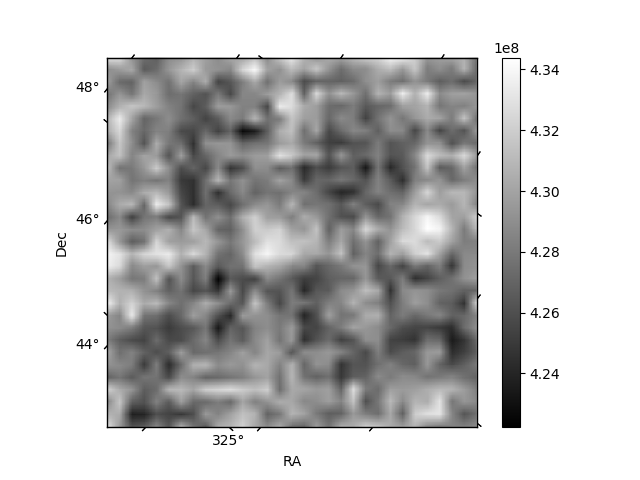
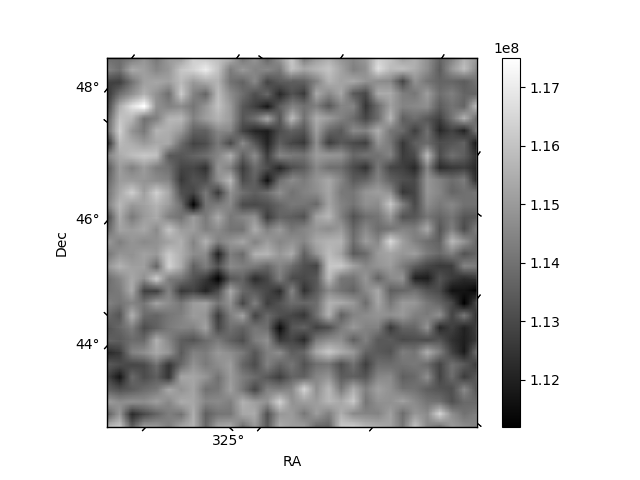
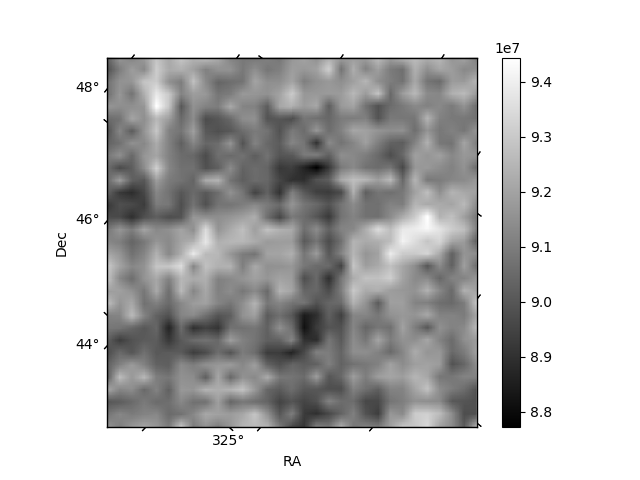
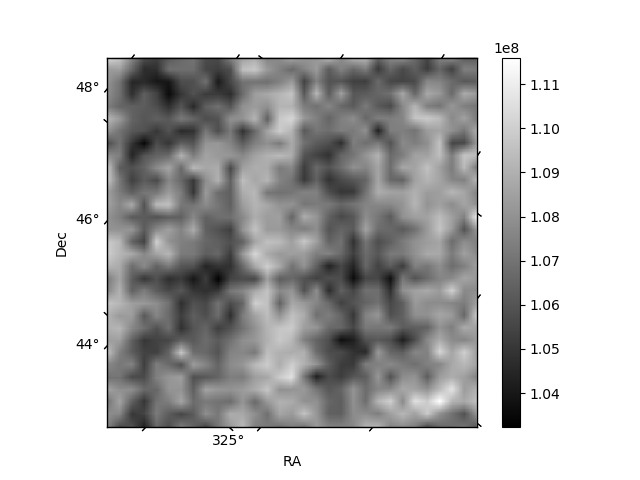
Histogram calculated using DETX and DETY for each event in the final _common_clean file
| Quadrant A | 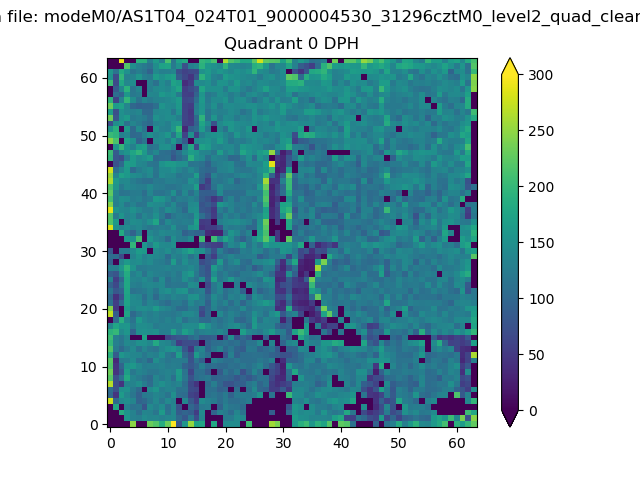 |
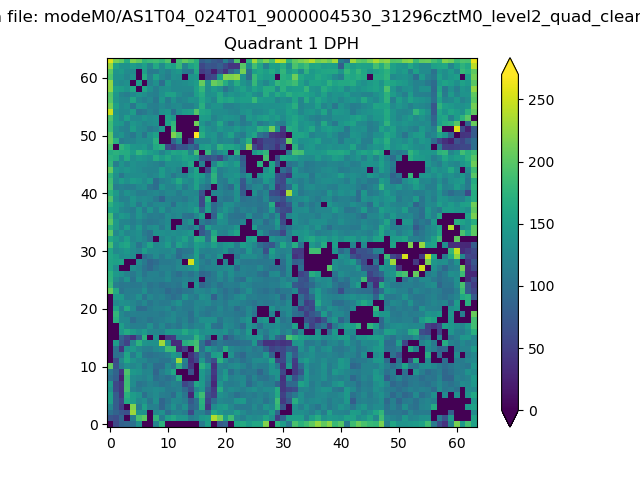 |
Quadrant B |
|---|---|---|---|
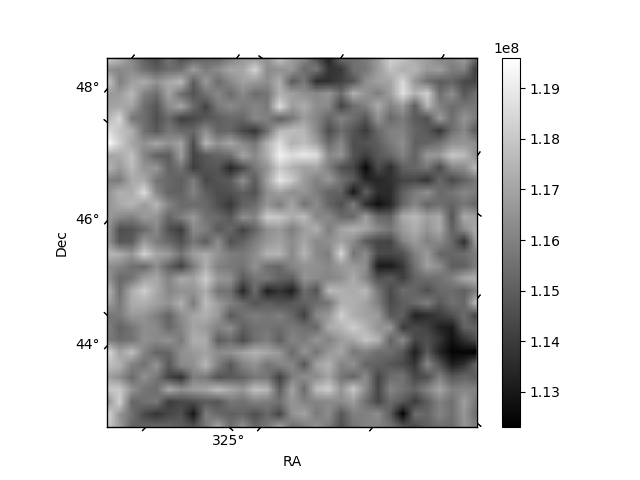
| Quadrant D | 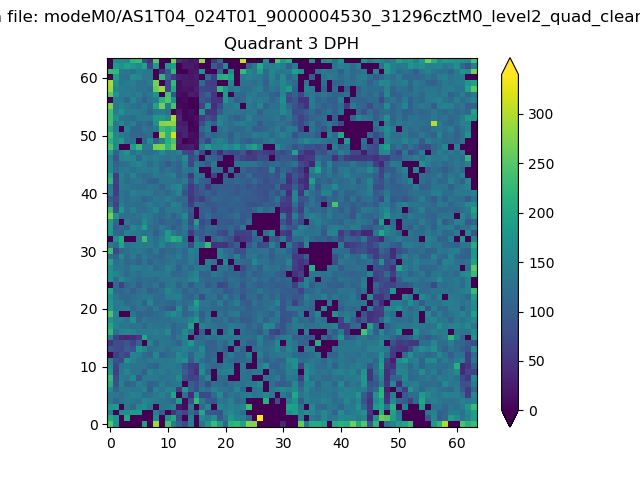 |
 |
Quadrant C |
| Plot type | Count rate plots | Images |
|---|---|---|
| Comparison with Poisson distribution Blue bars denote a histogram of data divided into 1 sec bins. Red curve is a Poisson curve with rate = median count rate of data. |
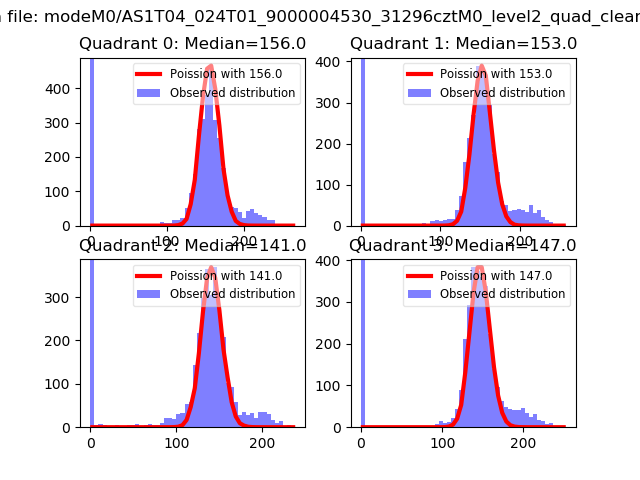 |
 |
| Quadrant-wise count rates Data is divided into 100 sec bins |
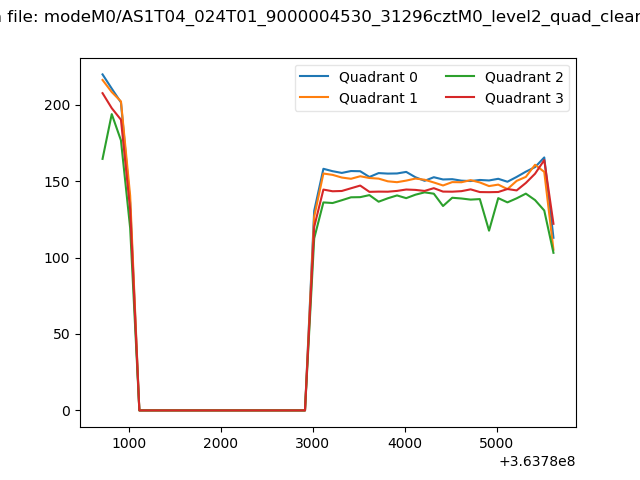 |
|
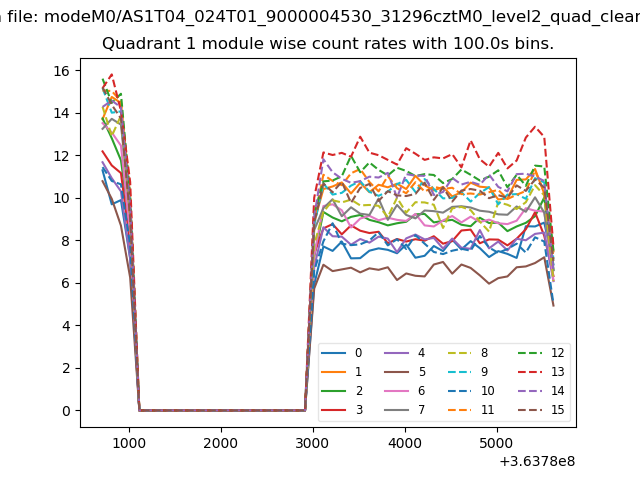
| Module-wise count rates for Quadrant A Data is divided into 100 sec bins |
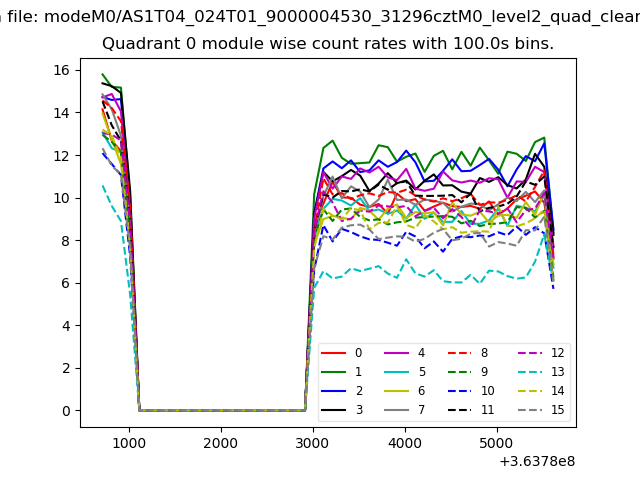 |
 |
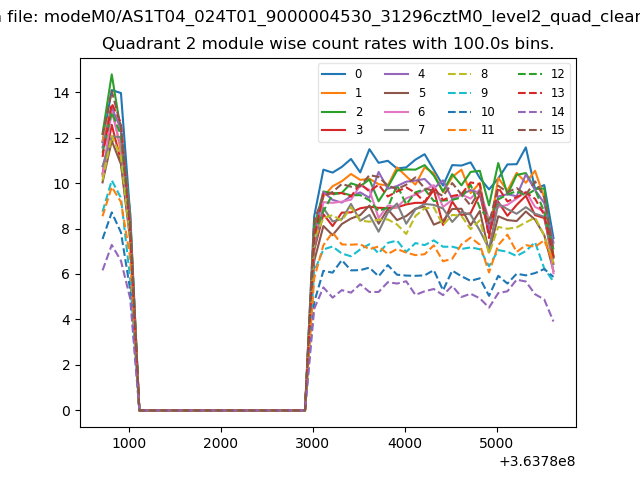
| Module-wise count rates for Quadrant B Data is divided into 100 sec bins |
 |
 |
| Module-wise count rates for Quadrant C Data is divided into 100 sec bins |
 |
 |
| Module-wise count rates for Quadrant D Data is divided into 100 sec bins |
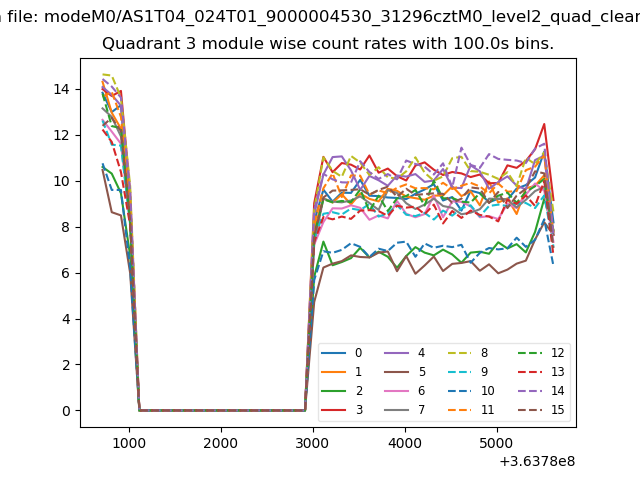 |
 |
| Parameter | Plot |
|---|---|
| CZT HV Monitor | 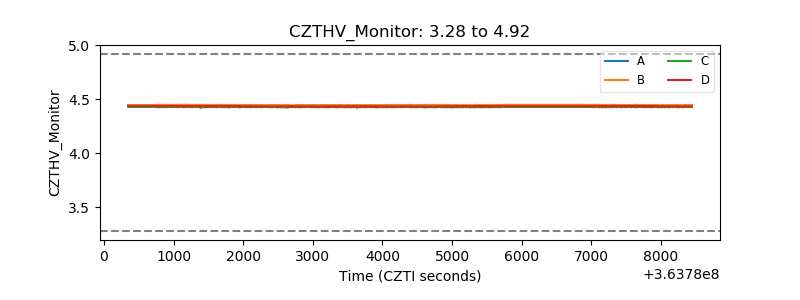 |
| D_VDD | 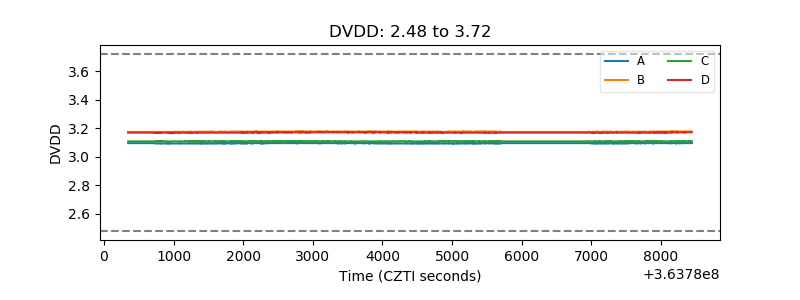 |
| Temperature 1 | 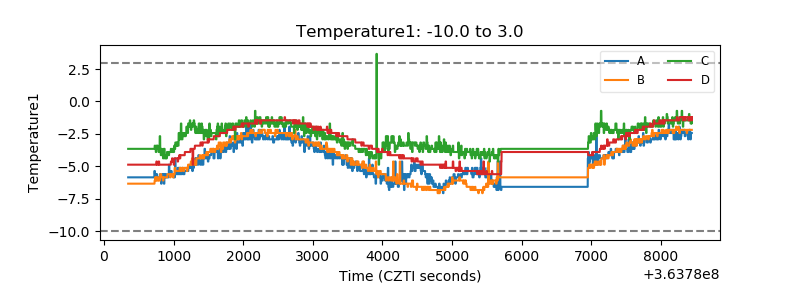 |
| Veto HV Monitor |  |
| Veto LLD | 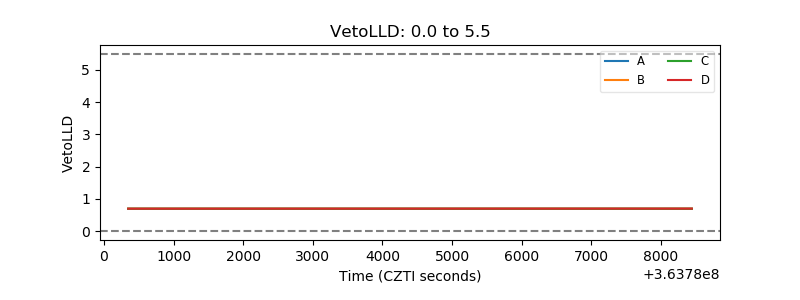 |
| Alpha Counter | 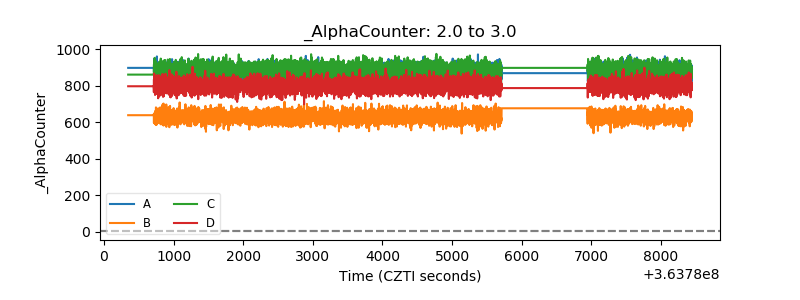 |
| _CPM_Rate | 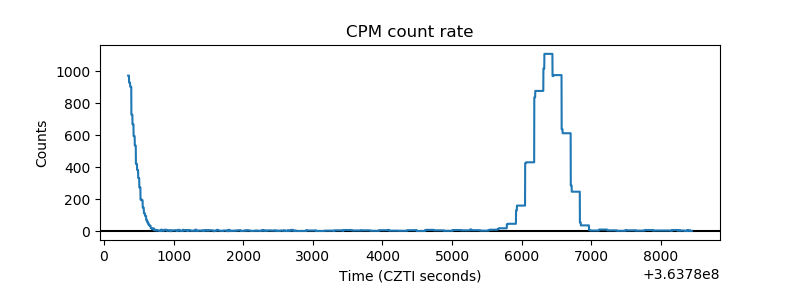 |
| CZT Counter | 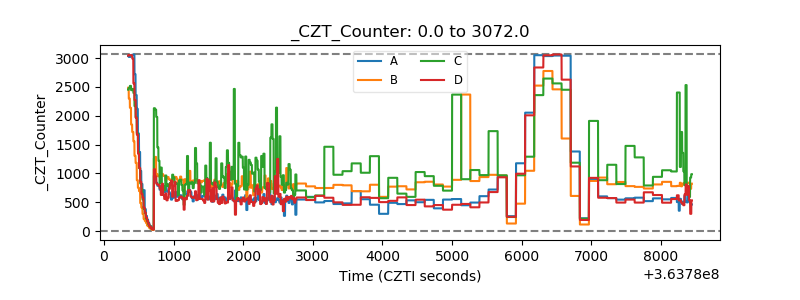 |
| +2.5 Volts monitor |  |
| +5 Volts monitor |  |
| _ROLL_ROT |  |
| _Roll_DEC | 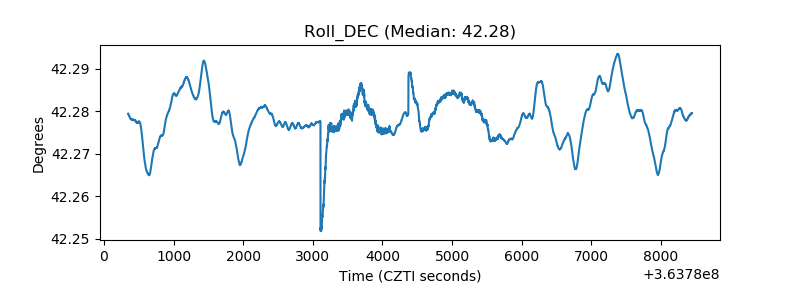 |
| _Roll_RA | 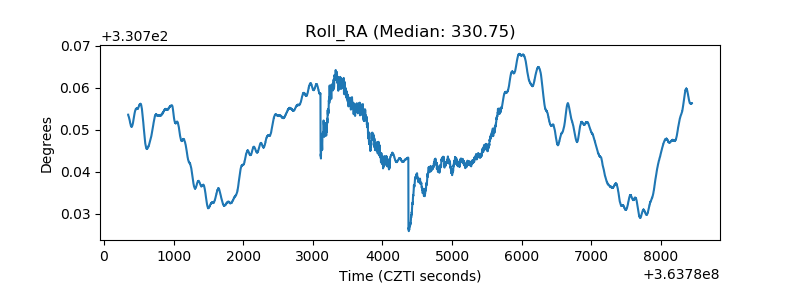 |
| Veto Counter |  |