| Param | Original file | Final file |
|---|---|---|
| Filename | modeM0/AS1T04_024T01_9000004530_31297cztM0_level2.evt | modeM0/AS1T04_024T01_9000004530_31297cztM0_level2_quad_clean.evt |
| Size (bytes) | 245,180,160 | 15,099,840 |
| Size | 233.8 MB | 14.4 MB |
| Events in quadrant A | 1,328,949 | 74,632 |
| Events in quadrant B | 1,984,920 | 73,267 |
| Events in quadrant C | 2,543,996 | 64,780 |
| Events in quadrant D | 1,400,715 | 68,363 |
| Mode M0 | |||
|---|---|---|---|
| Quadrant | BADHDUFLAG | Total packets | Discarded packets |
| A | 0 | 5297 | 1 |
| B | 0 | 7480 | 1 |
| C | 0 | 9324 | 1 |
| D | 0 | 5640 | 1 |
| Mode SS | |||
|---|---|---|---|
| Quadrant | BADHDUFLAG | Total packets | Discarded packets |
| A | 0 | 50 | 0 |
| B | 0 | 50 | 0 |
| C | 0 | 50 | 0 |
| D | 0 | 50 | 0 |
| Mode M9 | |||
|---|---|---|---|
| Quadrant | BADHDUFLAG | Total packets | Discarded packets |
| A | 0 | 5 | 0 |
| B | 0 | 6 | 0 |
| C | 0 | 6 | 0 |
| D | 0 | 6 | 0 |
| Quadrant | Total seconds | Saturated seconds | Saturation percentage |
|---|---|---|---|
| A | 2433 | 24 | 0.986436% |
| B | 2433 | 53 | 2.178381% |
| C | 2433 | 238 | 9.782162% |
| D | 2433 | 12 | 0.493218% |
Noise dominated data is calculated using 1-second bins in cleaned event files. If a bin has >2000 counts, and if more than 50% of those come from <1% of pixels, then it is considered to be noise-dominated and hence unusable.
| Quadrant | # 1 sec bins | Bins with >0 counts | Bins with >2000 counts | High rate bins dominated by noise | Noise dominated (total time) | Noise dominated (detector-on time) | Marked lightcurve |
|---|---|---|---|---|---|---|---|
| A | 2432 | 2432 | 0 | 0 | 0.00% | 0.00% | 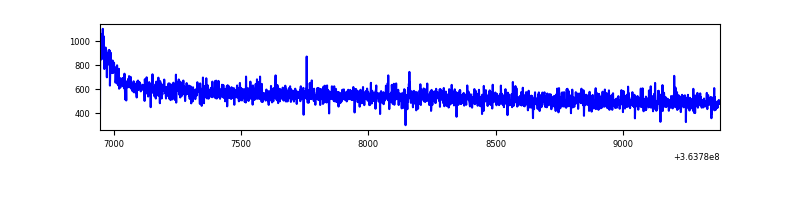 |
| B | 2432 | 2432 | 5 | 5 | 0.21% | 0.21% | 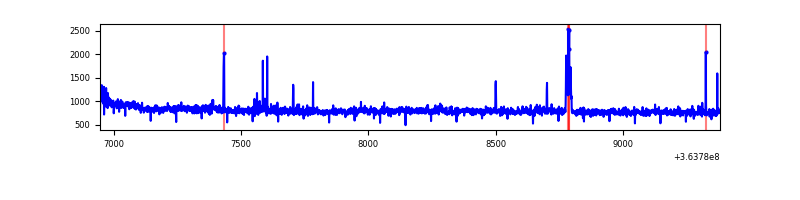 |
| C | 2432 | 2432 | 73 | 73 | 3.00% | 3.00% | 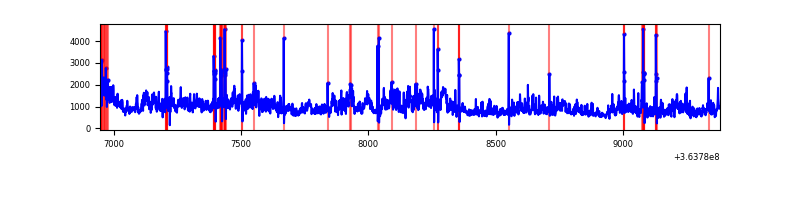 |
| D | 2432 | 2432 | 1 | 1 | 0.04% | 0.04% | 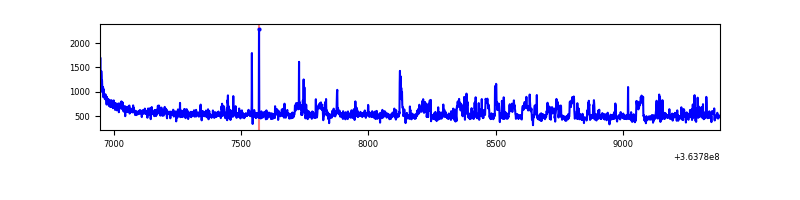 |
Top three noisy pixels from each quadrant. If the there are fewer than three noisy pixels in the level2.evt file, extra rows are filled as -1
| Pixel properties | Quadrant properties | ||||||
|---|---|---|---|---|---|---|---|
| Quadrant | DetID | PixID | Counts | Sigma | Mean | Median | Sigma |
| A | 13 | 254 | 4840 | 64.67 | 344 | 338 | 69.6 |
| A | 3 | 137 | 3222 | 41.43 | 344 | 338 | 69.6 |
| A | 0 | 226 | 2997 | 38.2 | 344 | 338 | 69.6 |
| B | 6 | 159 | 633199 | 9785.51 | 333 | 325 | 64.7 |
| B | 4 | 80 | 39145 | 600.24 | 333 | 325 | 64.7 |
| B | 12 | 111 | 7334 | 108.37 | 333 | 325 | 64.7 |
| C | 3 | 233 | 1212361 | 17117.08 | 304 | 307 | 70.8 |
| C | 0 | 10 | 68892 | 968.58 | 304 | 307 | 70.8 |
| C | 14 | 238 | 53475 | 750.86 | 304 | 307 | 70.8 |
| D | 8 | 195 | 114363 | 1396.5 | 328 | 321 | 81.7 |
| D | 12 | 233 | 17710 | 212.94 | 328 | 321 | 81.7 |
| D | 12 | 218 | 16866 | 202.6 | 328 | 321 | 81.7 |
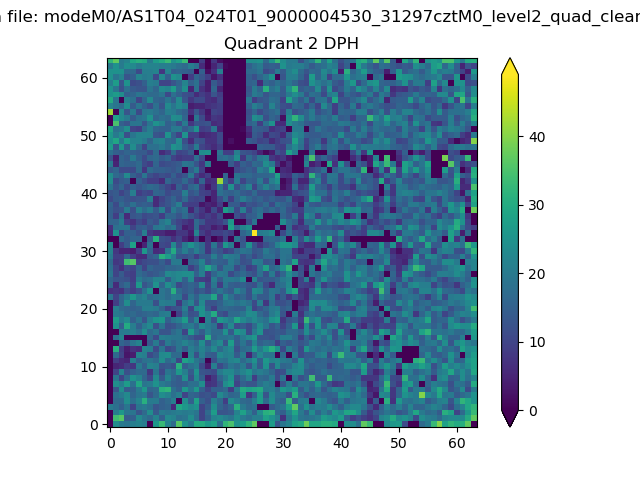
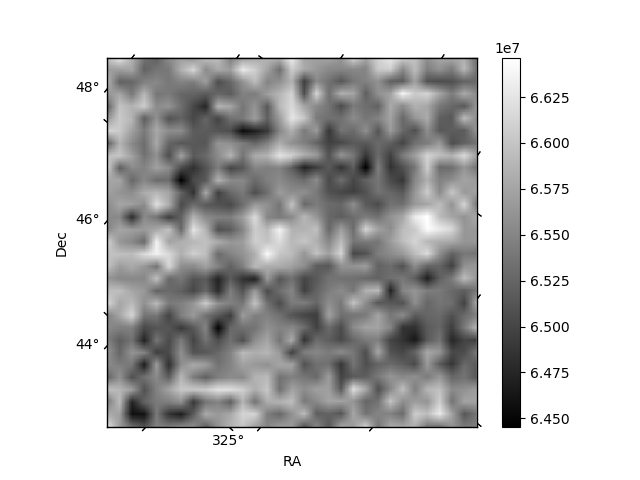
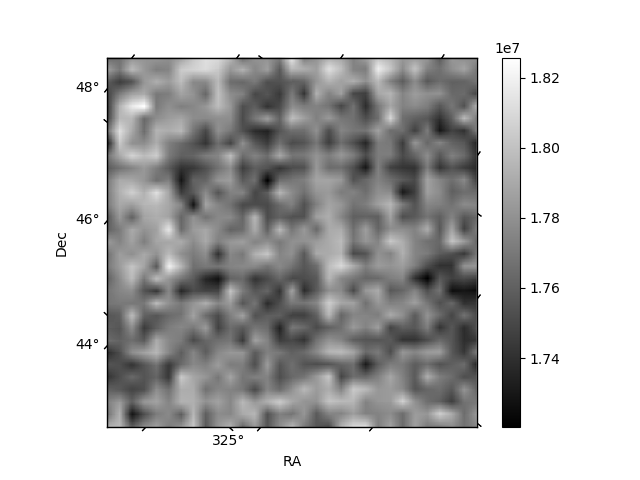
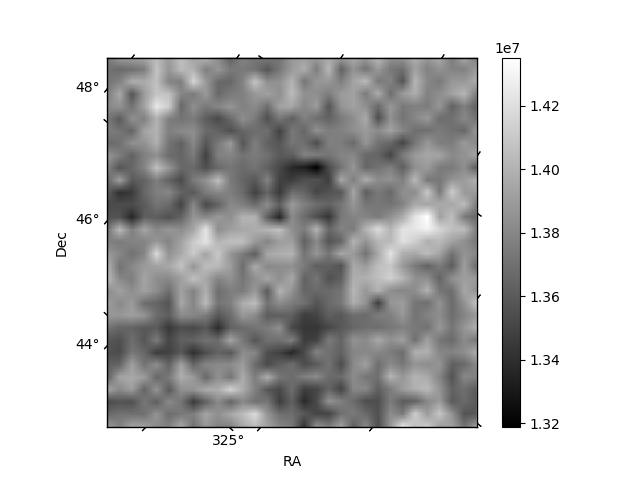
Histogram calculated using DETX and DETY for each event in the final _common_clean file
| Quadrant A | 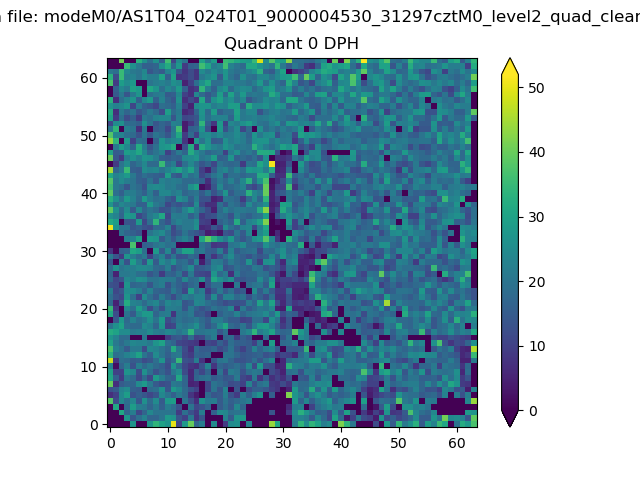 |
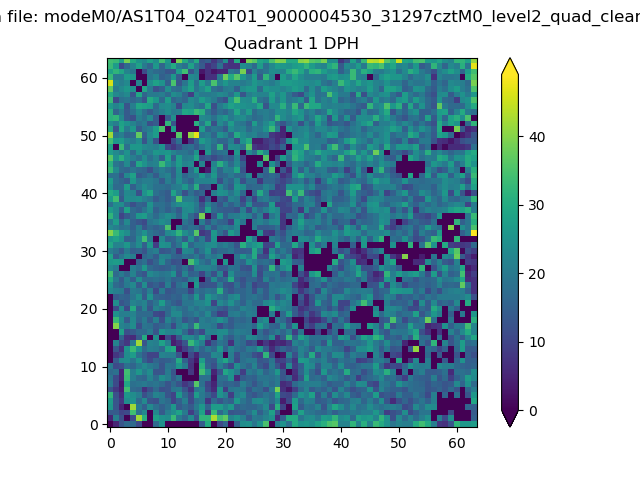 |
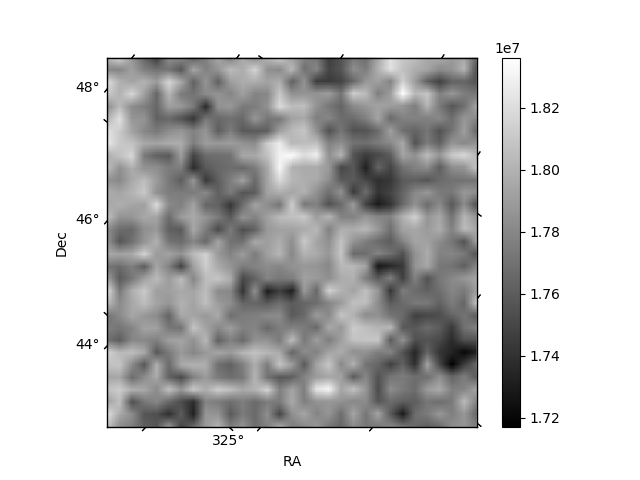
Quadrant B |
|---|---|---|---|
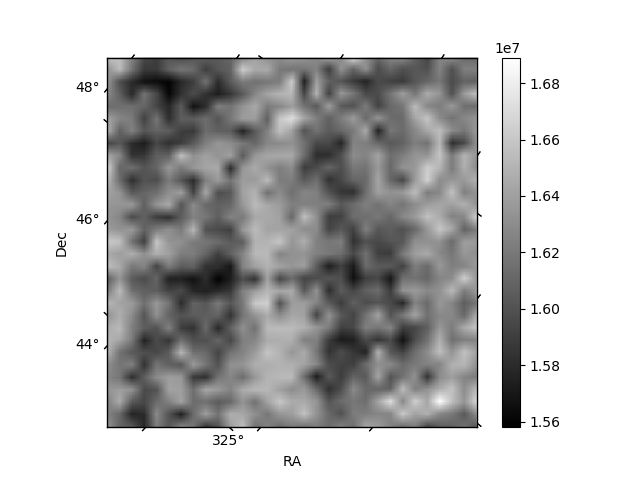
| Quadrant D | 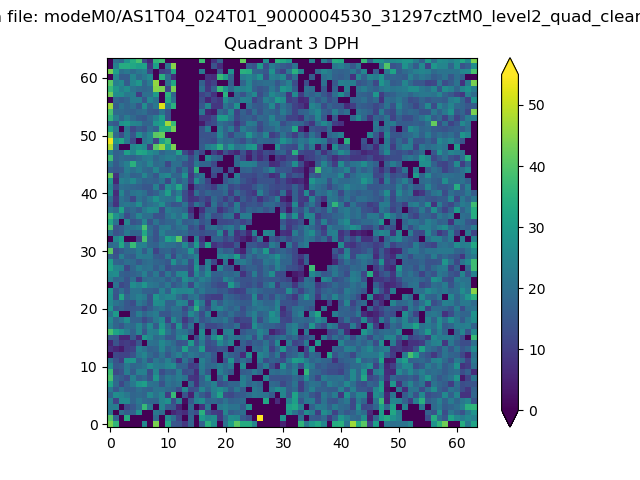 |
 |
Quadrant C |
| Plot type | Count rate plots | Images |
|---|---|---|
| Comparison with Poisson distribution Blue bars denote a histogram of data divided into 1 sec bins. Red curve is a Poisson curve with rate = median count rate of data. |
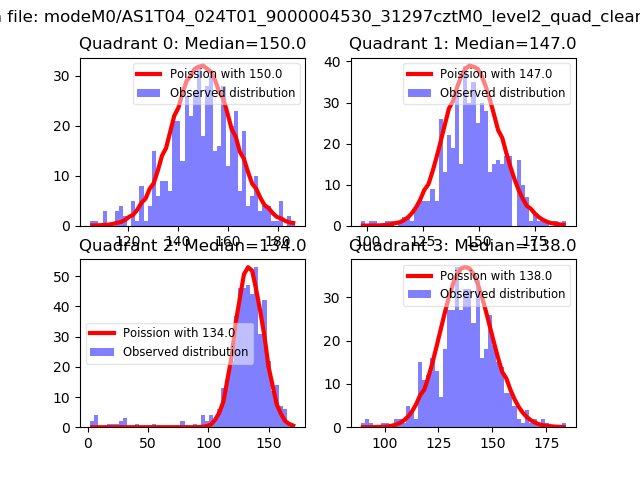 |
 |
| Quadrant-wise count rates Data is divided into 100 sec bins |
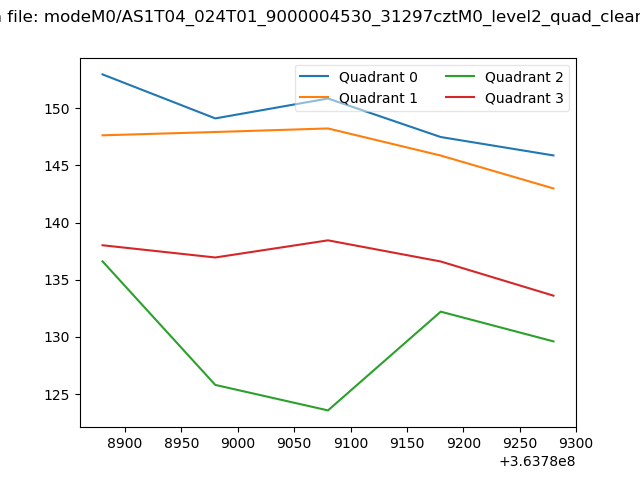 |
|
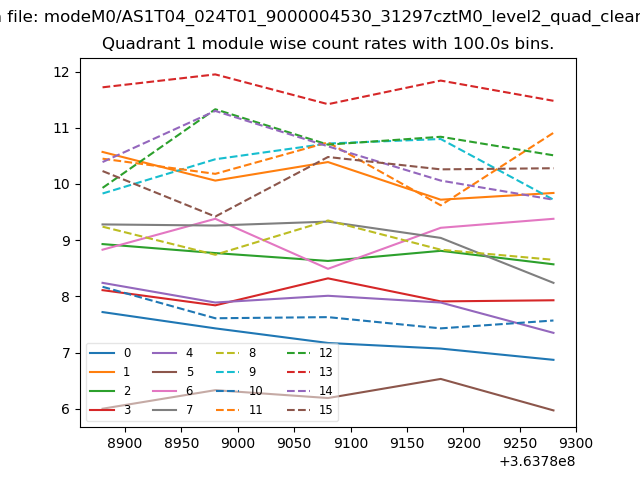
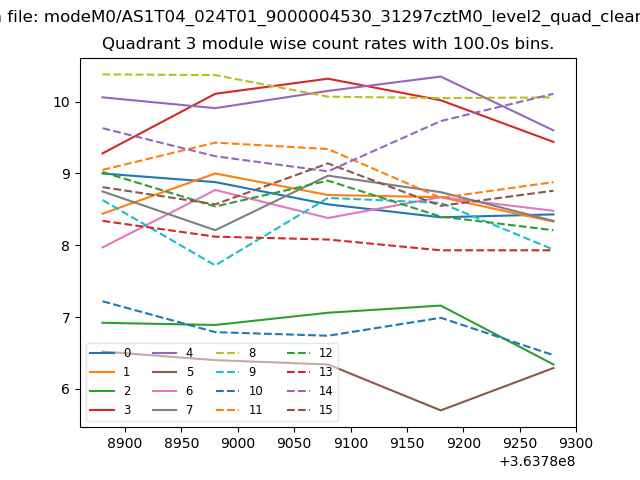
| Module-wise count rates for Quadrant A Data is divided into 100 sec bins |
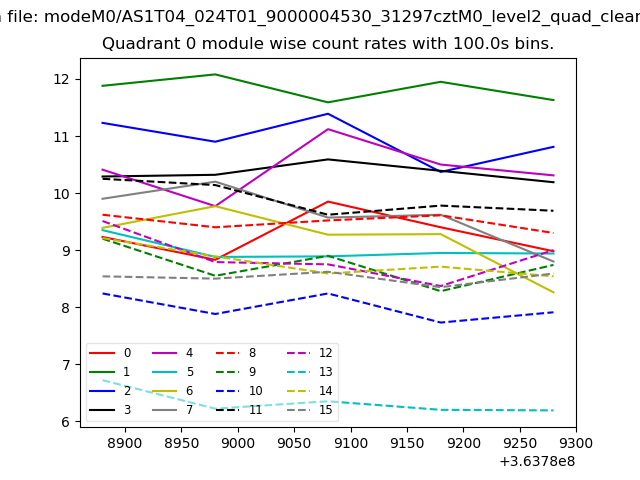 |
 |
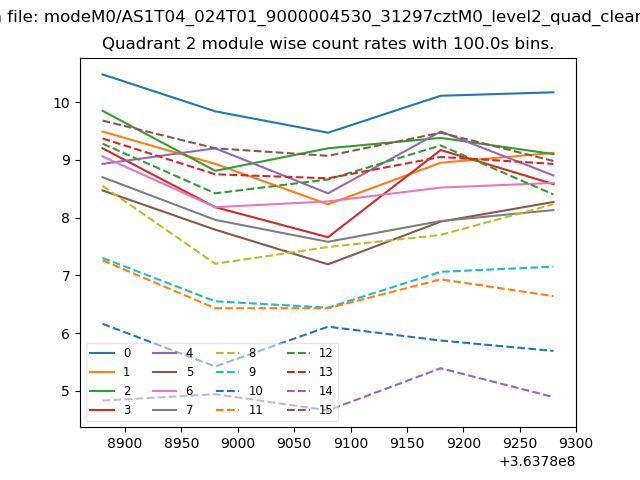
| Module-wise count rates for Quadrant B Data is divided into 100 sec bins |
 |
 |
| Module-wise count rates for Quadrant C Data is divided into 100 sec bins |
 |
 |
| Module-wise count rates for Quadrant D Data is divided into 100 sec bins |
 |
 |
| Parameter | Plot |
|---|---|
| CZT HV Monitor |  |
| D_VDD | 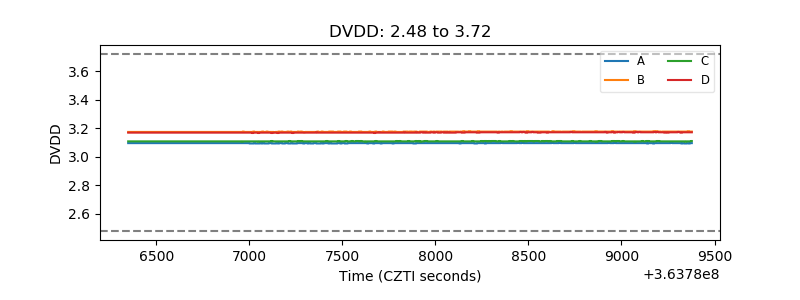 |
| Temperature 1 | 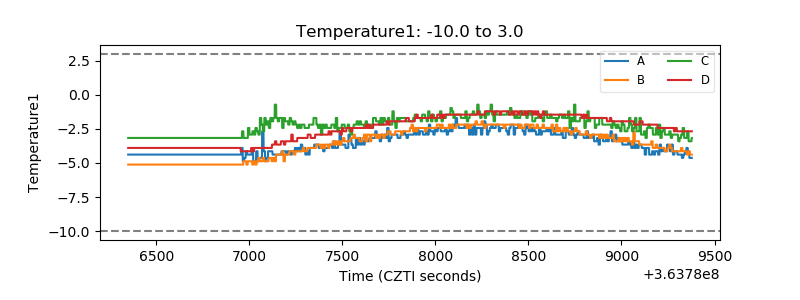 |
| Veto HV Monitor | 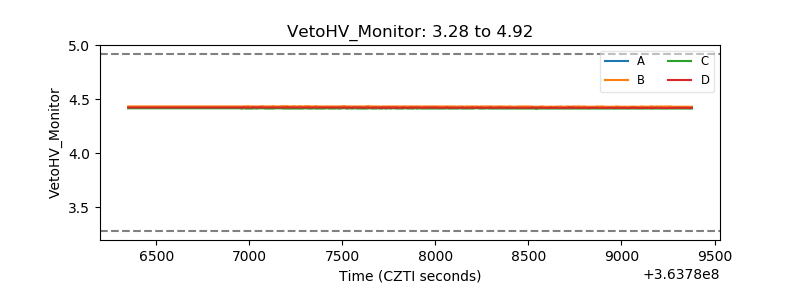 |
| Veto LLD | 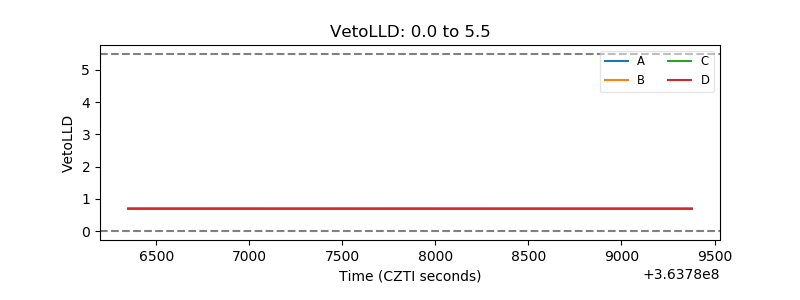 |
| Alpha Counter | 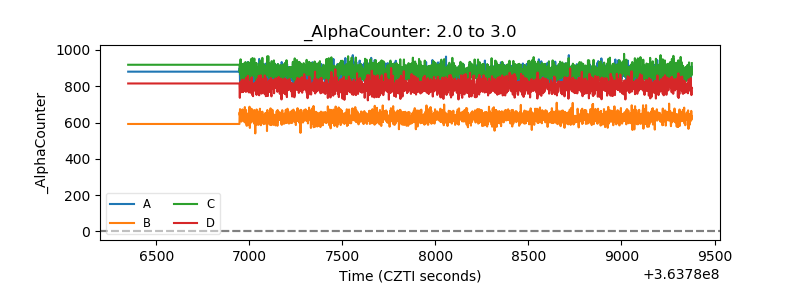 |
| _CPM_Rate | 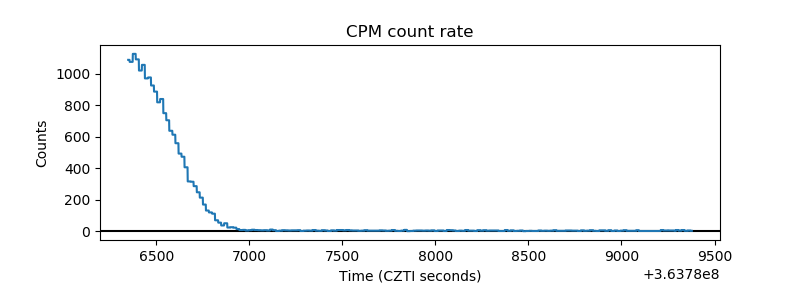 |
| CZT Counter | 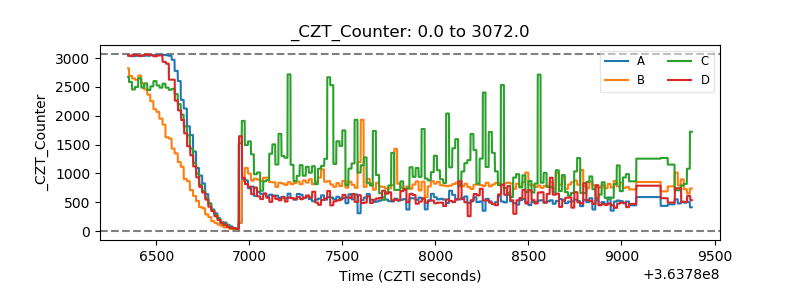 |
| +2.5 Volts monitor |  |
| +5 Volts monitor |  |
| _ROLL_ROT | 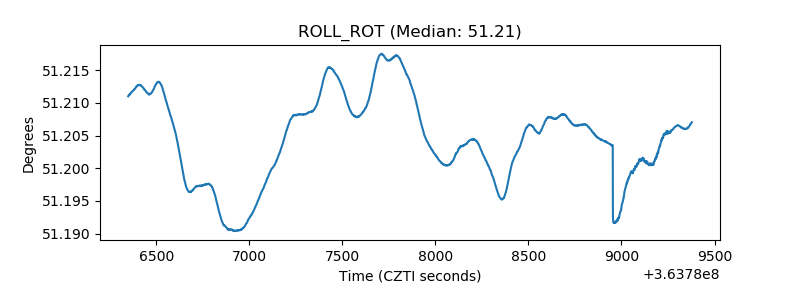 |
| _Roll_DEC | 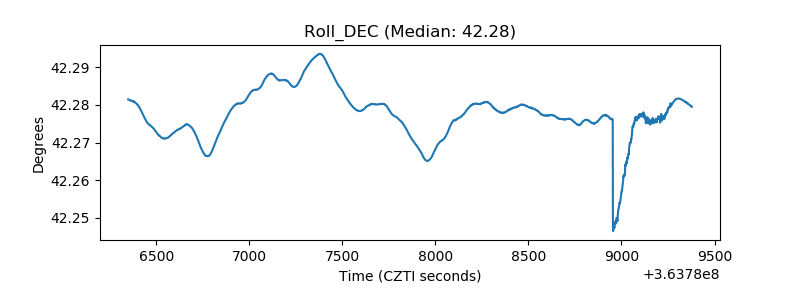 |
| _Roll_RA | 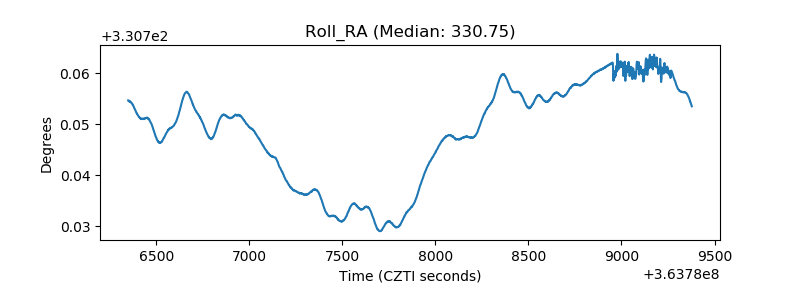 |
| Veto Counter |  |