| Param | Original file | Final file |
|---|---|---|
| Filename | modeM0/AS1A10_058T08_9000004532cztM0_level2.fits | modeM0/AS1A10_058T08_9000004532cztM0_level2_quad_clean.evt |
| Size (bytes) | 782,363,520 | 576,662,400 |
| Size | 746.1 MB | 549.9 MB |
| Events in quadrant A | 5,008,376 | 3,263,754 |
| Events in quadrant B | 4,586,746 | 3,186,007 |
| Events in quadrant C | 4,601,272 | 2,918,819 |
| Events in quadrant D | 4,238,386 | 2,835,811 |
| Mode M0 | |||
|---|---|---|---|
| Quadrant | BADHDUFLAG | Total packets | Discarded packets |
| A | 0 | 160550 | 0 |
| B | 0 | 237870 | 0 |
| C | 0 | 222291 | 0 |
| D | 0 | 180097 | 0 |
| Mode M9 | |||
|---|---|---|---|
| Quadrant | BADHDUFLAG | Total packets | Discarded packets |
| A | 0 | 123 | 0 |
| B | 0 | 123 | 0 |
| C | 0 | 123 | 0 |
| D | 0 | 123 | 0 |
| Mode SS | |||
|---|---|---|---|
| Quadrant | BADHDUFLAG | Total packets | Discarded packets |
| A | 0 | 1562 | 0 |
| B | 0 | 1562 | 0 |
| C | 0 | 1562 | 0 |
| D | 0 | 1562 | 0 |
| Quadrant | Total seconds | Saturated seconds | Saturation percentage |
|---|---|---|---|
| A | 76676 | 842 | 1.098127% |
| B | 76676 | 2288 | 2.983985% |
| C | 76676 | 5506 | 7.180865% |
| D | 76676 | 1388 | 1.810214% |
Noise dominated data is calculated using 1-second bins in cleaned event files. If a bin has >2000 counts, and if more than 50% of those come from <1% of pixels, then it is considered to be noise-dominated and hence unusable.
| Quadrant | # 1 sec bins | Bins with >0 counts | Bins with >2000 counts | High rate bins dominated by noise | Noise dominated (total time) | Noise dominated (detector-on time) | Marked lightcurve |
|---|---|---|---|---|---|---|---|
| A | 88972 | 76676 | 0 | 0 | 0.00% | 0.00% |  |
| B | 88972 | 76674 | 0 | 0 | 0.00% | 0.00% |  |
| C | 88972 | 76638 | 0 | 0 | 0.00% | 0.00% |  |
| D | 88972 | 76657 | 0 | 0 | 0.00% | 0.00% |  |
Top three noisy pixels from each quadrant. If the there are fewer than three noisy pixels in the level2.evt file, extra rows are filled as -1
| Pixel properties | Quadrant properties | ||||||
|---|---|---|---|---|---|---|---|
| Quadrant | DetID | PixID | Counts | Sigma | Mean | Median | Sigma |
| A | 0 | 29 | 4892 | 11.49 | 1305 | 1226 | 319.0 |
| A | 0 | 30 | 3915 | 8.43 | 1305 | 1226 | 319.0 |
| A | 7 | 110 | 3891 | 8.35 | 1305 | 1226 | 319.0 |
| B | 2 | 9 | 3697 | 10.66 | 1214 | 1162 | 237.9 |
| B | 3 | 80 | 3139 | 8.31 | 1214 | 1162 | 237.9 |
| B | 5 | 225 | 3053 | 7.95 | 1214 | 1162 | 237.9 |
| C | 12 | 241 | 3184 | 6.64 | 1218 | 1141 | 307.6 |
| C | 9 | 209 | 3105 | 6.39 | 1218 | 1141 | 307.6 |
| C | 3 | 187 | 3077 | 6.29 | 1218 | 1141 | 307.6 |
| D | 7 | 3 | 2952 | 5.84 | 1210 | 1107 | 315.8 |
| D | 10 | 189 | 2948 | 5.83 | 1210 | 1107 | 315.8 |
| D | 6 | 231 | 2896 | 5.67 | 1210 | 1107 | 315.8 |
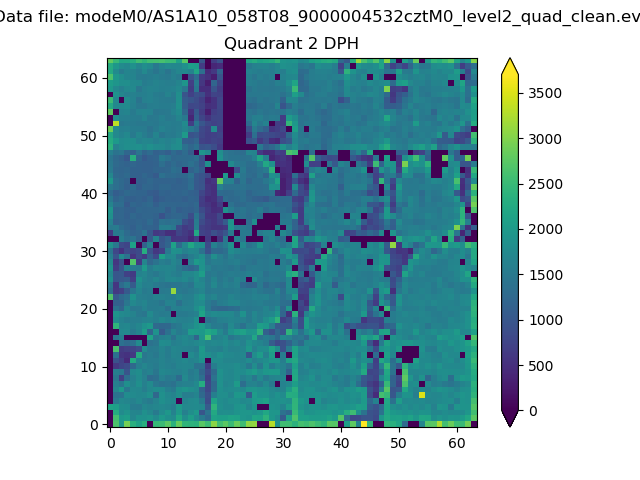
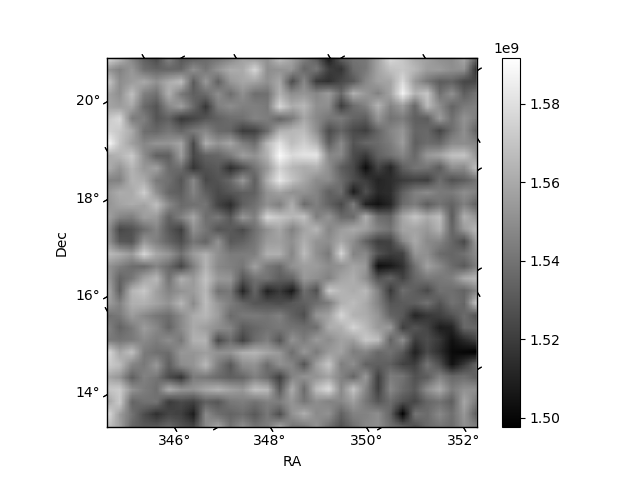
Histogram calculated using DETX and DETY for each event in the final _common_clean file
| Quadrant A | 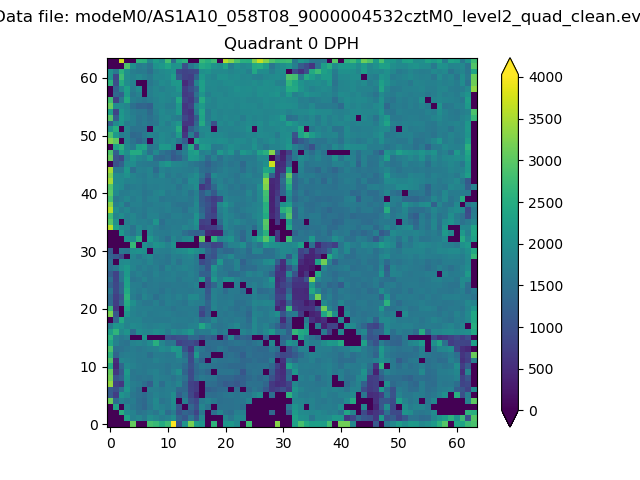 |
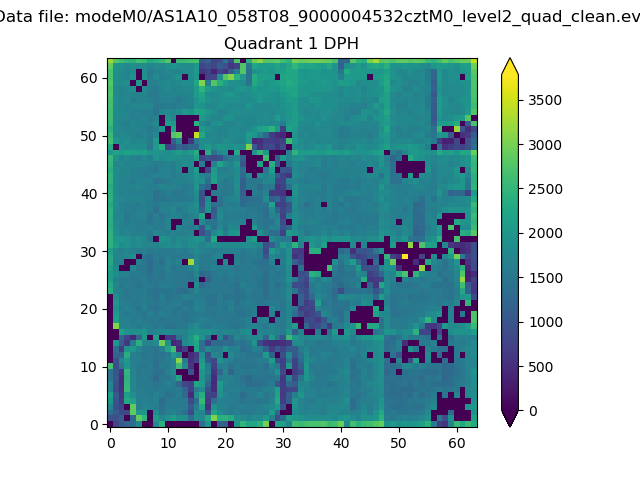 |
Quadrant B |
|---|---|---|---|
| Quadrant D | 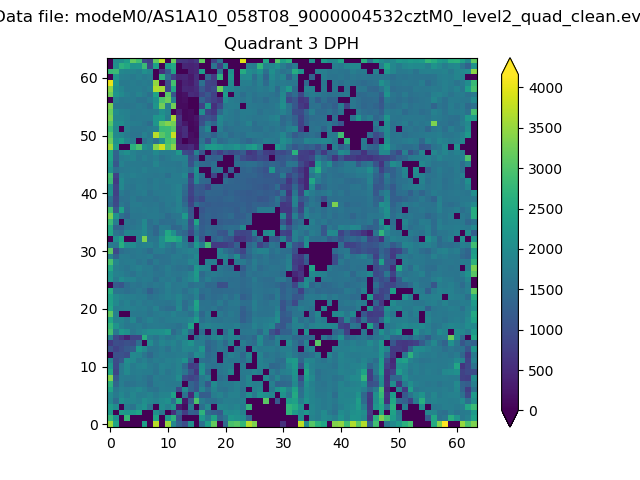 |
 |
Quadrant C |
| Plot type | Count rate plots | Images |
|---|---|---|
| Comparison with Poisson distribution Blue bars denote a histogram of data divided into 1 sec bins. Red curve is a Poisson curve with rate = median count rate of data. |
 |
 |
| Quadrant-wise count rates Data is divided into 100 sec bins |
 |
|
| Module-wise count rates for Quadrant A Data is divided into 100 sec bins |
 |
 |
| Module-wise count rates for Quadrant B Data is divided into 100 sec bins |
 |
 |
| Module-wise count rates for Quadrant C Data is divided into 100 sec bins |
 |
 |
| Module-wise count rates for Quadrant D Data is divided into 100 sec bins |
 |
 |
| Parameter | Plot |
|---|---|
| CZT HV Monitor |  |
| D_VDD | 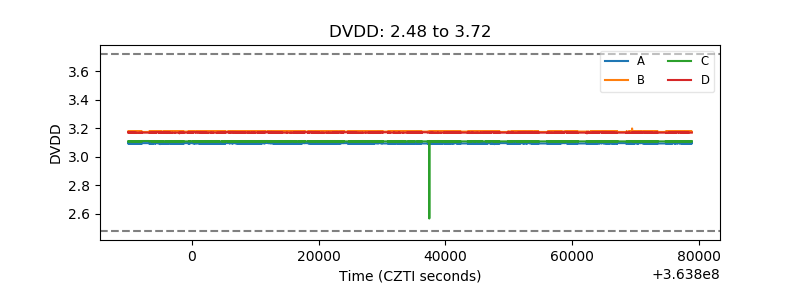 |
| Temperature 1 |  |
| Veto HV Monitor |  |
| Veto LLD |  |
| Alpha Counter |  |
| _CPM_Rate |  |
| CZT Counter |  |
| +2.5 Volts monitor |  |
| +5 Volts monitor |  |
| _ROLL_ROT |  |
| _Roll_DEC |  |
| _Roll_RA |  |
| Veto Counter |  |