| Param | Original file | Final file |
|---|---|---|
| Filename | modeM0/AS1A10_058T08_9000004532_31297cztM0_level2.evt | modeM0/AS1A10_058T08_9000004532_31297cztM0_level2_quad_clean.evt |
| Size (bytes) | 395,265,600 | 49,403,520 |
| Size | 377.0 MB | 47.1 MB |
| Events in quadrant A | 1,952,587 | 325,301 |
| Events in quadrant B | 3,471,989 | 307,583 |
| Events in quadrant C | 4,105,728 | 292,201 |
| Events in quadrant D | 2,189,605 | 309,548 |
| Mode M0 | |||
|---|---|---|---|
| Quadrant | BADHDUFLAG | Total packets | Discarded packets |
| A | 0 | 7907 | 1 |
| B | 0 | 12781 | 1 |
| C | 0 | 14831 | 1 |
| D | 0 | 8741 | 1 |
| Mode M9 | |||
|---|---|---|---|
| Quadrant | BADHDUFLAG | Total packets | Discarded packets |
| A | 0 | 11 | 0 |
| B | 0 | 11 | 0 |
| C | 0 | 11 | 0 |
| D | 0 | 11 | 0 |
| Mode SS | |||
|---|---|---|---|
| Quadrant | BADHDUFLAG | Total packets | Discarded packets |
| A | 0 | 76 | 0 |
| B | 0 | 76 | 0 |
| C | 0 | 76 | 0 |
| D | 0 | 76 | 0 |
| Quadrant | Total seconds | Saturated seconds | Saturation percentage |
|---|---|---|---|
| A | 3686 | 112 | 3.038524% |
| B | 3686 | 386 | 10.472056% |
| C | 3686 | 703 | 19.072165% |
| D | 3686 | 136 | 3.689636% |
Noise dominated data is calculated using 1-second bins in cleaned event files. If a bin has >2000 counts, and if more than 50% of those come from <1% of pixels, then it is considered to be noise-dominated and hence unusable.
| Quadrant | # 1 sec bins | Bins with >0 counts | Bins with >2000 counts | High rate bins dominated by noise | Noise dominated (total time) | Noise dominated (detector-on time) | Marked lightcurve |
|---|---|---|---|---|---|---|---|
| A | 4761 | 3687 | 0 | 0 | 0.00% | 0.00% | 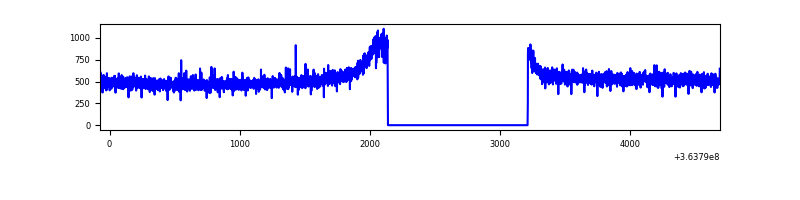 |
| B | 4761 | 3687 | 130 | 130 | 2.73% | 3.53% | 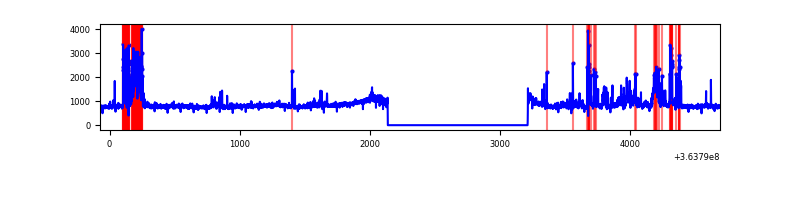 |
| C | 4761 | 3687 | 159 | 159 | 3.34% | 4.31% | 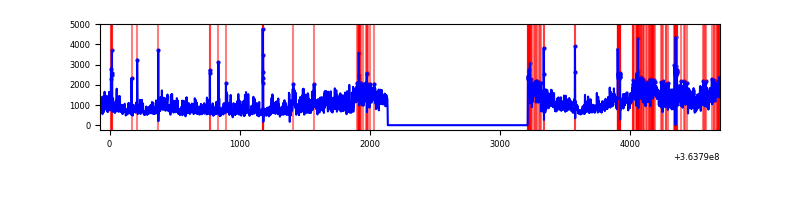 |
| D | 4761 | 3687 | 18 | 18 | 0.38% | 0.49% | 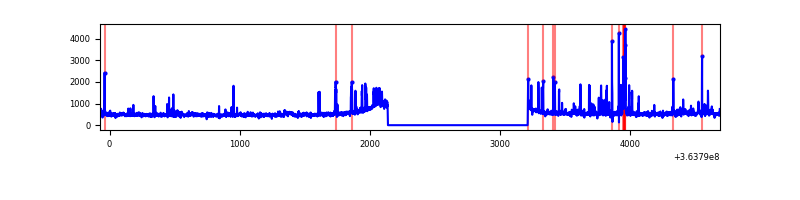 |
Top three noisy pixels from each quadrant. If the there are fewer than three noisy pixels in the level2.evt file, extra rows are filled as -1
| Pixel properties | Quadrant properties | ||||||
|---|---|---|---|---|---|---|---|
| Quadrant | DetID | PixID | Counts | Sigma | Mean | Median | Sigma |
| A | 13 | 254 | 7156 | 64.87 | 505 | 496 | 102.7 |
| A | 3 | 137 | 5181 | 45.64 | 505 | 496 | 102.7 |
| A | 0 | 226 | 4171 | 35.8 | 505 | 496 | 102.7 |
| B | 6 | 159 | 960172 | 10170.84 | 480 | 468 | 94.4 |
| B | 4 | 80 | 576009 | 6099.52 | 480 | 468 | 94.4 |
| B | 0 | 230 | 20898 | 216.51 | 480 | 468 | 94.4 |
| C | 3 | 233 | 2177459 | 20301.94 | 452 | 454 | 107.2 |
| C | 14 | 238 | 85322 | 791.45 | 452 | 454 | 107.2 |
| C | 0 | 10 | 53096 | 490.92 | 452 | 454 | 107.2 |
| D | 8 | 195 | 220832 | 1856.51 | 488 | 475 | 118.7 |
| D | 2 | 250 | 82980 | 695.11 | 488 | 475 | 118.7 |
| D | 2 | 153 | 16361 | 133.84 | 488 | 475 | 118.7 |
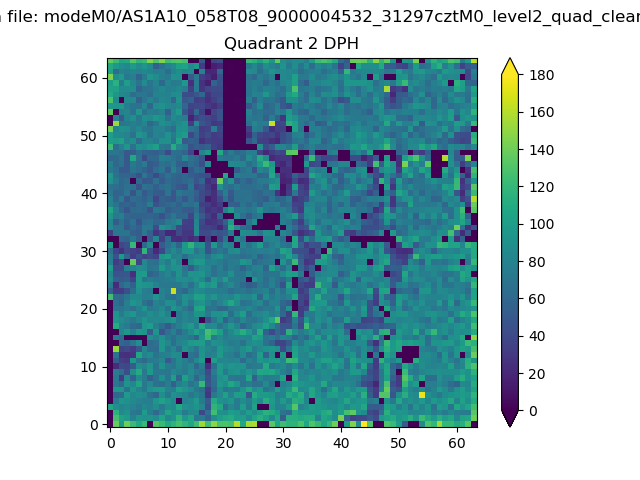
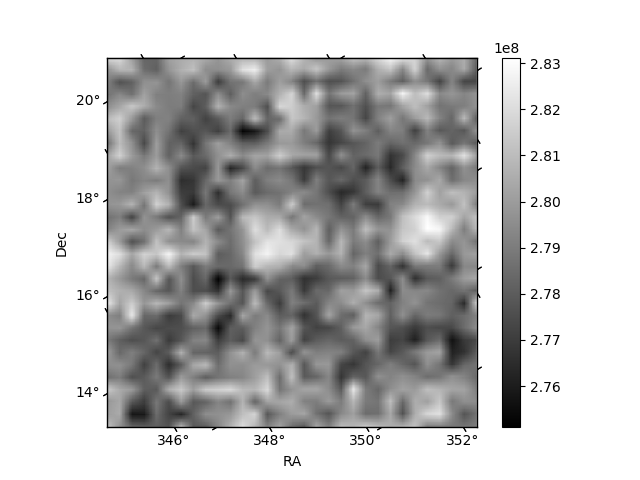
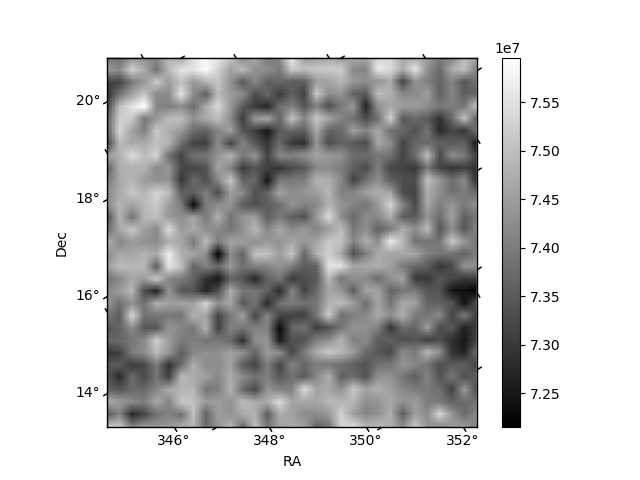
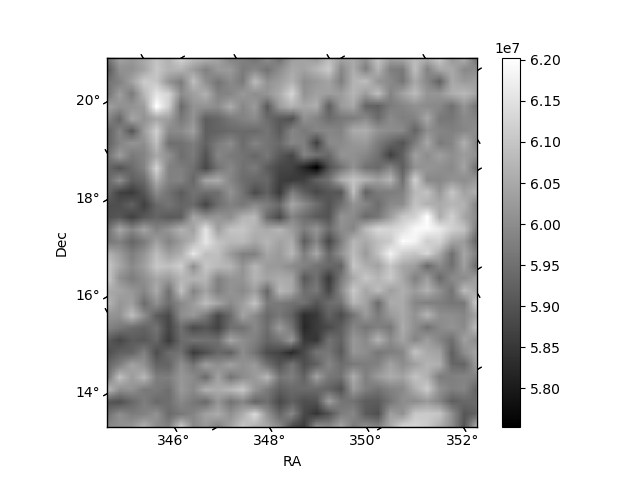
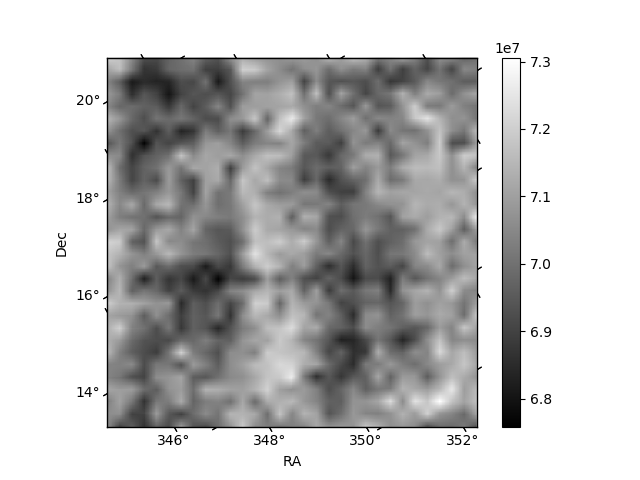
Histogram calculated using DETX and DETY for each event in the final _common_clean file
| Quadrant A | 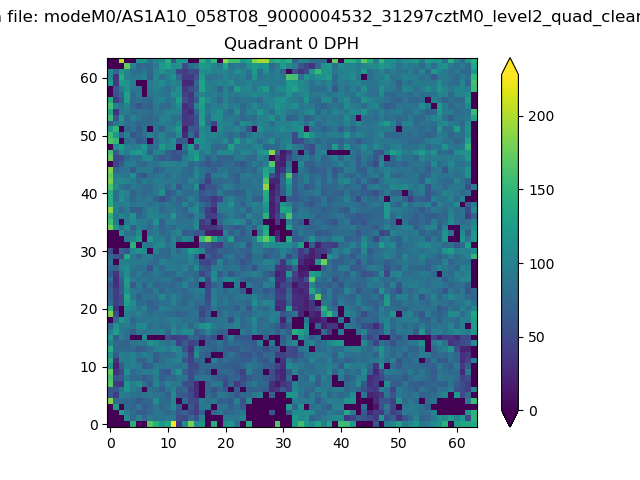 |
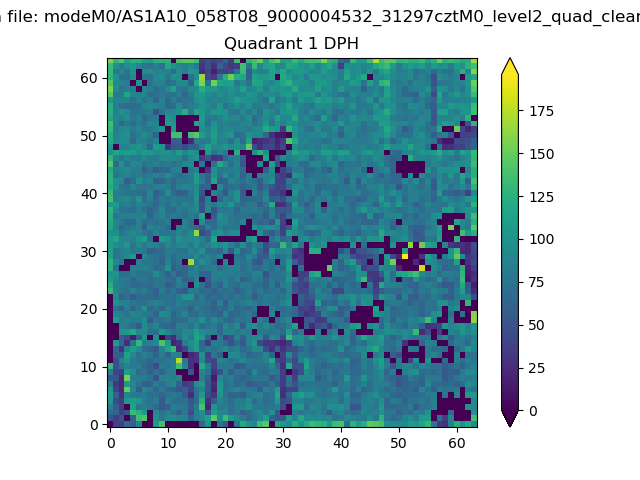 |
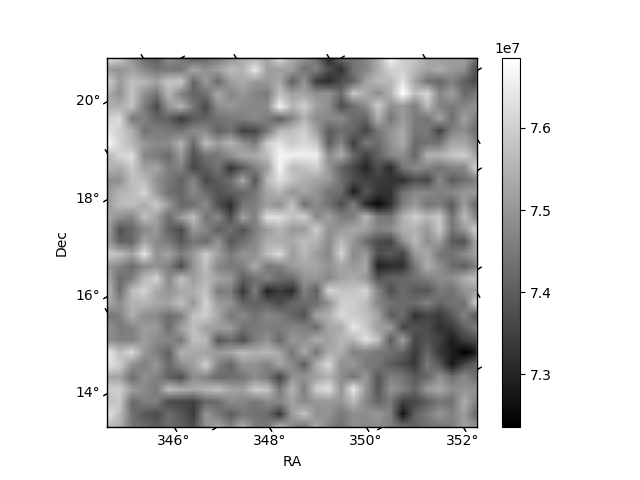
Quadrant B |
|---|---|---|---|
| Quadrant D | 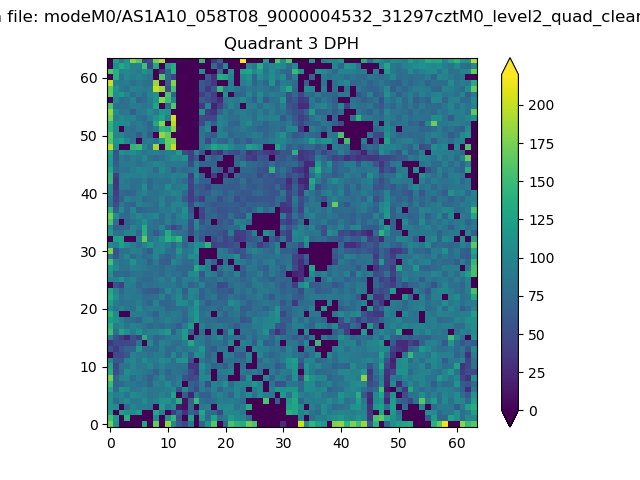 |
 |
Quadrant C |
| Plot type | Count rate plots | Images |
|---|---|---|
| Comparison with Poisson distribution Blue bars denote a histogram of data divided into 1 sec bins. Red curve is a Poisson curve with rate = median count rate of data. |
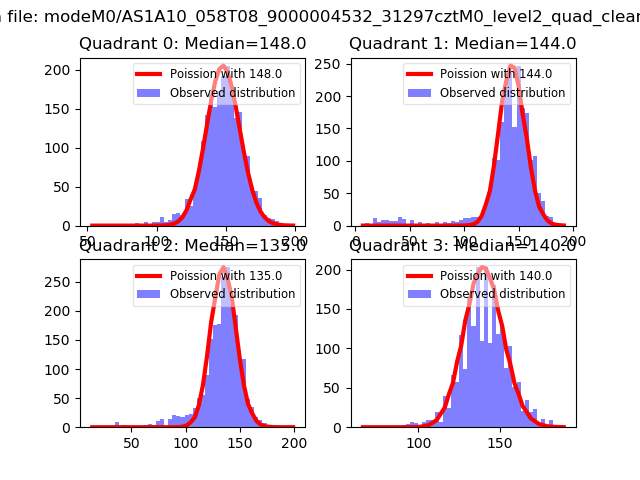 |
 |
| Quadrant-wise count rates Data is divided into 100 sec bins |
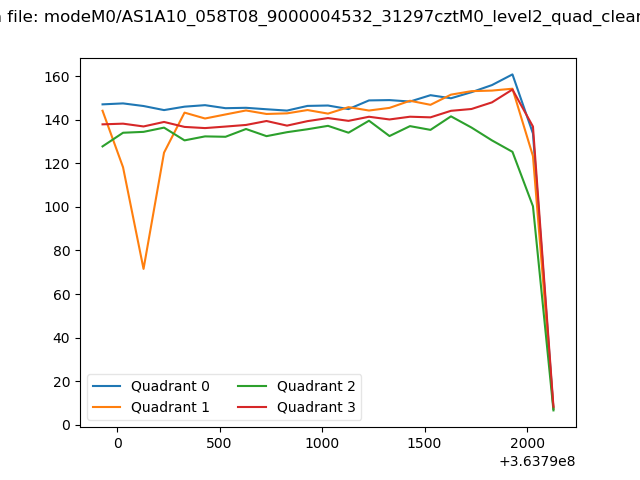 |
|
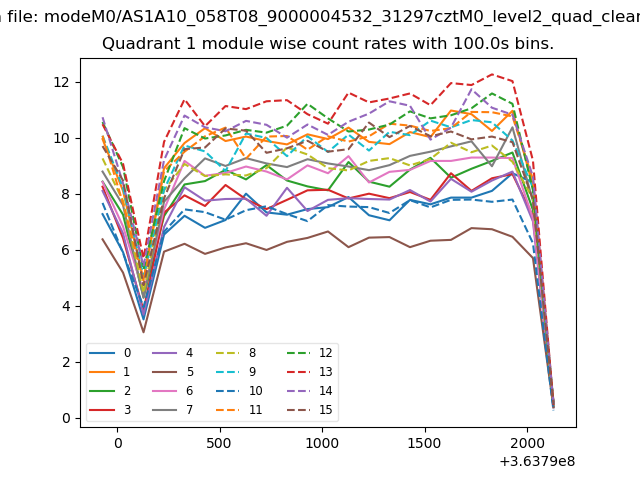
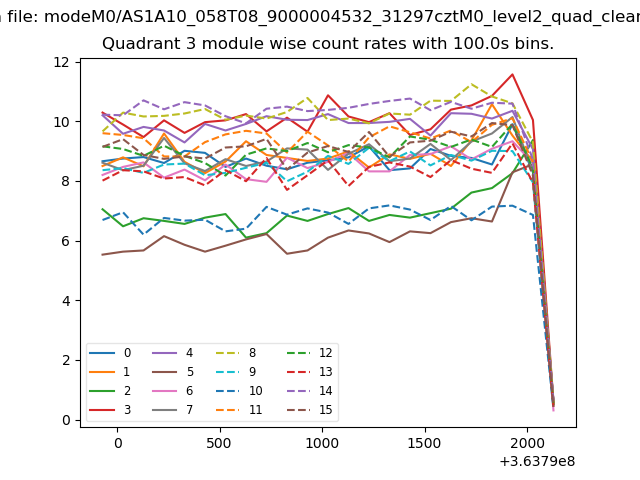
| Module-wise count rates for Quadrant A Data is divided into 100 sec bins |
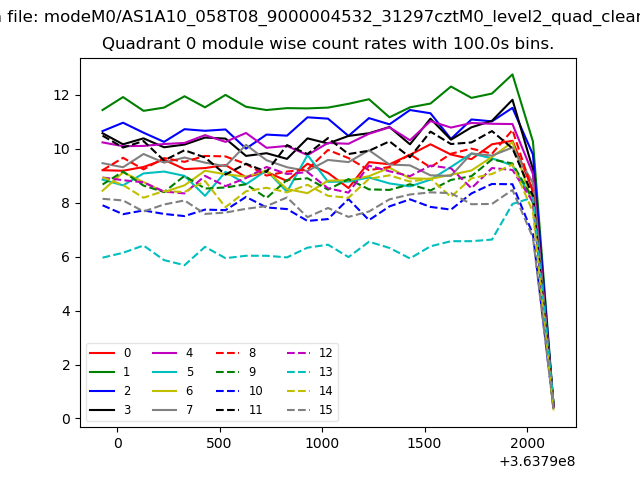 |
 |
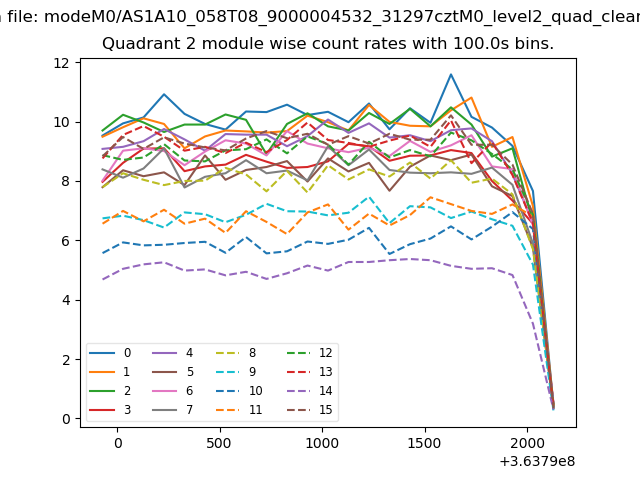
| Module-wise count rates for Quadrant B Data is divided into 100 sec bins |
 |
 |
| Module-wise count rates for Quadrant C Data is divided into 100 sec bins |
 |
 |
| Module-wise count rates for Quadrant D Data is divided into 100 sec bins |
 |
 |
| Parameter | Plot |
|---|---|
| CZT HV Monitor | 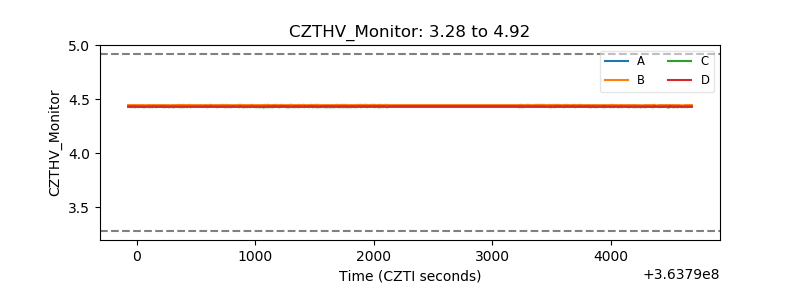 |
| D_VDD | 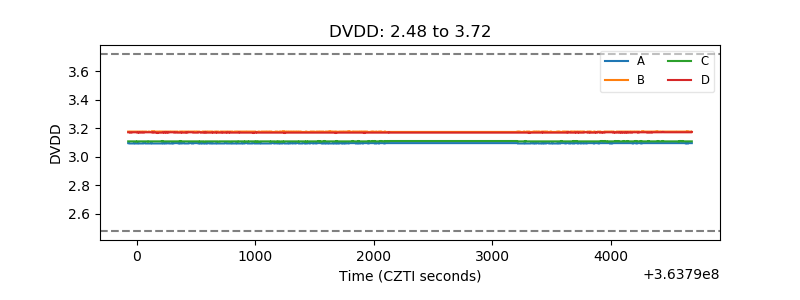 |
| Temperature 1 | 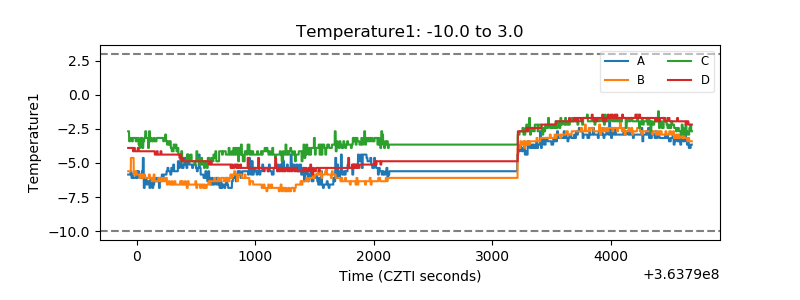 |
| Veto HV Monitor | 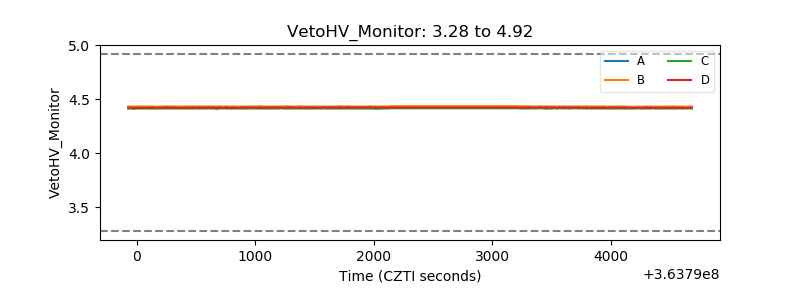 |
| Veto LLD |  |
| Alpha Counter | 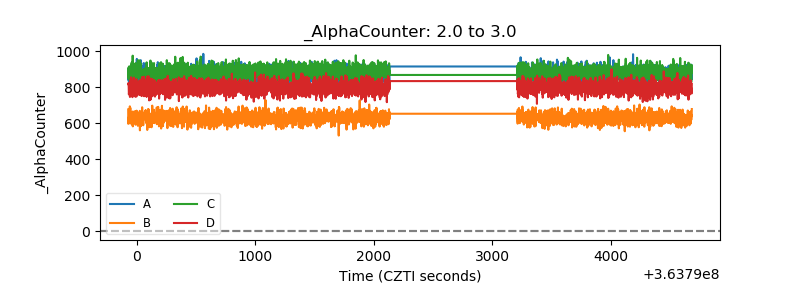 |
| _CPM_Rate | 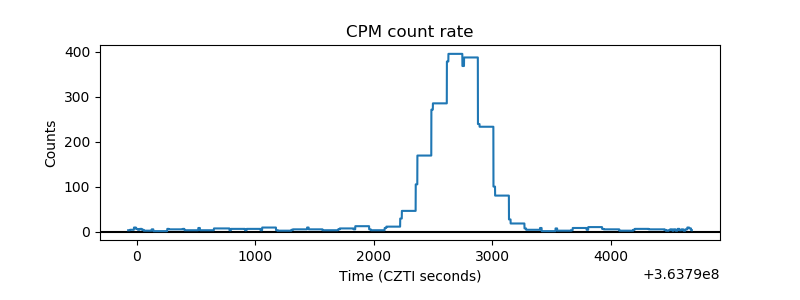 |
| CZT Counter | 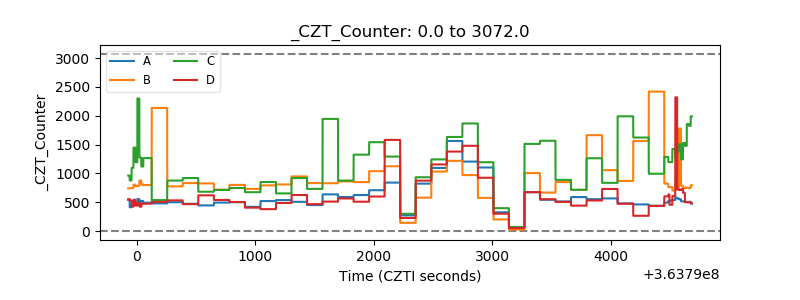 |
| +2.5 Volts monitor |  |
| +5 Volts monitor | 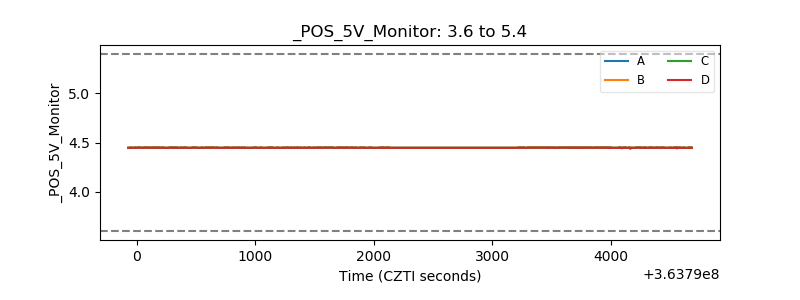 |
| _ROLL_ROT | 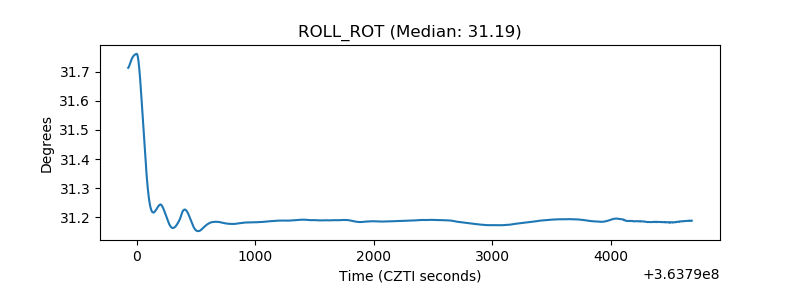 |
| _Roll_DEC | 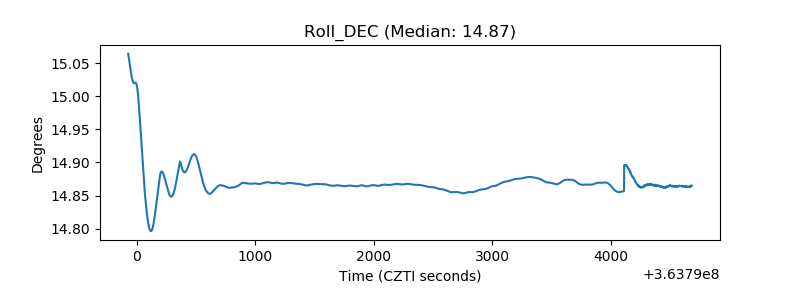 |
| _Roll_RA | 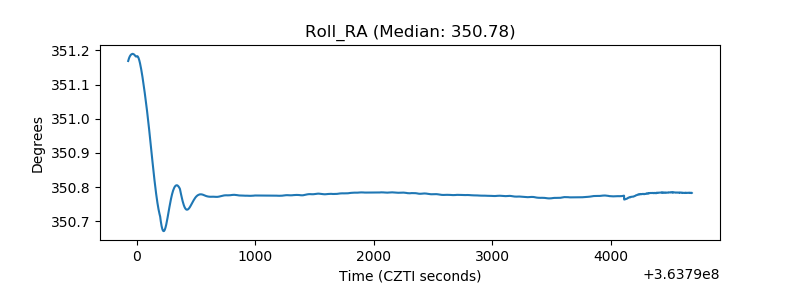 |
| Veto Counter | 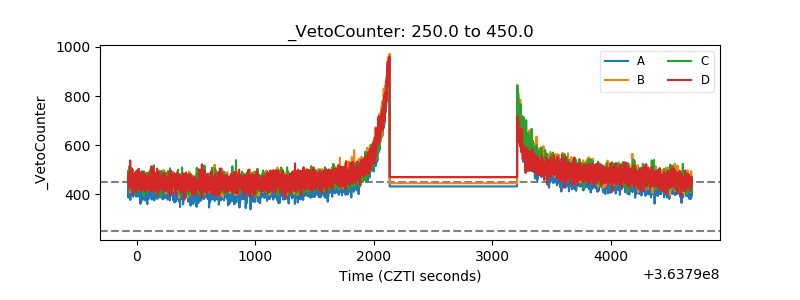 |