| Param | Original file | Final file |
|---|---|---|
| Filename | modeM0/AS1A10_058T08_9000004532_31298cztM0_level2.evt | modeM0/AS1A10_058T08_9000004532_31298cztM0_level2_quad_clean.evt |
| Size (bytes) | 726,387,840 | 76,936,320 |
| Size | 692.7 MB | 73.4 MB |
| Events in quadrant A | 3,508,702 | 485,000 |
| Events in quadrant B | 5,796,787 | 476,818 |
| Events in quadrant C | 8,206,855 | 423,673 |
| Events in quadrant D | 4,020,366 | 462,661 |
| Mode M0 | |||
|---|---|---|---|
| Quadrant | BADHDUFLAG | Total packets | Discarded packets |
| A | 0 | 14469 | 2 |
| B | 0 | 22049 | 2 |
| C | 0 | 29279 | 2 |
| D | 0 | 16323 | 3 |
| Mode M9 | |||
|---|---|---|---|
| Quadrant | BADHDUFLAG | Total packets | Discarded packets |
| A | 0 | 13 | 0 |
| B | 0 | 14 | 0 |
| C | 0 | 14 | 0 |
| D | 0 | 14 | 0 |
| Mode SS | |||
|---|---|---|---|
| Quadrant | BADHDUFLAG | Total packets | Discarded packets |
| A | 0 | 140 | 0 |
| B | 0 | 140 | 0 |
| C | 0 | 140 | 0 |
| D | 0 | 140 | 0 |
| Quadrant | Total seconds | Saturated seconds | Saturation percentage |
|---|---|---|---|
| A | 6907 | 109 | 1.578109% |
| B | 6907 | 312 | 4.517157% |
| C | 6907 | 1372 | 19.863906% |
| D | 6906 | 175 | 2.534028% |
Noise dominated data is calculated using 1-second bins in cleaned event files. If a bin has >2000 counts, and if more than 50% of those come from <1% of pixels, then it is considered to be noise-dominated and hence unusable.
| Quadrant | # 1 sec bins | Bins with >0 counts | Bins with >2000 counts | High rate bins dominated by noise | Noise dominated (total time) | Noise dominated (detector-on time) | Marked lightcurve |
|---|---|---|---|---|---|---|---|
| A | 7592 | 6908 | 0 | 0 | 0.00% | 0.00% | 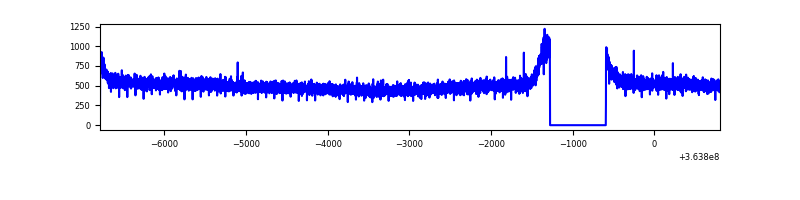 |
| B | 7592 | 6908 | 59 | 59 | 0.78% | 0.85% | 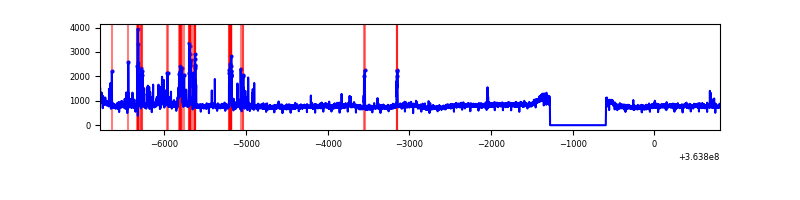 |
| C | 7592 | 6908 | 349 | 349 | 4.60% | 5.05% | 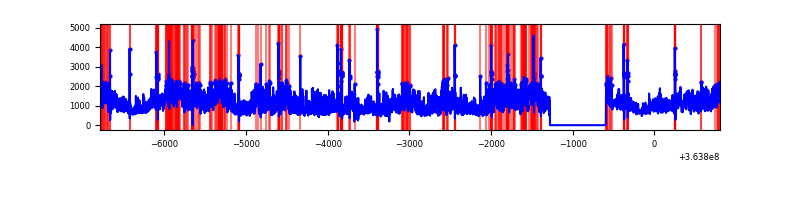 |
| D | 7591 | 6907 | 55 | 55 | 0.72% | 0.80% | 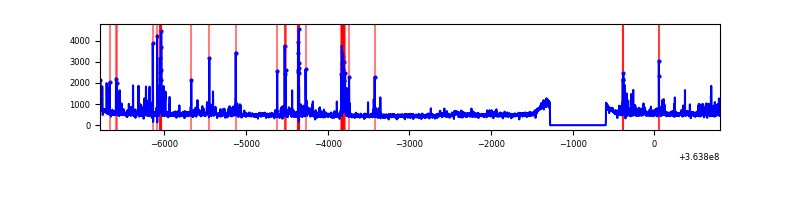 |
Top three noisy pixels from each quadrant. If the there are fewer than three noisy pixels in the level2.evt file, extra rows are filled as -1
| Pixel properties | Quadrant properties | ||||||
|---|---|---|---|---|---|---|---|
| Quadrant | DetID | PixID | Counts | Sigma | Mean | Median | Sigma |
| A | 13 | 254 | 13630 | 69.66 | 909 | 891 | 182.9 |
| A | 3 | 137 | 9347 | 46.24 | 909 | 891 | 182.9 |
| A | 0 | 226 | 7635 | 36.88 | 909 | 891 | 182.9 |
| B | 6 | 159 | 1886375 | 10987.32 | 883 | 862 | 171.6 |
| B | 4 | 80 | 381877 | 2220.26 | 883 | 862 | 171.6 |
| B | 12 | 18 | 30256 | 171.29 | 883 | 862 | 171.6 |
| C | 3 | 233 | 4643996 | 24587.15 | 806 | 811 | 188.8 |
| C | 14 | 238 | 173904 | 916.58 | 806 | 811 | 188.8 |
| C | 0 | 10 | 169958 | 895.69 | 806 | 811 | 188.8 |
| D | 8 | 195 | 364825 | 1597.32 | 872 | 853 | 227.9 |
| D | 2 | 250 | 254159 | 1111.65 | 872 | 853 | 227.9 |
| D | 12 | 233 | 56341 | 243.51 | 872 | 853 | 227.9 |
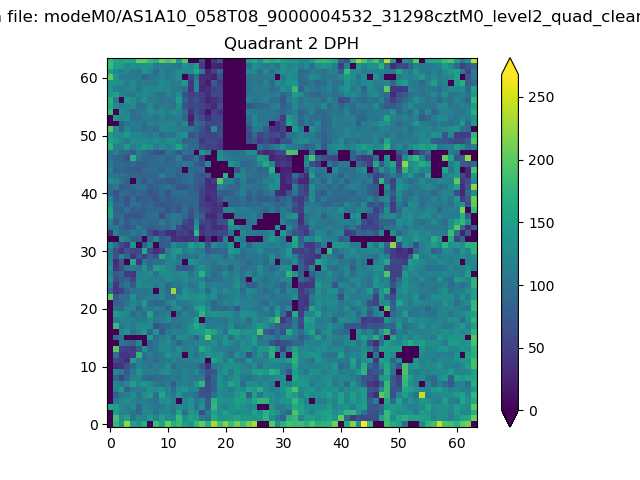
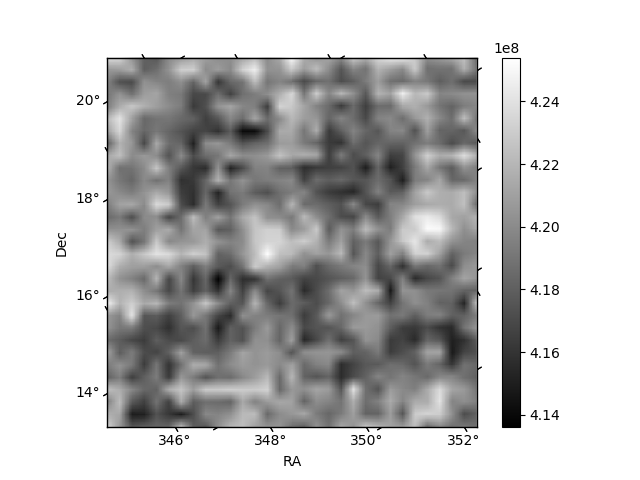
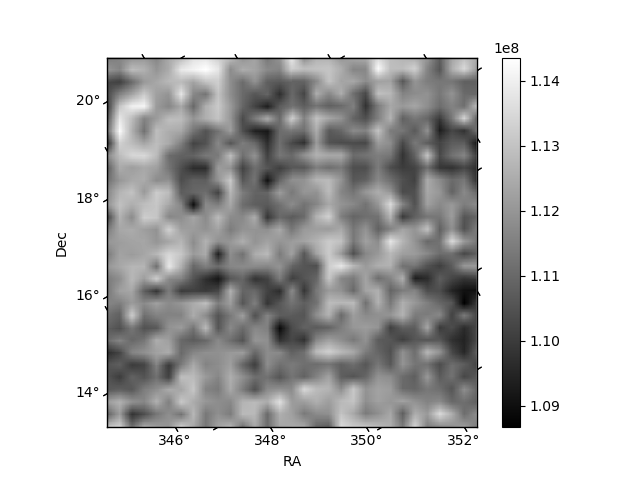
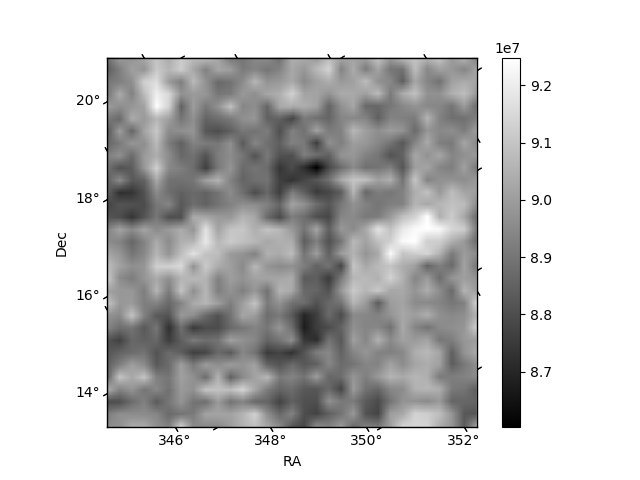
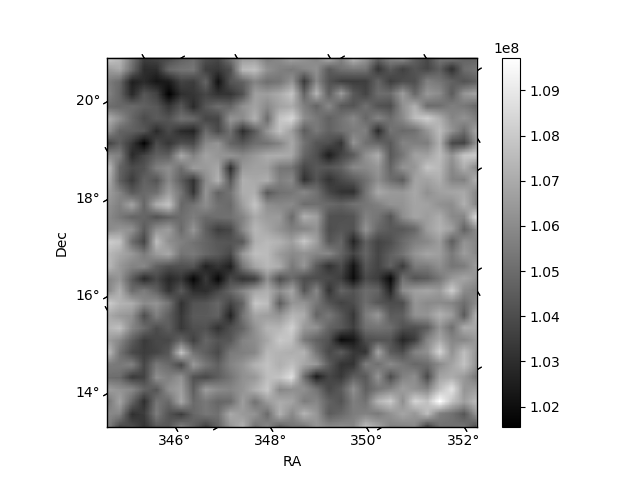
Histogram calculated using DETX and DETY for each event in the final _common_clean file
| Quadrant A | 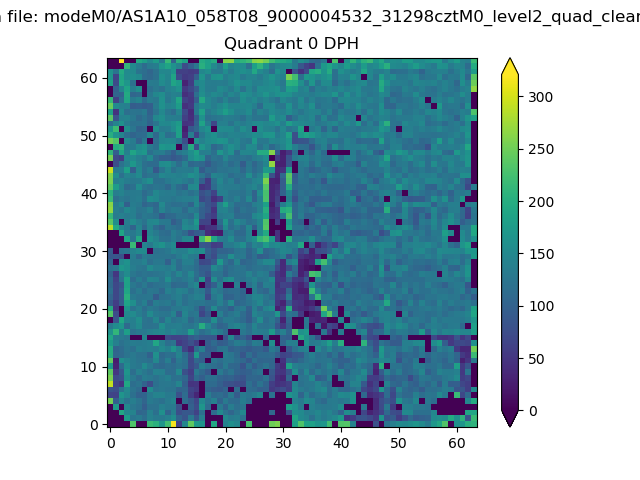 |
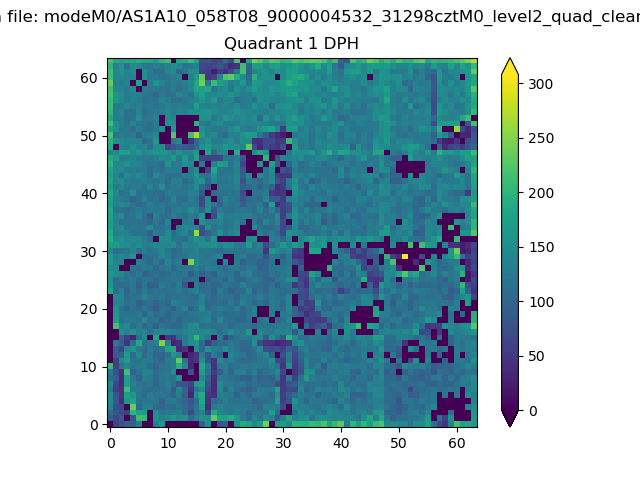 |
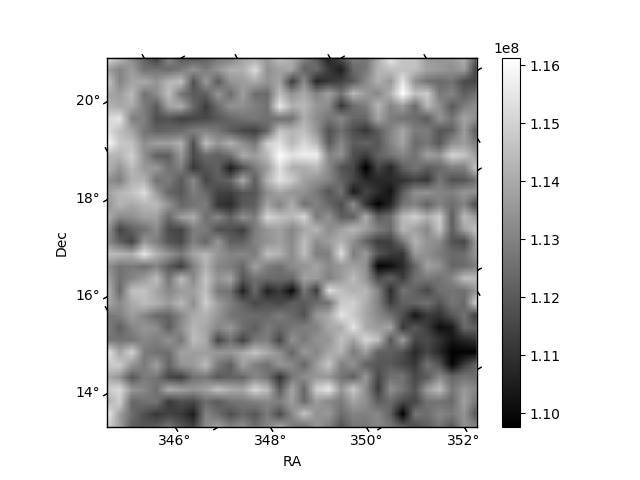
Quadrant B |
|---|---|---|---|
| Quadrant D | 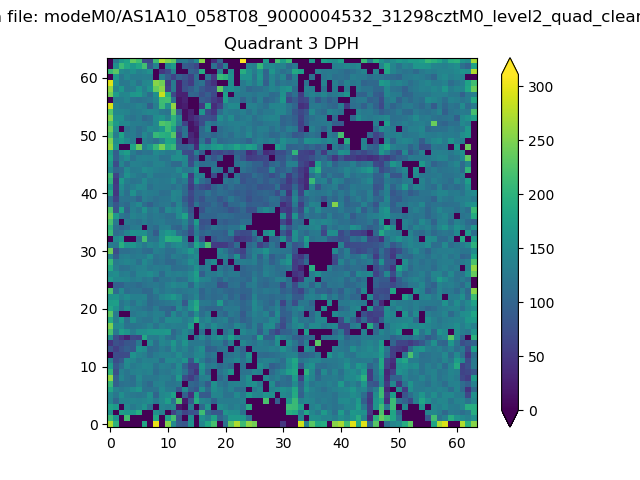 |
 |
Quadrant C |
| Plot type | Count rate plots | Images |
|---|---|---|
| Comparison with Poisson distribution Blue bars denote a histogram of data divided into 1 sec bins. Red curve is a Poisson curve with rate = median count rate of data. |
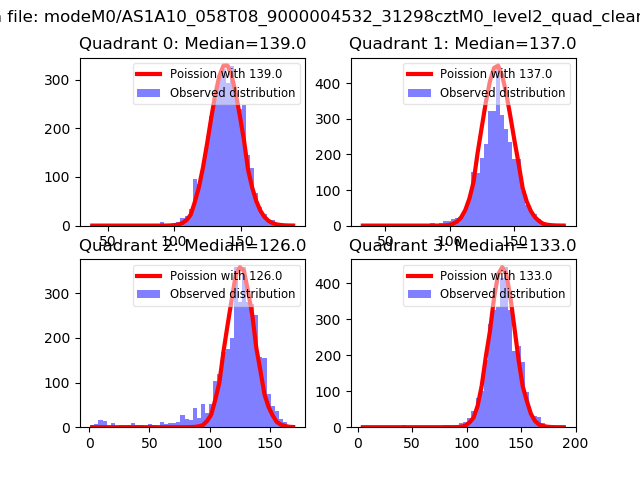 |
 |
| Quadrant-wise count rates Data is divided into 100 sec bins |
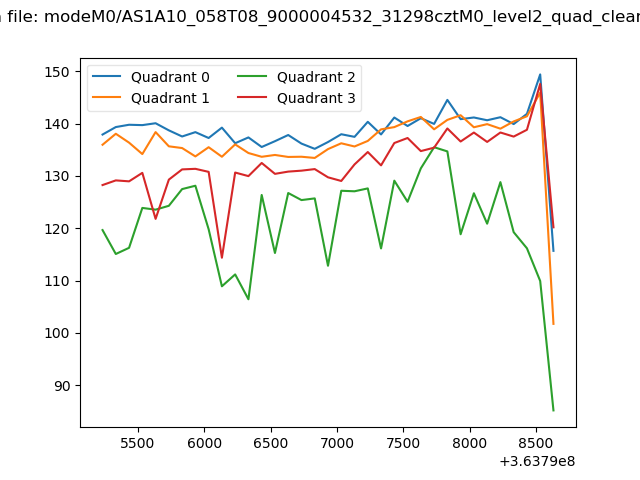 |
|
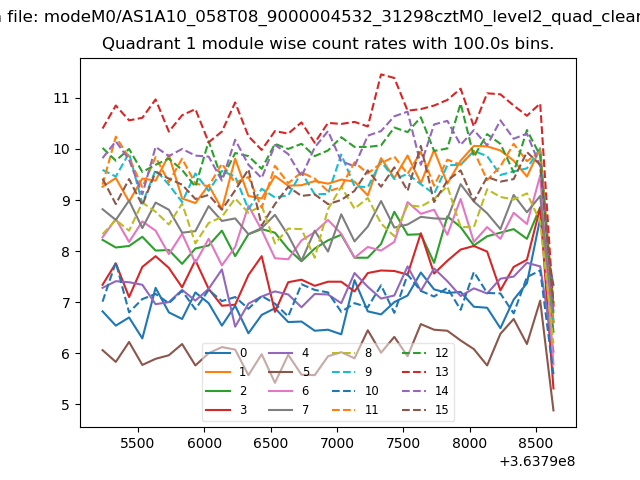
| Module-wise count rates for Quadrant A Data is divided into 100 sec bins |
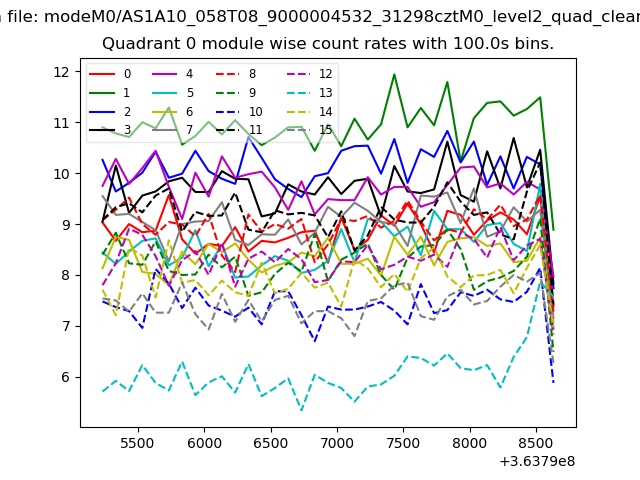 |
 |
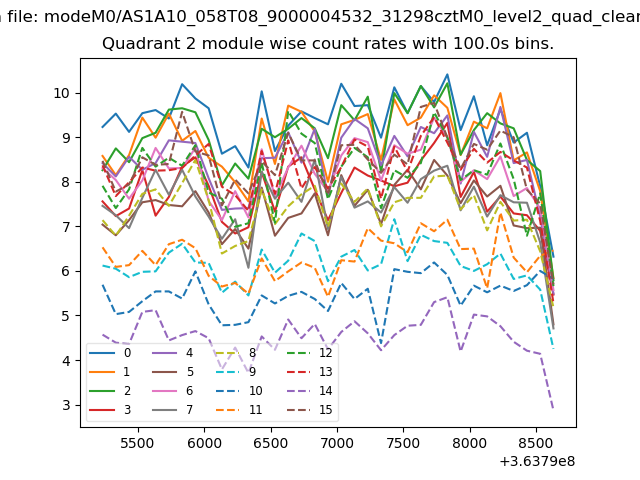
| Module-wise count rates for Quadrant B Data is divided into 100 sec bins |
 |
 |
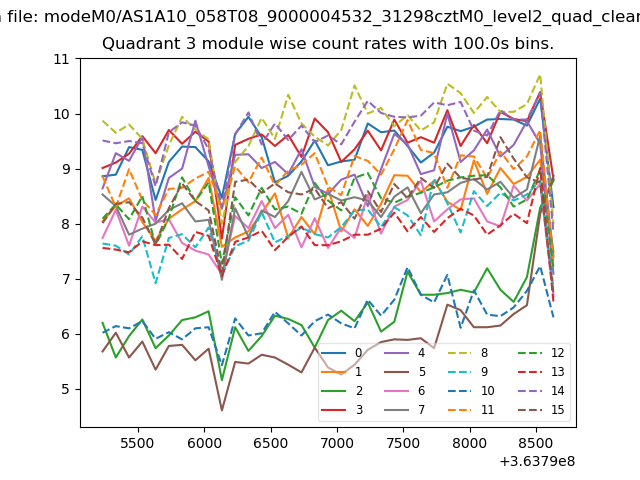
| Module-wise count rates for Quadrant C Data is divided into 100 sec bins |
 |
 |
| Module-wise count rates for Quadrant D Data is divided into 100 sec bins |
 |
 |
| Parameter | Plot |
|---|---|
| CZT HV Monitor | 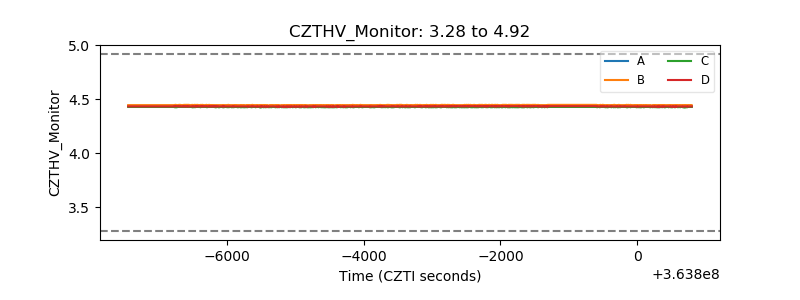 |
| D_VDD | 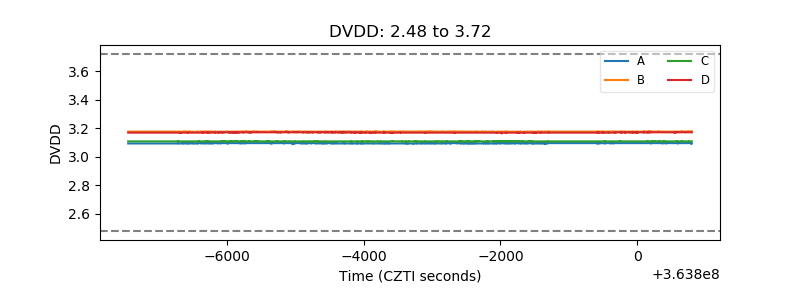 |
| Temperature 1 | 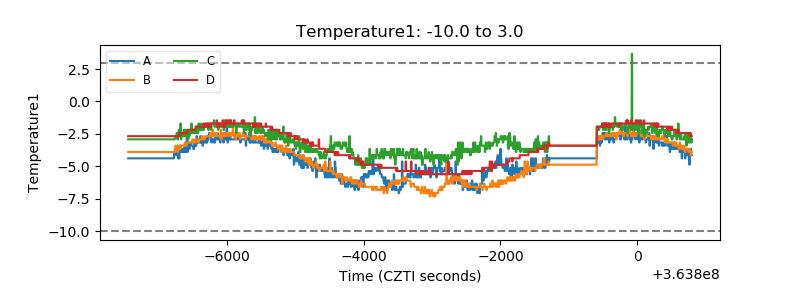 |
| Veto HV Monitor | 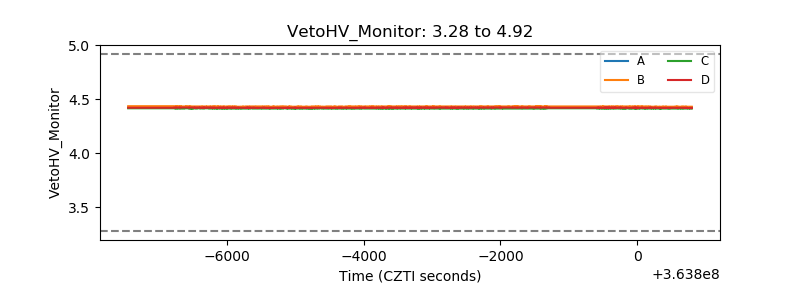 |
| Veto LLD | 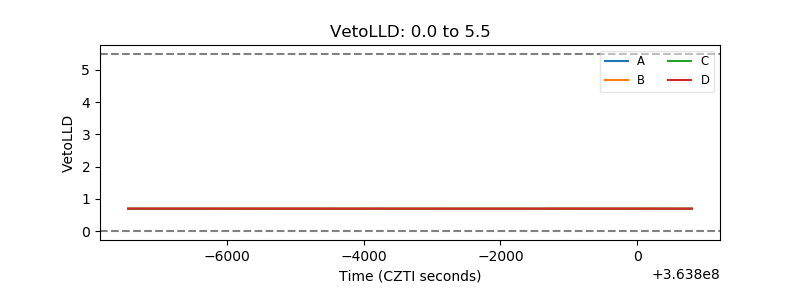 |
| Alpha Counter | 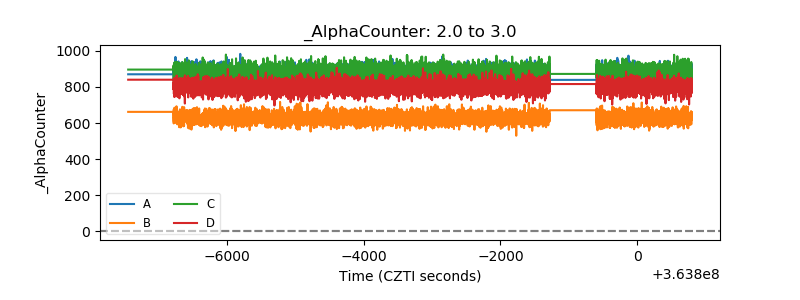 |
| _CPM_Rate | 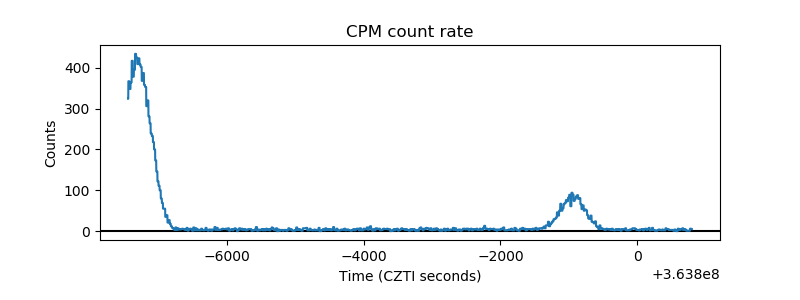 |
| CZT Counter | 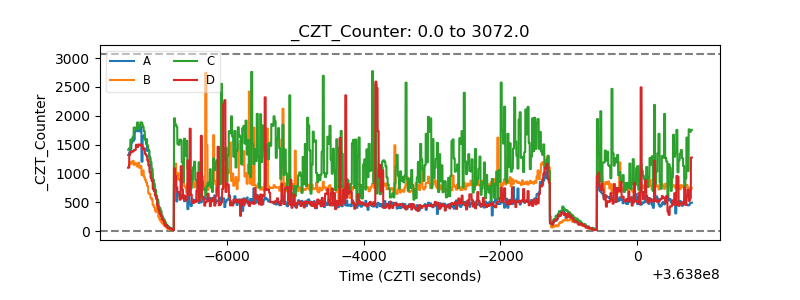 |
| +2.5 Volts monitor |  |
| +5 Volts monitor |  |
| _ROLL_ROT | 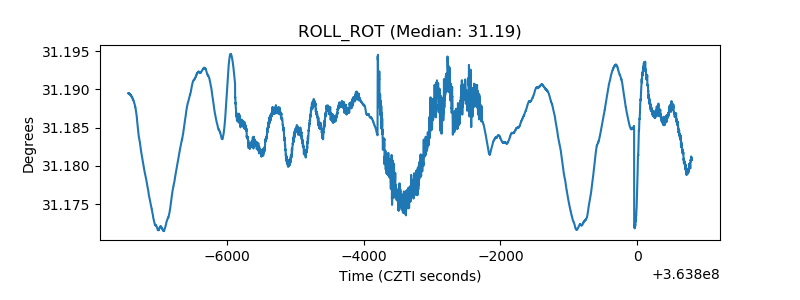 |
| _Roll_DEC | 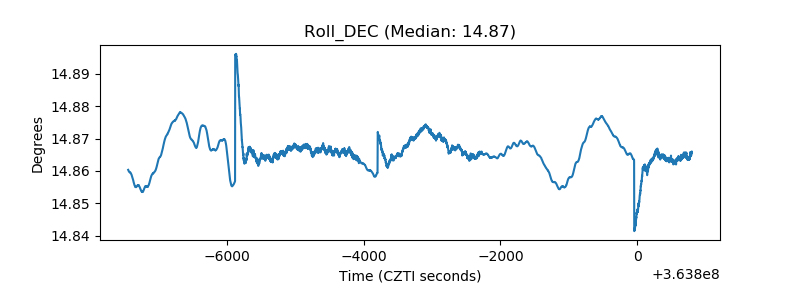 |
| _Roll_RA | 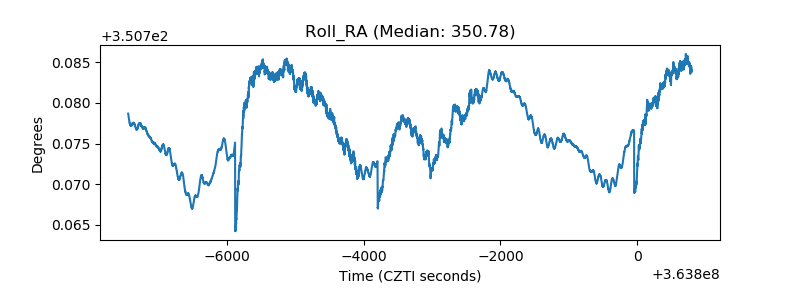 |
| Veto Counter | 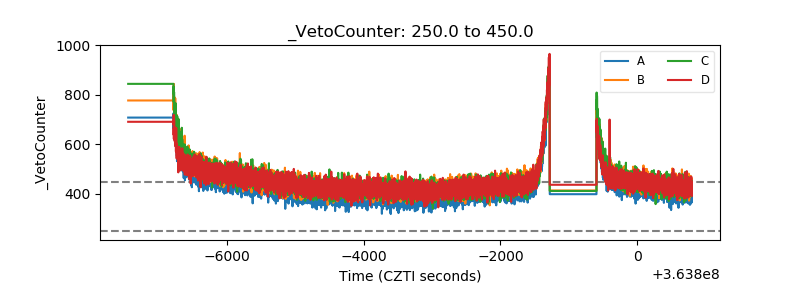 |