| Param | Original file | Final file |
|---|---|---|
| Filename | modeM0/AS1A10_058T08_9000004532_31299cztM0_level2.evt | modeM0/AS1A10_058T08_9000004532_31299cztM0_level2_quad_clean.evt |
| Size (bytes) | 680,748,480 | 82,353,600 |
| Size | 649.2 MB | 78.5 MB |
| Events in quadrant A | 3,568,260 | 518,483 |
| Events in quadrant B | 5,648,205 | 510,341 |
| Events in quadrant C | 6,709,487 | 463,653 |
| Events in quadrant D | 4,199,536 | 495,359 |
| Mode M0 | |||
|---|---|---|---|
| Quadrant | BADHDUFLAG | Total packets | Discarded packets |
| A | 0 | 14997 | 1 |
| B | 0 | 22012 | 1 |
| C | 0 | 25106 | 1 |
| D | 0 | 17238 | 1 |
| Mode M9 | |||
|---|---|---|---|
| Quadrant | BADHDUFLAG | Total packets | Discarded packets |
| A | 0 | 3 | 0 |
| B | 0 | 3 | 0 |
| C | 0 | 3 | 0 |
| D | 0 | 3 | 0 |
| Mode SS | |||
|---|---|---|---|
| Quadrant | BADHDUFLAG | Total packets | Discarded packets |
| A | 0 | 148 | 0 |
| B | 0 | 148 | 0 |
| C | 0 | 148 | 0 |
| D | 0 | 148 | 0 |
| Quadrant | Total seconds | Saturated seconds | Saturation percentage |
|---|---|---|---|
| A | 7265 | 105 | 1.445286% |
| B | 7265 | 188 | 2.587749% |
| C | 7265 | 711 | 9.786648% |
| D | 7266 | 138 | 1.899257% |
Noise dominated data is calculated using 1-second bins in cleaned event files. If a bin has >2000 counts, and if more than 50% of those come from <1% of pixels, then it is considered to be noise-dominated and hence unusable.
| Quadrant | # 1 sec bins | Bins with >0 counts | Bins with >2000 counts | High rate bins dominated by noise | Noise dominated (total time) | Noise dominated (detector-on time) | Marked lightcurve |
|---|---|---|---|---|---|---|---|
| A | 7565 | 7266 | 0 | 0 | 0.00% | 0.00% | 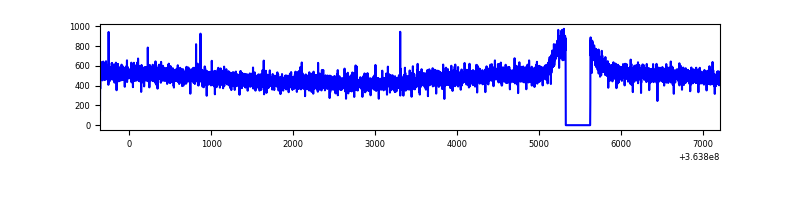 |
| B | 7565 | 7266 | 4 | 4 | 0.05% | 0.06% |  |
| C | 7564 | 7265 | 217 | 217 | 2.87% | 2.99% |  |
| D | 7566 | 7267 | 9 | 9 | 0.12% | 0.12% | 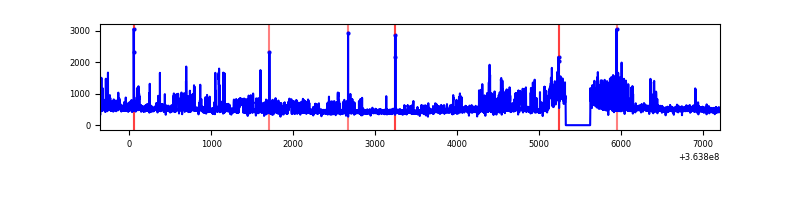 |
Top three noisy pixels from each quadrant. If the there are fewer than three noisy pixels in the level2.evt file, extra rows are filled as -1
| Pixel properties | Quadrant properties | ||||||
|---|---|---|---|---|---|---|---|
| Quadrant | DetID | PixID | Counts | Sigma | Mean | Median | Sigma |
| A | 13 | 254 | 14257 | 71.77 | 924 | 903 | 186.1 |
| A | 3 | 137 | 9641 | 46.96 | 924 | 903 | 186.1 |
| A | 0 | 226 | 7778 | 36.95 | 924 | 903 | 186.1 |
| B | 6 | 159 | 2012166 | 11406.56 | 906 | 883 | 176.3 |
| B | 4 | 80 | 36791 | 203.64 | 906 | 883 | 176.3 |
| B | 12 | 111 | 21612 | 117.56 | 906 | 883 | 176.3 |
| C | 3 | 233 | 3181410 | 16010.22 | 845 | 849 | 198.7 |
| C | 14 | 238 | 155689 | 779.43 | 845 | 849 | 198.7 |
| C | 0 | 10 | 35998 | 176.93 | 845 | 849 | 198.7 |
| D | 8 | 195 | 729264 | 3146.5 | 884 | 865 | 231.5 |
| D | 12 | 233 | 44373 | 187.94 | 884 | 865 | 231.5 |
| D | 2 | 250 | 41029 | 173.5 | 884 | 865 | 231.5 |
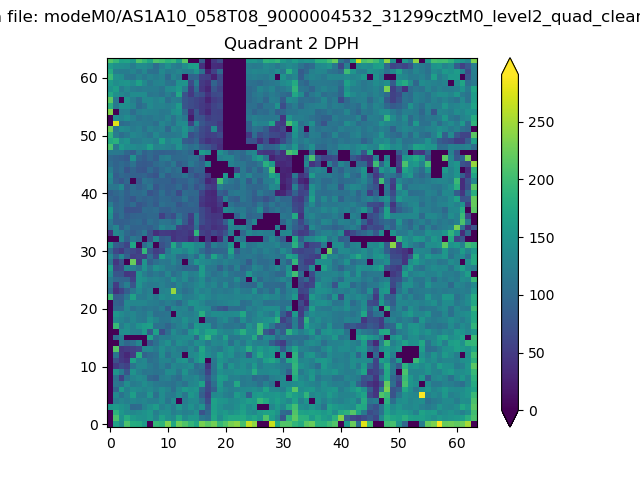
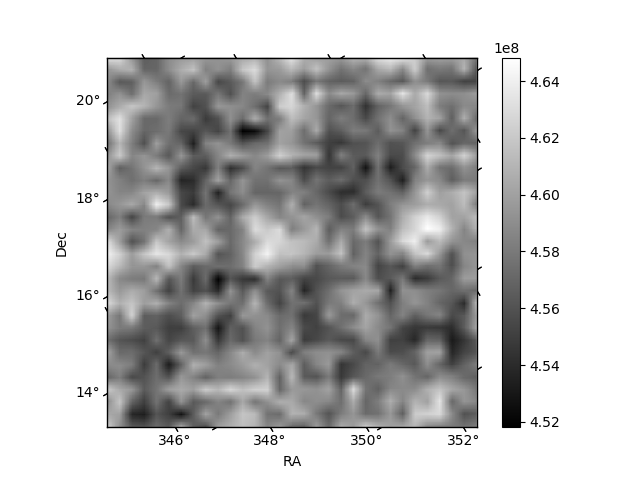
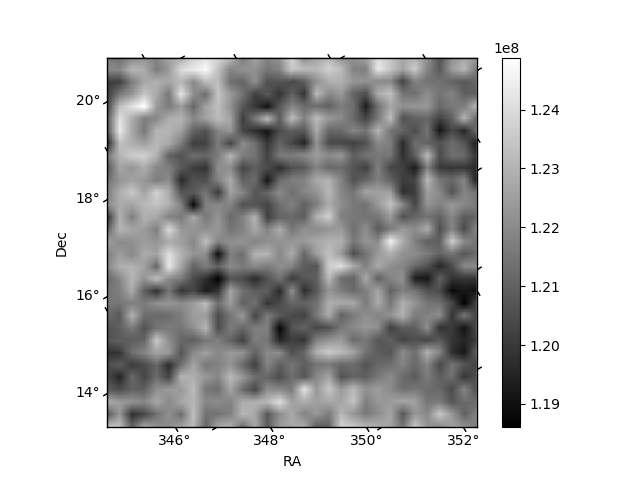
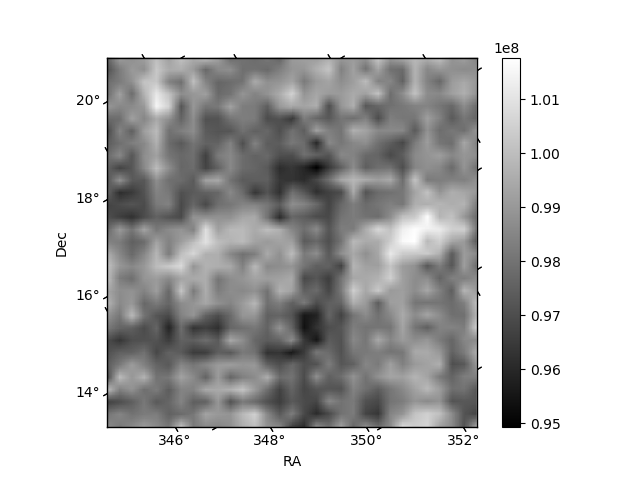
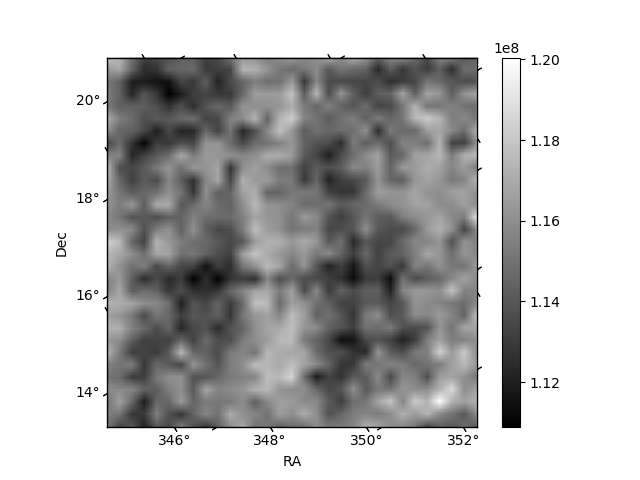
Histogram calculated using DETX and DETY for each event in the final _common_clean file
| Quadrant A | 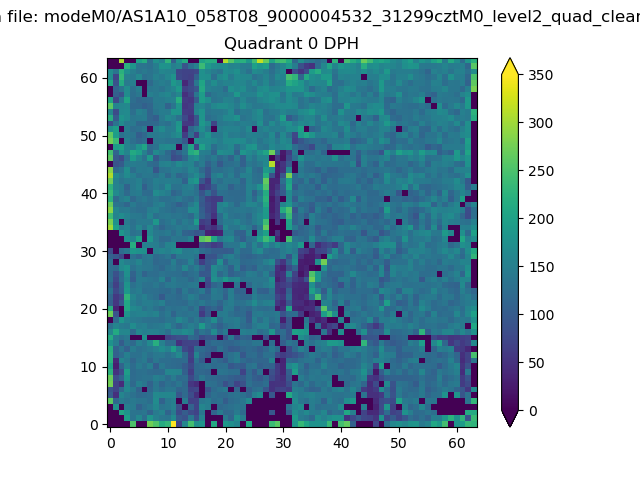 |
 |
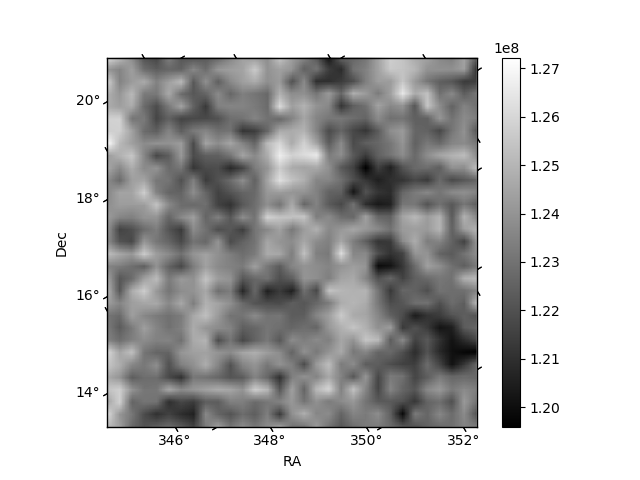
Quadrant B |
|---|---|---|---|
| Quadrant D |  |
 |
Quadrant C |
| Plot type | Count rate plots | Images |
|---|---|---|
| Comparison with Poisson distribution Blue bars denote a histogram of data divided into 1 sec bins. Red curve is a Poisson curve with rate = median count rate of data. |
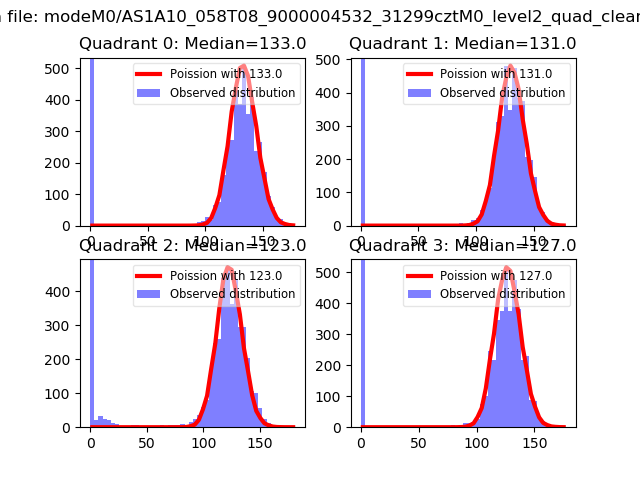 |
 |
| Quadrant-wise count rates Data is divided into 100 sec bins |
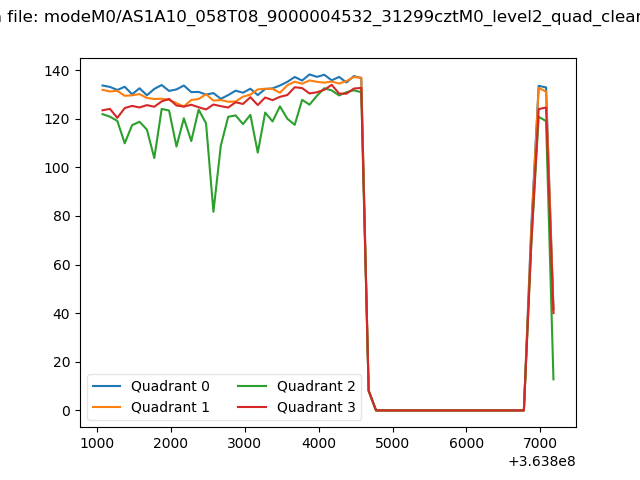 |
|
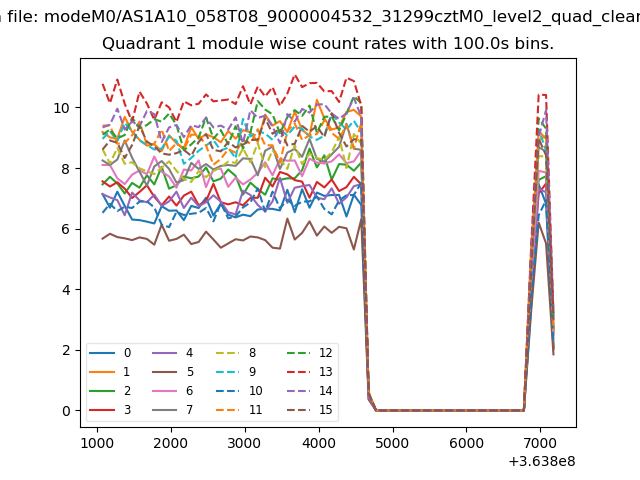
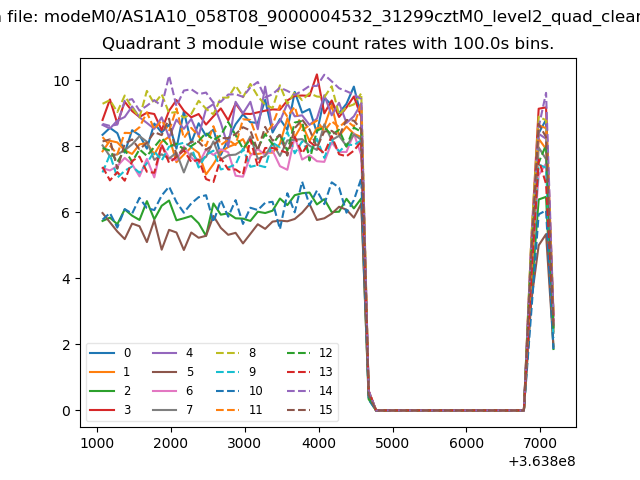
| Module-wise count rates for Quadrant A Data is divided into 100 sec bins |
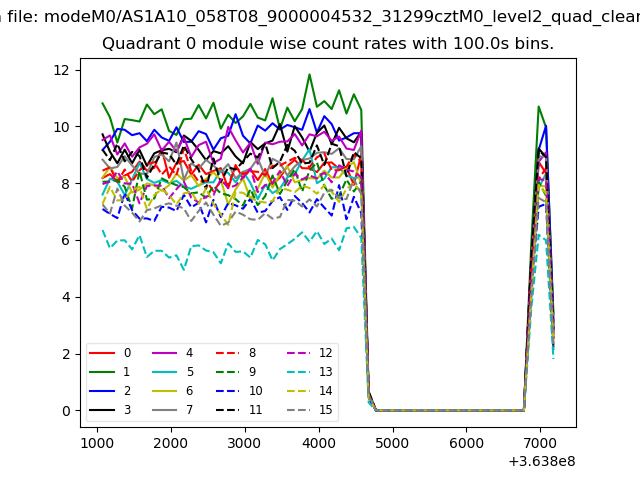 |
 |
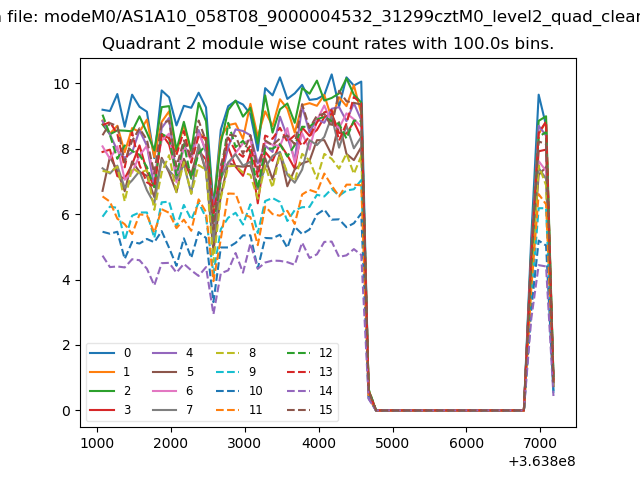
| Module-wise count rates for Quadrant B Data is divided into 100 sec bins |
 |
 |
| Module-wise count rates for Quadrant C Data is divided into 100 sec bins |
 |
 |
| Module-wise count rates for Quadrant D Data is divided into 100 sec bins |
 |
 |
| Parameter | Plot |
|---|---|
| CZT HV Monitor | 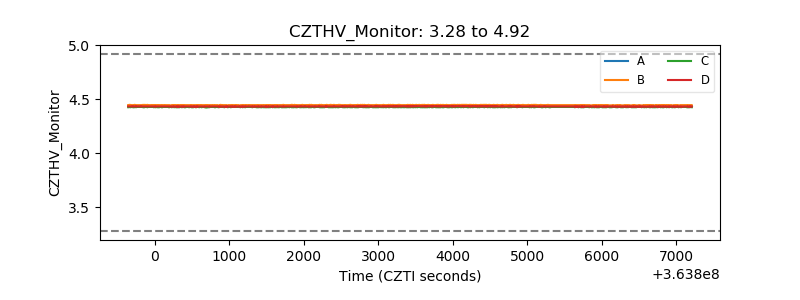 |
| D_VDD | 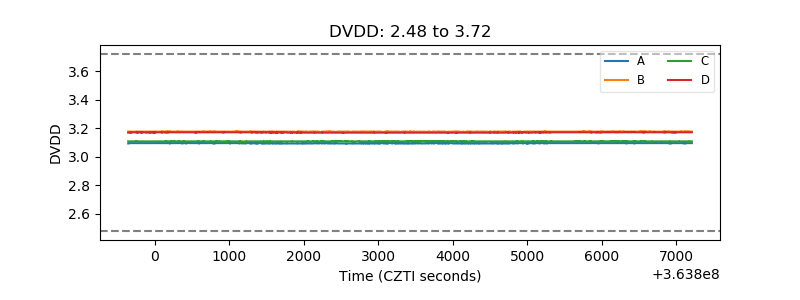 |
| Temperature 1 | 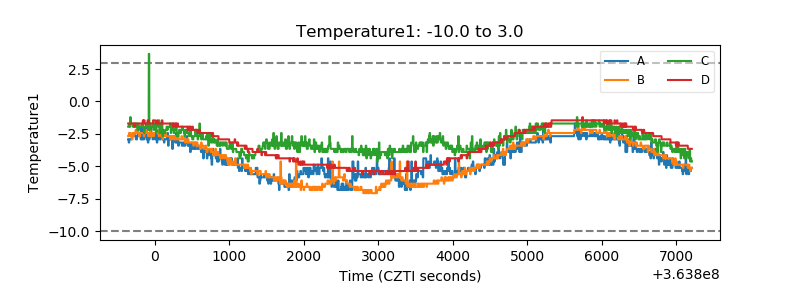 |
| Veto HV Monitor | 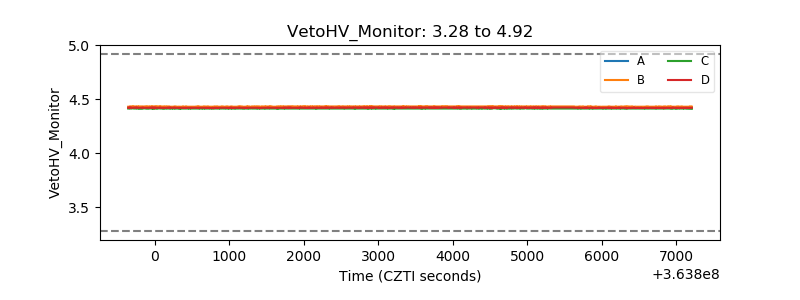 |
| Veto LLD | 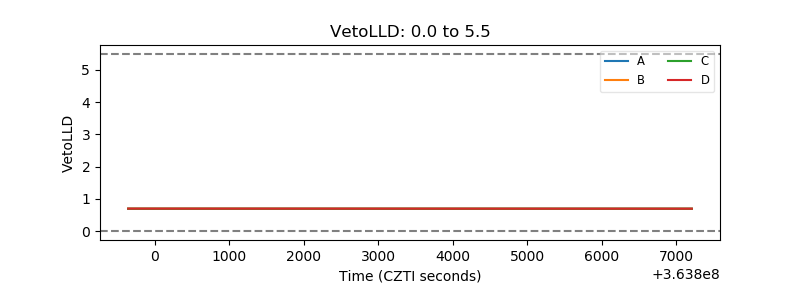 |
| Alpha Counter | 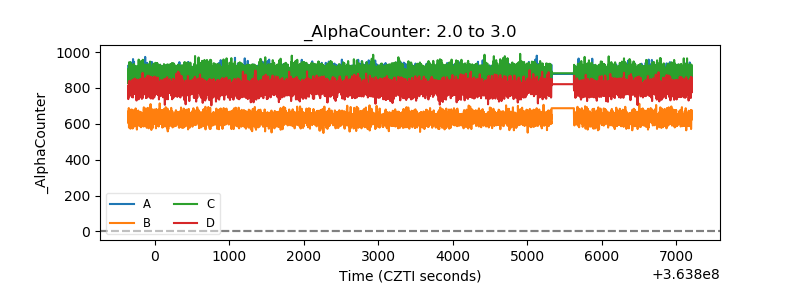 |
| _CPM_Rate | 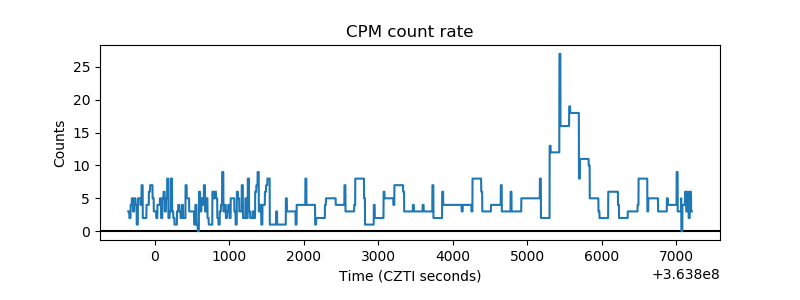 |
| CZT Counter |  |
| +2.5 Volts monitor |  |
| +5 Volts monitor |  |
| _ROLL_ROT | 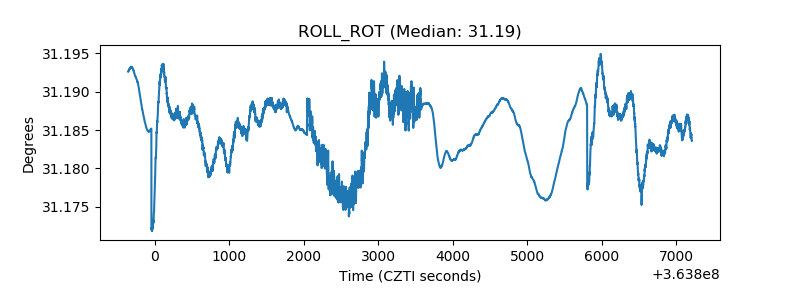 |
| _Roll_DEC | 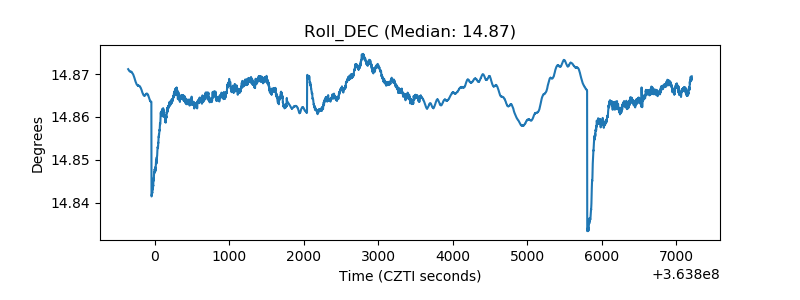 |
| _Roll_RA | 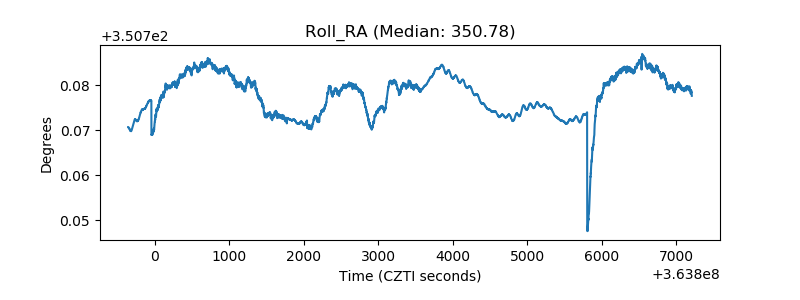 |
| Veto Counter | 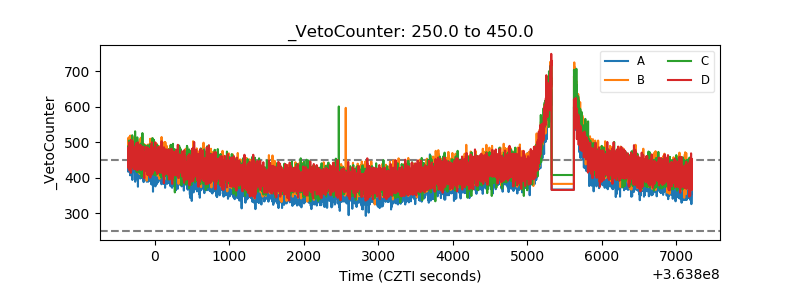 |