| Param | Original file | Final file |
|---|---|---|
| Filename | modeM0/AS1A10_058T08_9000004532_31301cztM0_level2.evt | modeM0/AS1A10_058T08_9000004532_31301cztM0_level2_quad_clean.evt |
| Size (bytes) | 669,968,640 | 98,190,720 |
| Size | 638.9 MB | 93.6 MB |
| Events in quadrant A | 3,856,235 | 623,927 |
| Events in quadrant B | 6,286,961 | 616,968 |
| Events in quadrant C | 5,099,145 | 589,919 |
| Events in quadrant D | 4,511,721 | 592,066 |
| Mode M0 | |||
|---|---|---|---|
| Quadrant | BADHDUFLAG | Total packets | Discarded packets |
| A | 0 | 16497 | 2 |
| B | 0 | 24309 | 2 |
| C | 0 | 20295 | 2 |
| D | 0 | 18728 | 2 |
| Mode M9 | |||
|---|---|---|---|
| Quadrant | BADHDUFLAG | Total packets | Discarded packets |
| A | 0 | 6 | 0 |
| B | 0 | 6 | 0 |
| C | 0 | 6 | 0 |
| D | 0 | 6 | 0 |
| Mode SS | |||
|---|---|---|---|
| Quadrant | BADHDUFLAG | Total packets | Discarded packets |
| A | 0 | 164 | 0 |
| B | 0 | 164 | 0 |
| C | 0 | 164 | 0 |
| D | 0 | 164 | 0 |
| Quadrant | Total seconds | Saturated seconds | Saturation percentage |
|---|---|---|---|
| A | 7915 | 79 | 0.998105% |
| B | 7916 | 287 | 3.625568% |
| C | 7916 | 492 | 6.215260% |
| D | 7916 | 151 | 1.907529% |
Noise dominated data is calculated using 1-second bins in cleaned event files. If a bin has >2000 counts, and if more than 50% of those come from <1% of pixels, then it is considered to be noise-dominated and hence unusable.
| Quadrant | # 1 sec bins | Bins with >0 counts | Bins with >2000 counts | High rate bins dominated by noise | Noise dominated (total time) | Noise dominated (detector-on time) | Marked lightcurve |
|---|---|---|---|---|---|---|---|
| A | 8560 | 7917 | 0 | 0 | 0.00% | 0.00% | 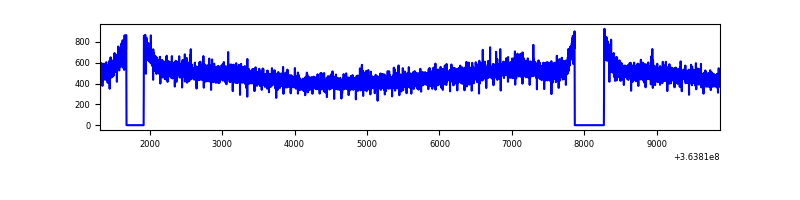 |
| B | 8561 | 7918 | 3 | 3 | 0.04% | 0.04% | 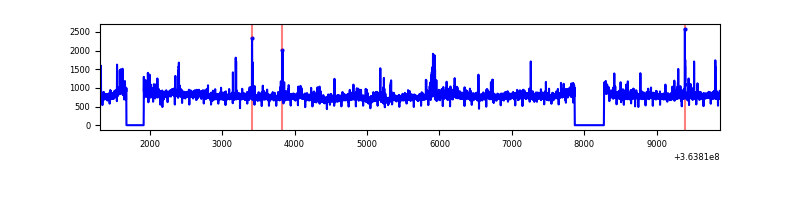 |
| C | 8561 | 7918 | 43 | 43 | 0.50% | 0.54% | 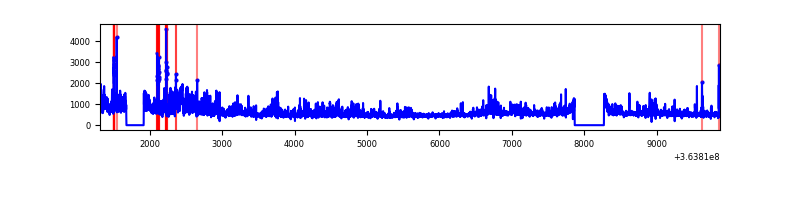 |
| D | 8561 | 7918 | 53 | 53 | 0.62% | 0.67% | 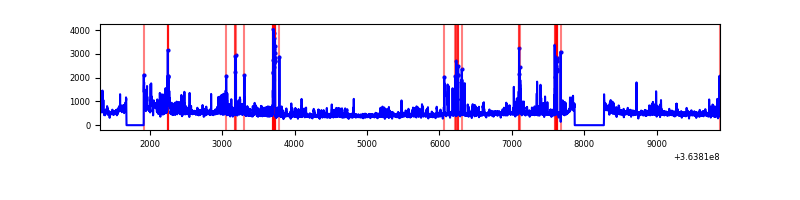 |
Top three noisy pixels from each quadrant. If the there are fewer than three noisy pixels in the level2.evt file, extra rows are filled as -1
| Pixel properties | Quadrant properties | ||||||
|---|---|---|---|---|---|---|---|
| Quadrant | DetID | PixID | Counts | Sigma | Mean | Median | Sigma |
| A | 13 | 254 | 15229 | 70.9 | 999 | 978 | 201.0 |
| A | 3 | 137 | 10662 | 48.18 | 999 | 978 | 201.0 |
| A | 0 | 226 | 8361 | 36.73 | 999 | 978 | 201.0 |
| B | 6 | 159 | 2202286 | 11449.37 | 982 | 951 | 192.3 |
| B | 4 | 80 | 160987 | 832.36 | 982 | 951 | 192.3 |
| B | 12 | 111 | 24214 | 120.99 | 982 | 951 | 192.3 |
| C | 3 | 233 | 1146361 | 5202.3 | 935 | 939 | 220.2 |
| C | 14 | 238 | 191714 | 866.47 | 935 | 939 | 220.2 |
| C | 14 | 254 | 61020 | 272.88 | 935 | 939 | 220.2 |
| D | 8 | 195 | 559049 | 2288.43 | 957 | 934 | 243.9 |
| D | 12 | 233 | 186821 | 762.19 | 957 | 934 | 243.9 |
| D | 12 | 79 | 88553 | 359.26 | 957 | 934 | 243.9 |
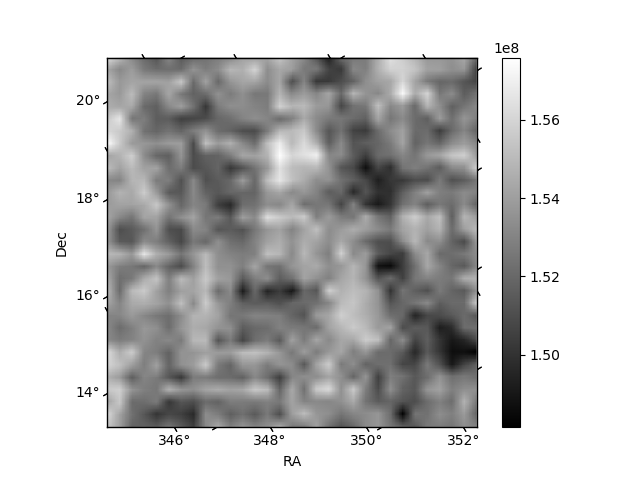
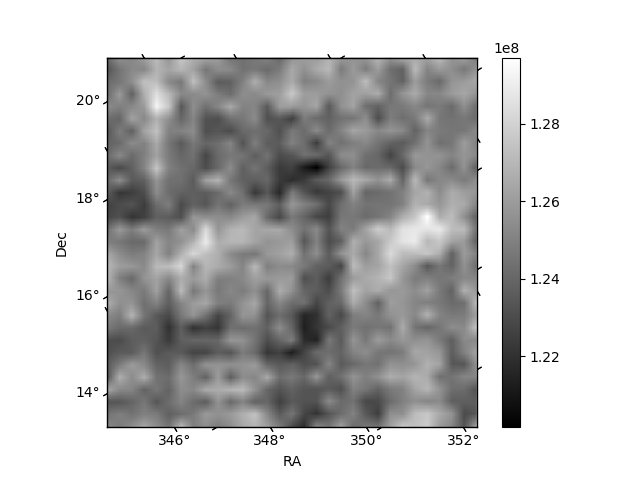
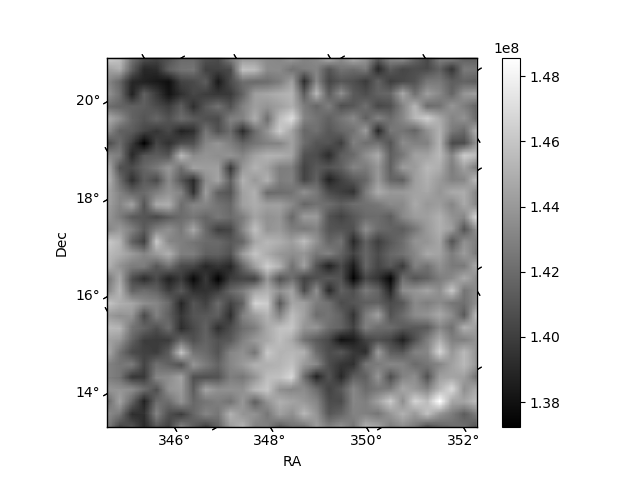
Histogram calculated using DETX and DETY for each event in the final _common_clean file
| Quadrant A | 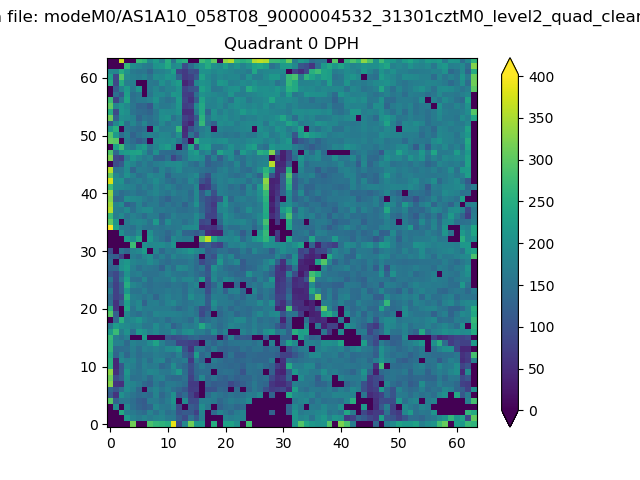 |
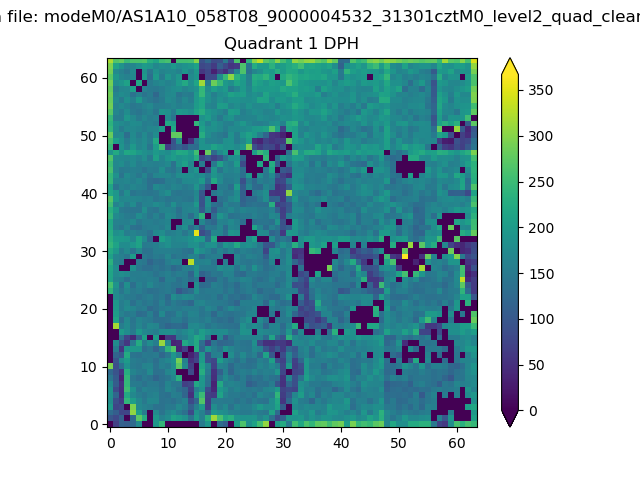 |
Quadrant B |
|---|---|---|---|
| Quadrant D | 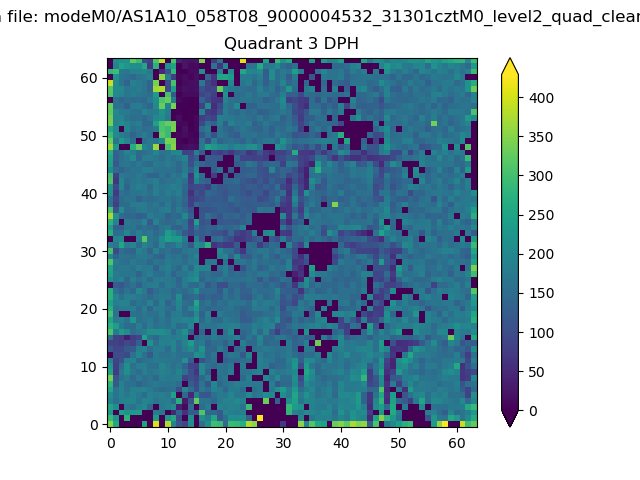 |
 |
Quadrant C |
| Plot type | Count rate plots | Images |
|---|---|---|
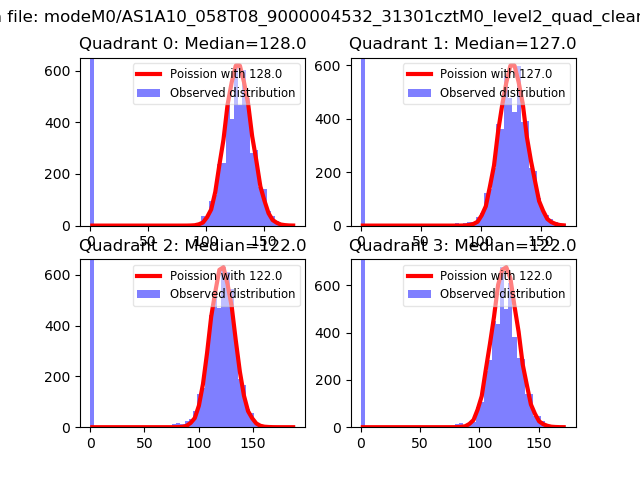
| Comparison with Poisson distribution Blue bars denote a histogram of data divided into 1 sec bins. Red curve is a Poisson curve with rate = median count rate of data. |
 |
 |
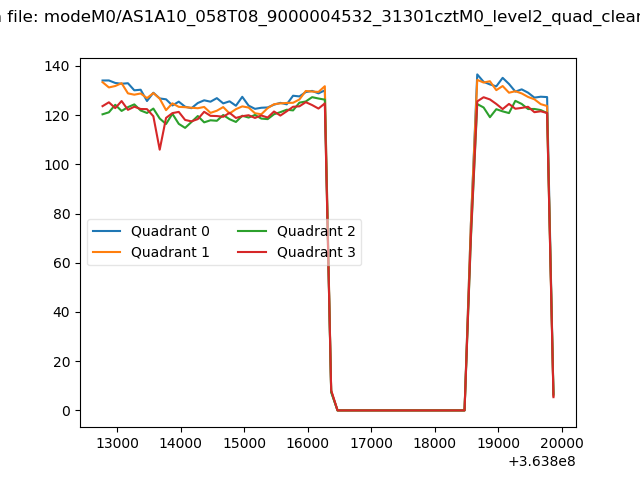
| Quadrant-wise count rates Data is divided into 100 sec bins |
 |
|
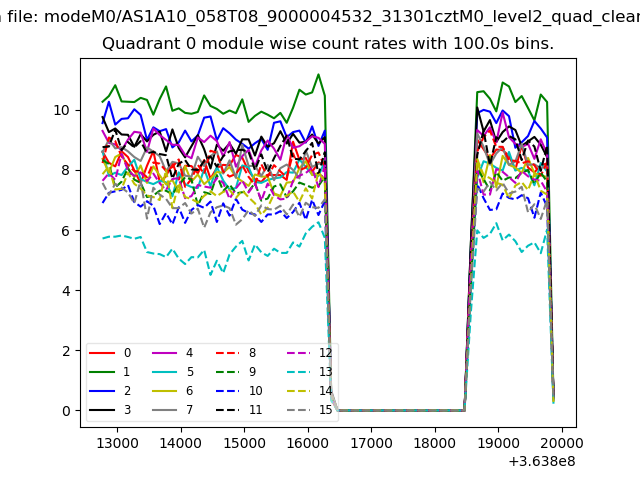
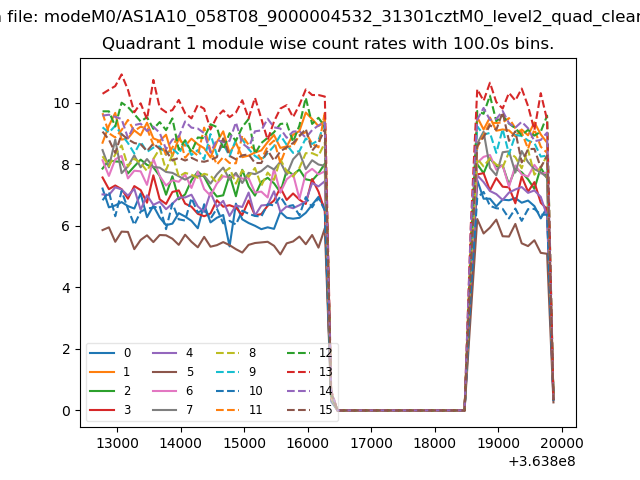
| Module-wise count rates for Quadrant A Data is divided into 100 sec bins |
 |
 |
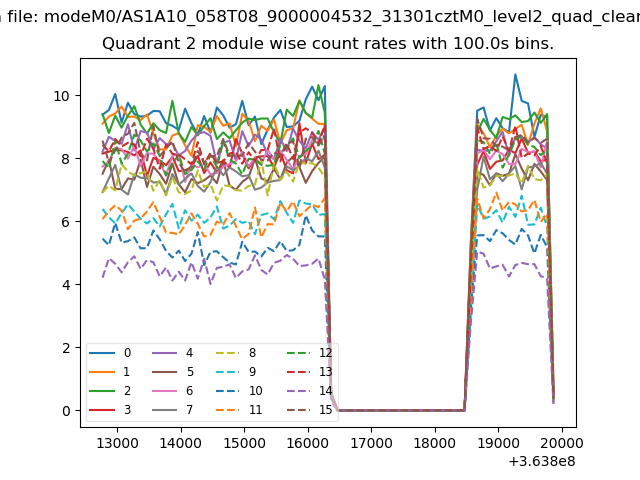
| Module-wise count rates for Quadrant B Data is divided into 100 sec bins |
 |
 |
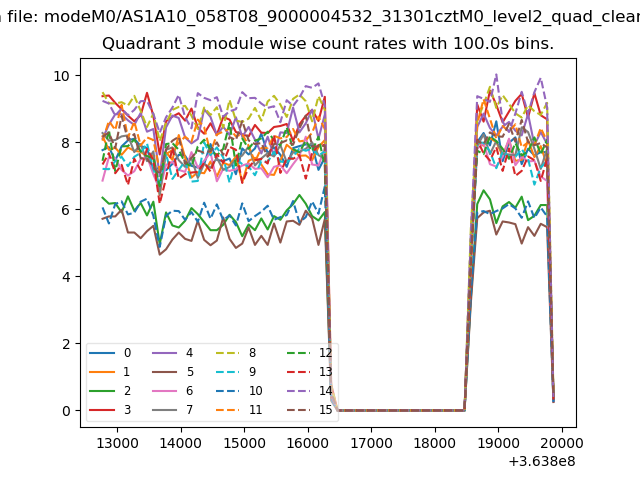
| Module-wise count rates for Quadrant C Data is divided into 100 sec bins |
 |
 |
| Module-wise count rates for Quadrant D Data is divided into 100 sec bins |
 |
 |
| Parameter | Plot |
|---|---|
| CZT HV Monitor | 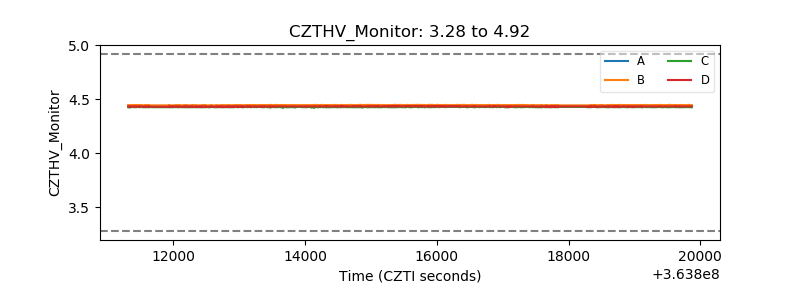 |
| D_VDD | 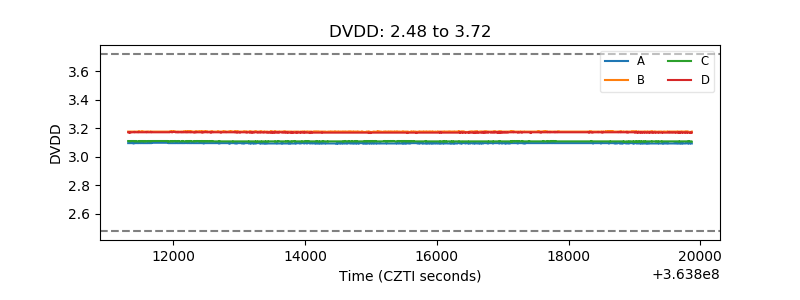 |
| Temperature 1 | 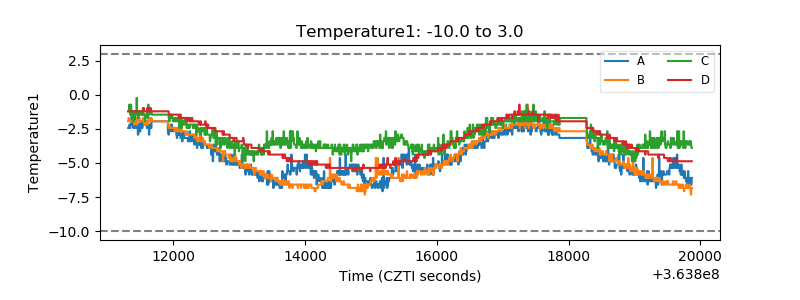 |
| Veto HV Monitor | 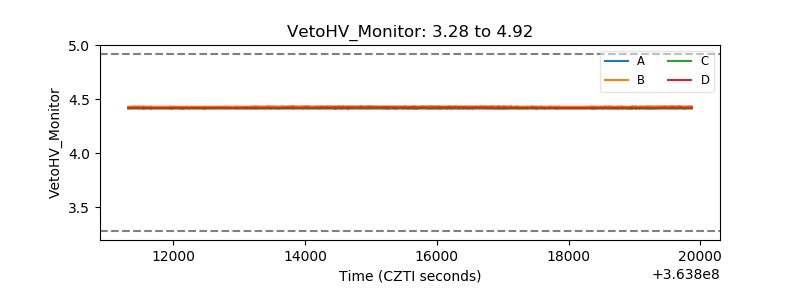 |
| Veto LLD | 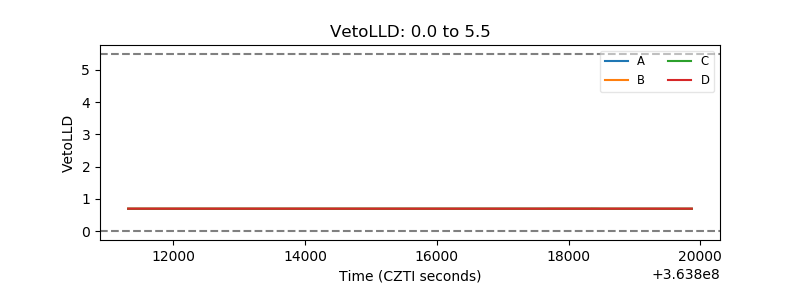 |
| Alpha Counter | 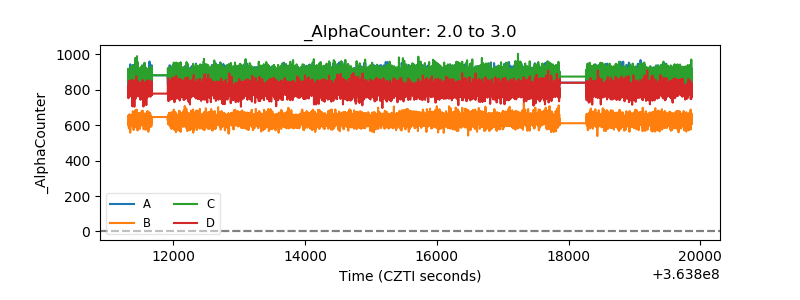 |
| _CPM_Rate | 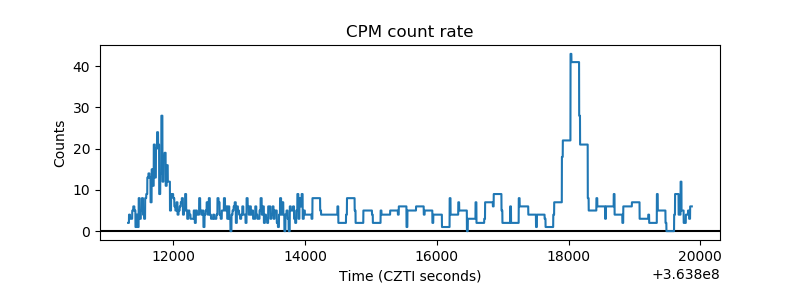 |
| CZT Counter | 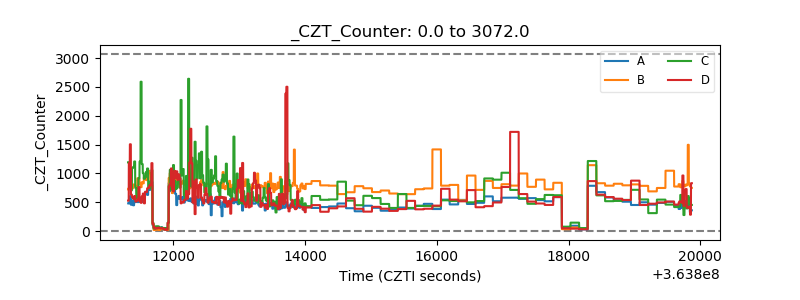 |
| +2.5 Volts monitor |  |
| +5 Volts monitor |  |
| _ROLL_ROT | 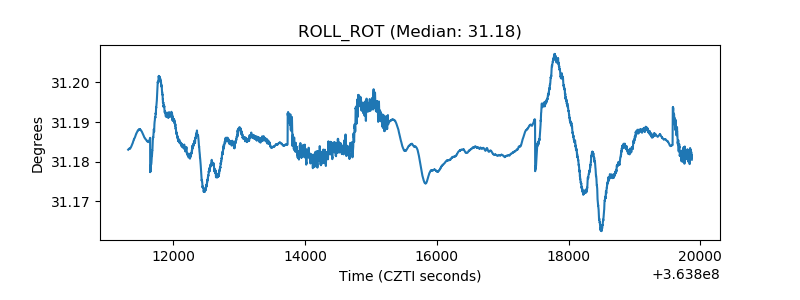 |
| _Roll_DEC | 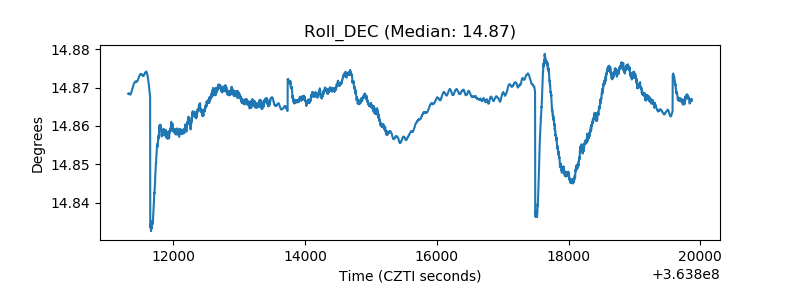 |
| _Roll_RA | 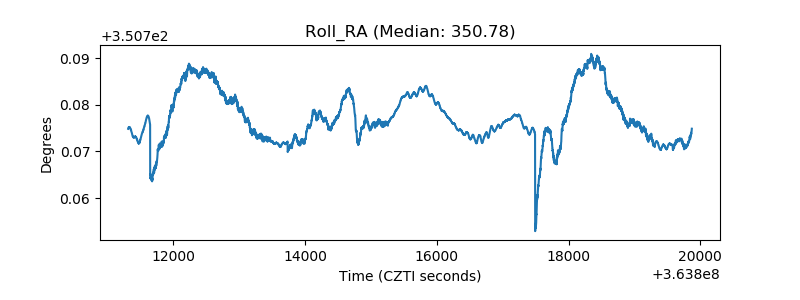 |
| Veto Counter | 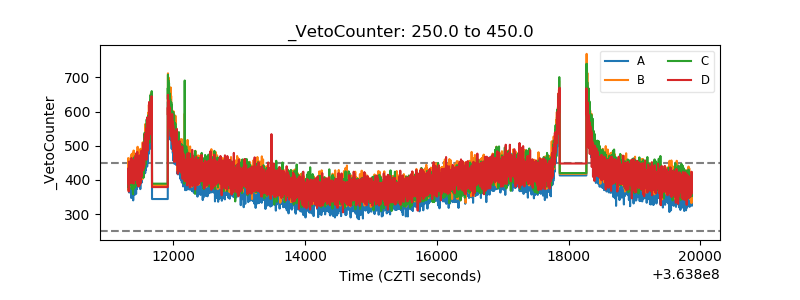 |