| Param | Original file | Final file |
|---|---|---|
| Filename | modeM0/AS1A10_058T08_9000004532_31303cztM0_level2.evt | modeM0/AS1A10_058T08_9000004532_31303cztM0_level2_quad_clean.evt |
| Size (bytes) | 1,132,853,760 | 170,354,880 |
| Size | 1.1 GB | 162.5 MB |
| Events in quadrant A | 6,324,185 | 1,093,542 |
| Events in quadrant B | 10,426,060 | 1,083,803 |
| Events in quadrant C | 9,748,282 | 1,023,788 |
| Events in quadrant D | 6,914,368 | 1,041,004 |
| Mode M0 | |||
|---|---|---|---|
| Quadrant | BADHDUFLAG | Total packets | Discarded packets |
| A | 0 | 27462 | 3 |
| B | 0 | 40861 | 3 |
| C | 0 | 38011 | 3 |
| D | 0 | 29626 | 3 |
| Mode M9 | |||
|---|---|---|---|
| Quadrant | BADHDUFLAG | Total packets | Discarded packets |
| A | 0 | 18 | 0 |
| B | 0 | 18 | 0 |
| C | 0 | 18 | 0 |
| D | 0 | 18 | 0 |
| Mode SS | |||
|---|---|---|---|
| Quadrant | BADHDUFLAG | Total packets | Discarded packets |
| A | 0 | 270 | 0 |
| B | 0 | 270 | 0 |
| C | 0 | 270 | 0 |
| D | 0 | 270 | 0 |
| Quadrant | Total seconds | Saturated seconds | Saturation percentage |
|---|---|---|---|
| A | 13280 | 81 | 0.609940% |
| B | 13280 | 378 | 2.846386% |
| C | 13280 | 1072 | 8.072289% |
| D | 13280 | 140 | 1.054217% |
Noise dominated data is calculated using 1-second bins in cleaned event files. If a bin has >2000 counts, and if more than 50% of those come from <1% of pixels, then it is considered to be noise-dominated and hence unusable.
| Quadrant | # 1 sec bins | Bins with >0 counts | Bins with >2000 counts | High rate bins dominated by noise | Noise dominated (total time) | Noise dominated (detector-on time) | Marked lightcurve |
|---|---|---|---|---|---|---|---|
| A | 15020 | 13283 | 0 | 0 | 0.00% | 0.00% | 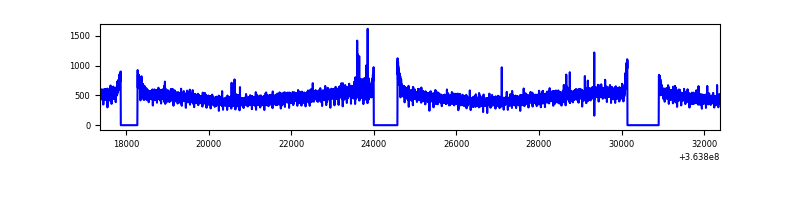 |
| B | 15020 | 13283 | 33 | 33 | 0.22% | 0.25% | 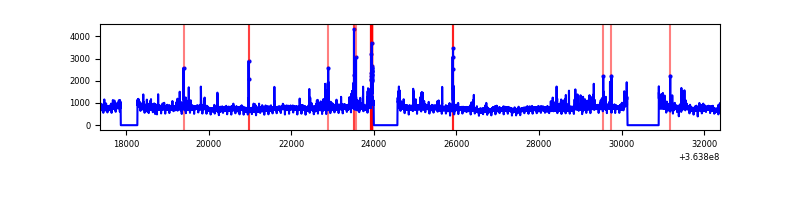 |
| C | 15020 | 13283 | 46 | 46 | 0.31% | 0.35% | 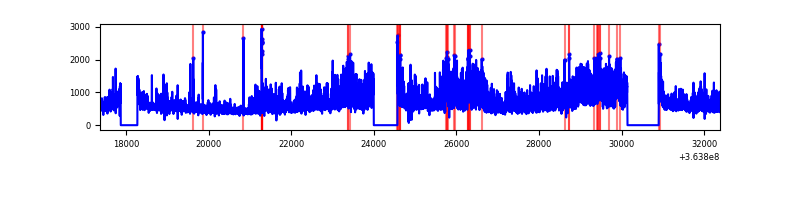 |
| D | 15020 | 13283 | 51 | 51 | 0.34% | 0.38% |  |
Top three noisy pixels from each quadrant. If the there are fewer than three noisy pixels in the level2.evt file, extra rows are filled as -1
| Pixel properties | Quadrant properties | ||||||
|---|---|---|---|---|---|---|---|
| Quadrant | DetID | PixID | Counts | Sigma | Mean | Median | Sigma |
| A | 13 | 254 | 24770 | 70.64 | 1635 | 1600 | 328.0 |
| A | 3 | 137 | 17191 | 47.54 | 1635 | 1600 | 328.0 |
| A | 0 | 226 | 13388 | 35.94 | 1635 | 1600 | 328.0 |
| B | 6 | 159 | 3684586 | 11884.86 | 1607 | 1562 | 309.9 |
| B | 4 | 80 | 358466 | 1151.7 | 1607 | 1562 | 309.9 |
| B | 12 | 111 | 39486 | 122.38 | 1607 | 1562 | 309.9 |
| C | 3 | 233 | 3177057 | 8836.07 | 1530 | 1537 | 359.4 |
| C | 14 | 238 | 347655 | 963.09 | 1530 | 1537 | 359.4 |
| C | 14 | 254 | 150140 | 413.5 | 1530 | 1537 | 359.4 |
| D | 8 | 195 | 519258 | 1262.53 | 1563 | 1534 | 410.1 |
| D | 12 | 233 | 255121 | 618.4 | 1563 | 1534 | 410.1 |
| D | 2 | 250 | 114412 | 275.27 | 1563 | 1534 | 410.1 |
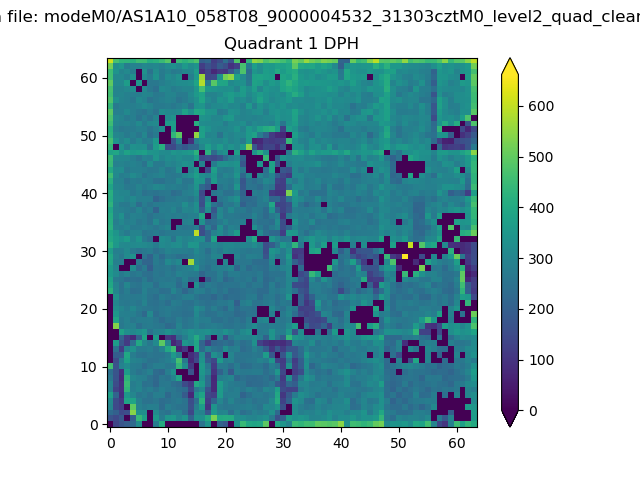
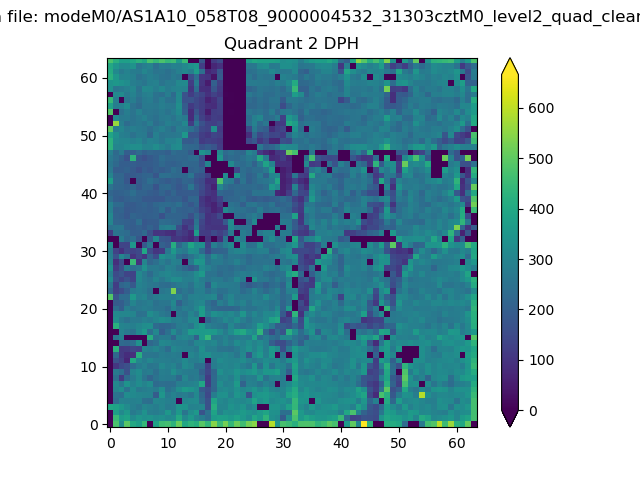
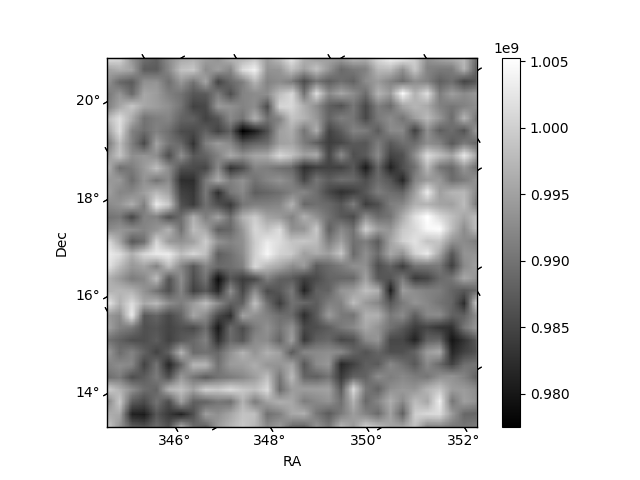
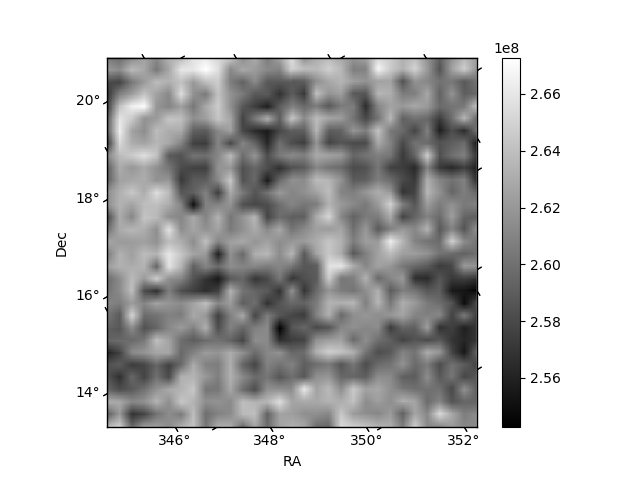
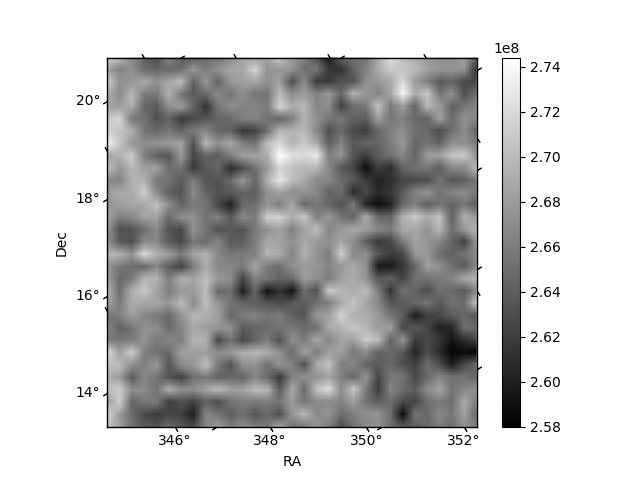
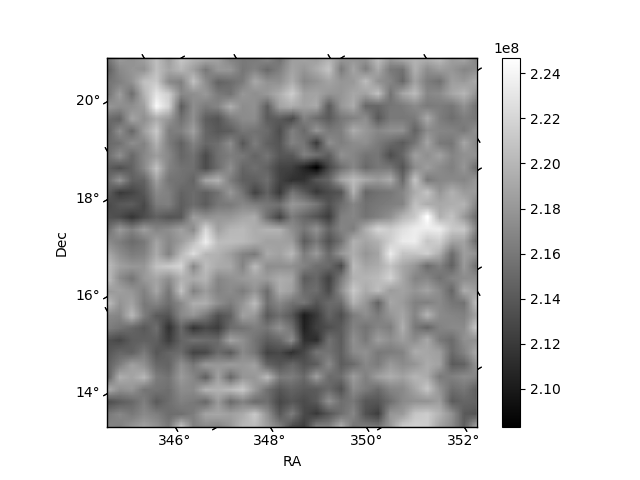
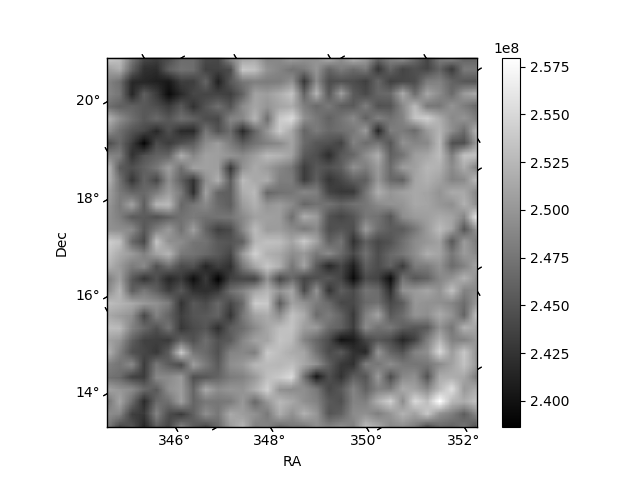
Histogram calculated using DETX and DETY for each event in the final _common_clean file
| Quadrant A | 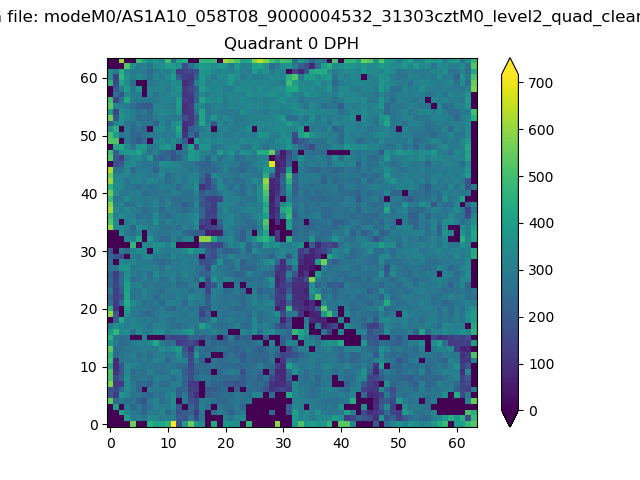 |
 |
Quadrant B |
|---|---|---|---|
| Quadrant D | 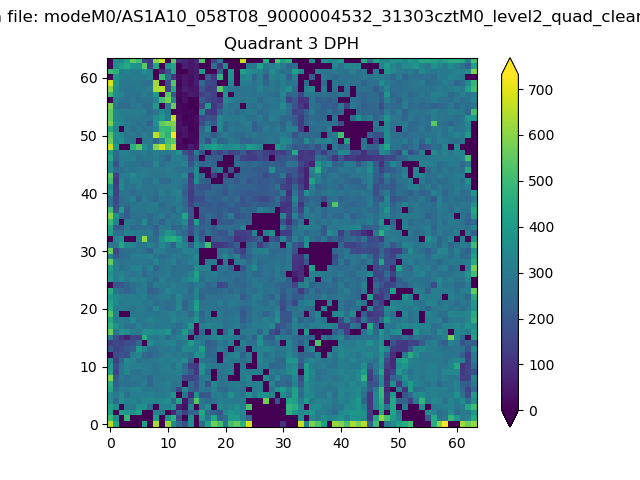 |
 |
Quadrant C |
| Plot type | Count rate plots | Images |
|---|---|---|
| Comparison with Poisson distribution Blue bars denote a histogram of data divided into 1 sec bins. Red curve is a Poisson curve with rate = median count rate of data. |
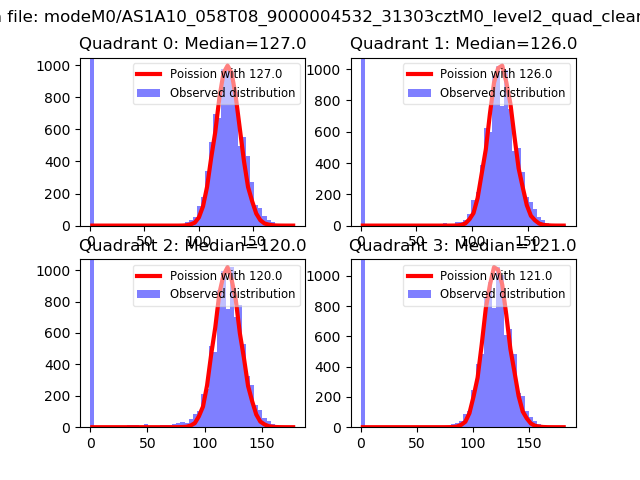 |
 |
| Quadrant-wise count rates Data is divided into 100 sec bins |
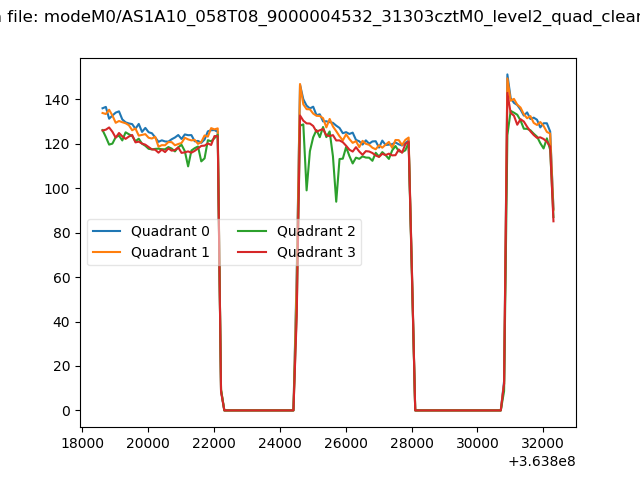 |
|
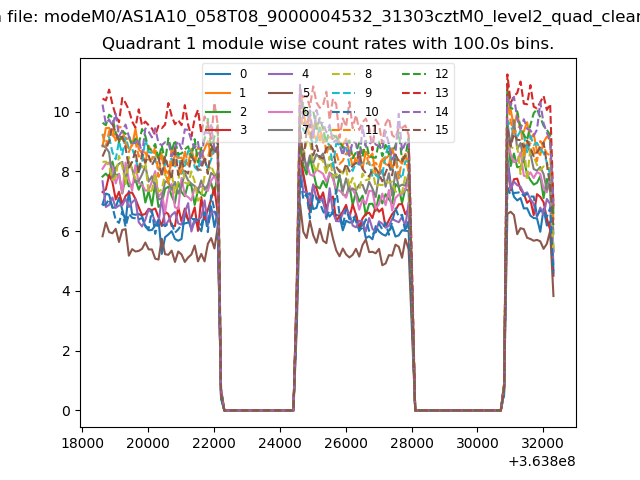
| Module-wise count rates for Quadrant A Data is divided into 100 sec bins |
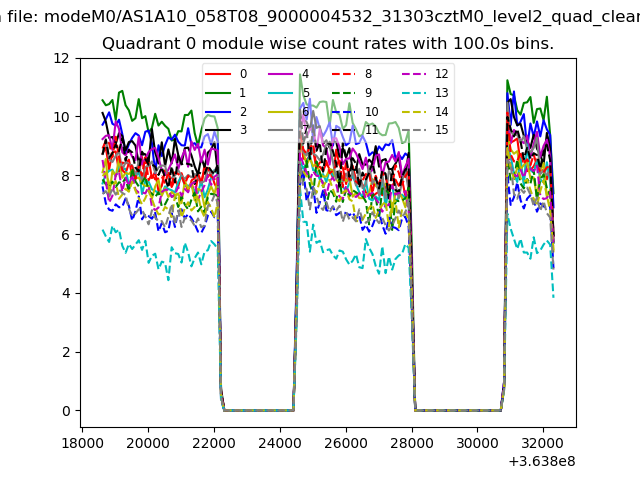 |
 |
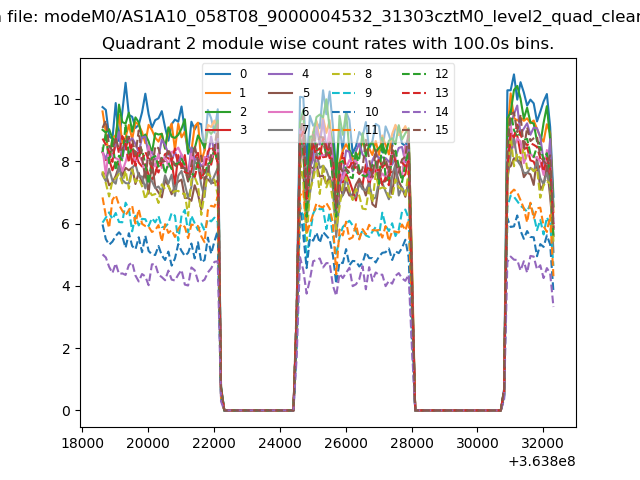
| Module-wise count rates for Quadrant B Data is divided into 100 sec bins |
 |
 |
| Module-wise count rates for Quadrant C Data is divided into 100 sec bins |
 |
 |
| Module-wise count rates for Quadrant D Data is divided into 100 sec bins |
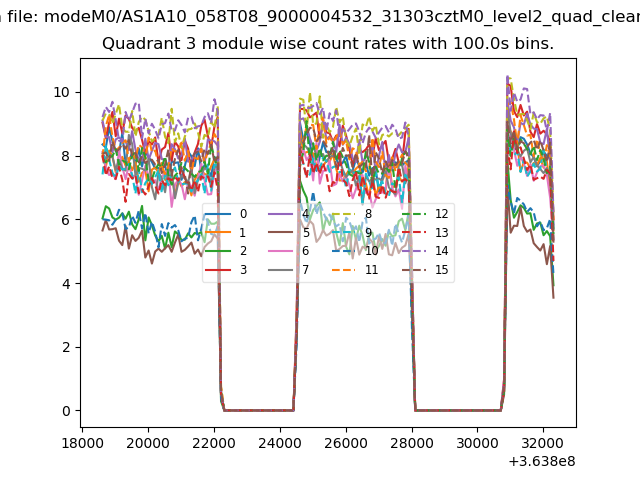 |
 |
| Parameter | Plot |
|---|---|
| CZT HV Monitor | 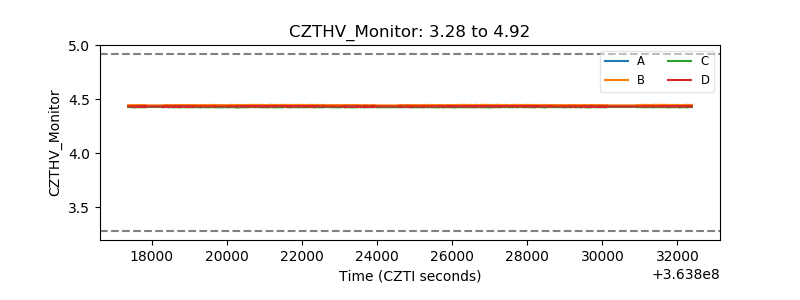 |
| D_VDD | 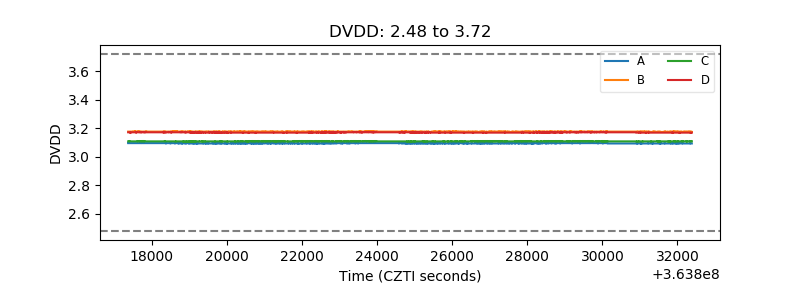 |
| Temperature 1 | 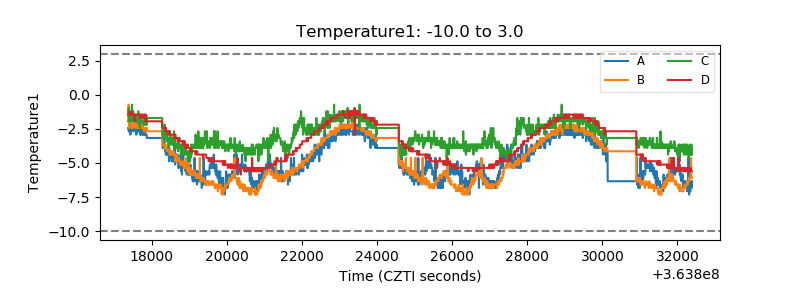 |
| Veto HV Monitor | 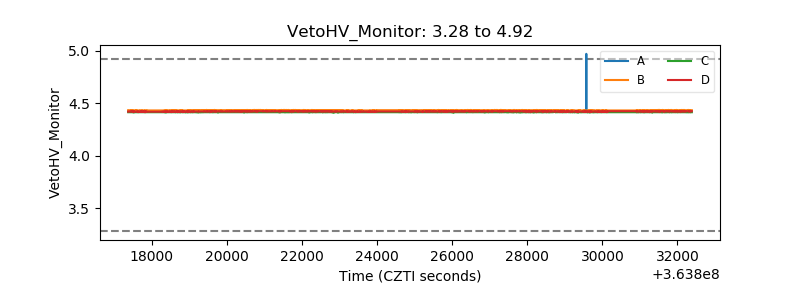 |
| Veto LLD | 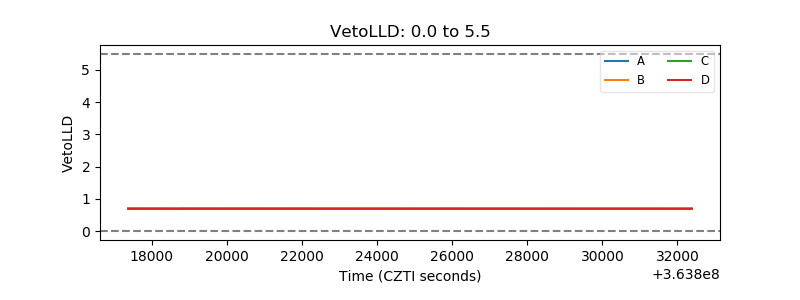 |
| Alpha Counter | 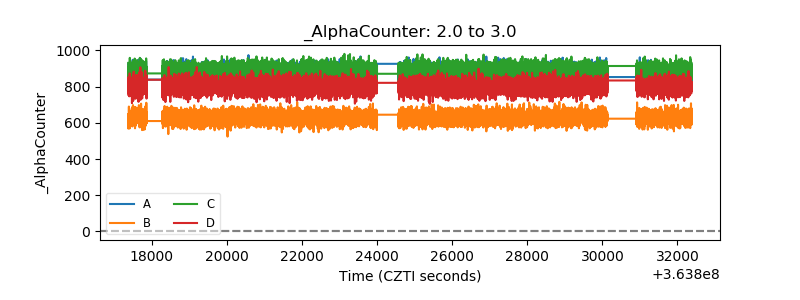 |
| _CPM_Rate | 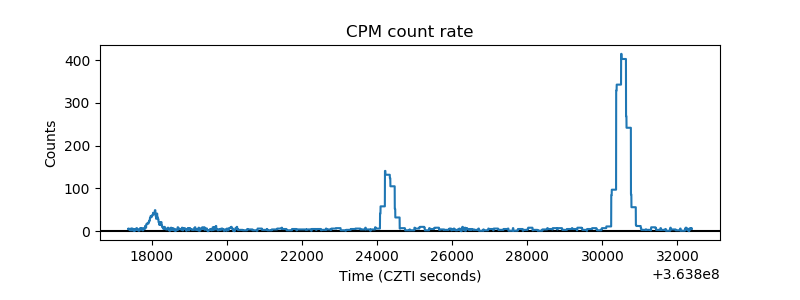 |
| CZT Counter | 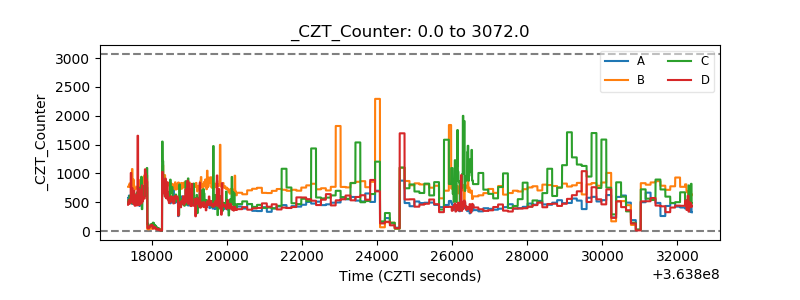 |
| +2.5 Volts monitor |  |
| +5 Volts monitor |  |
| _ROLL_ROT | 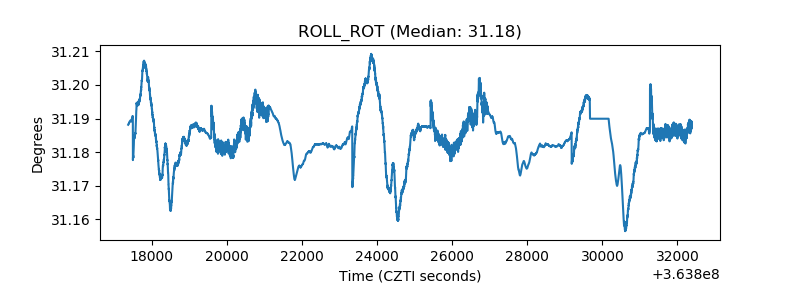 |
| _Roll_DEC | 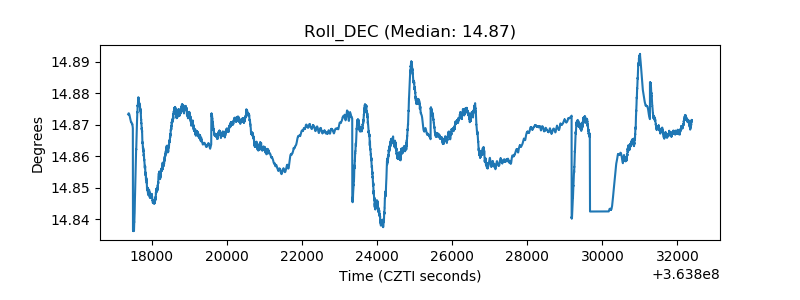 |
| _Roll_RA | 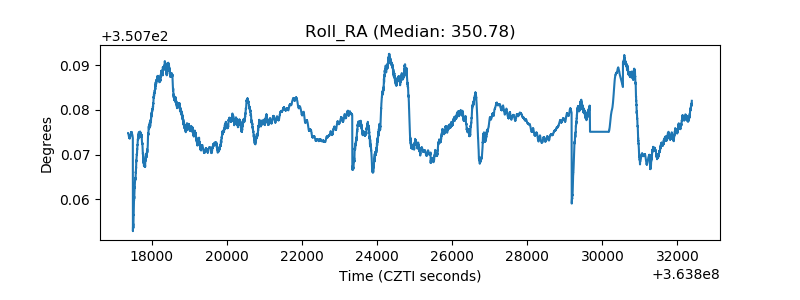 |
| Veto Counter | 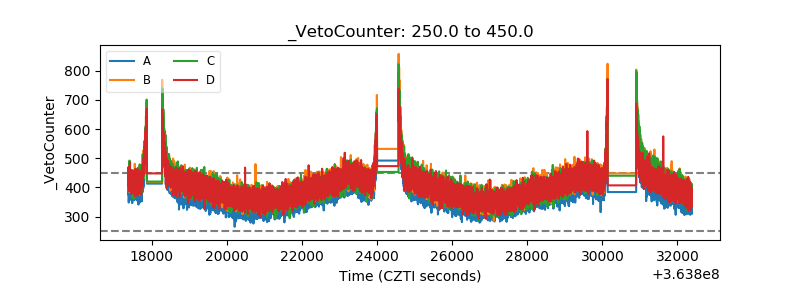 |