| Param | Original file | Final file |
|---|---|---|
| Filename | modeM0/AS1A10_058T08_9000004532_31304cztM0_level2.evt | modeM0/AS1A10_058T08_9000004532_31304cztM0_level2_quad_clean.evt |
| Size (bytes) | 569,612,160 | 92,897,280 |
| Size | 543.2 MB | 88.6 MB |
| Events in quadrant A | 3,212,350 | 601,198 |
| Events in quadrant B | 5,254,052 | 596,678 |
| Events in quadrant C | 4,956,542 | 566,137 |
| Events in quadrant D | 3,367,209 | 575,299 |
| Mode M0 | |||
|---|---|---|---|
| Quadrant | BADHDUFLAG | Total packets | Discarded packets |
| A | 0 | 13969 | 2 |
| B | 0 | 20805 | 2 |
| C | 0 | 19410 | 2 |
| D | 0 | 14559 | 2 |
| Mode M9 | |||
|---|---|---|---|
| Quadrant | BADHDUFLAG | Total packets | Discarded packets |
| A | 0 | 9 | 0 |
| B | 0 | 9 | 0 |
| C | 0 | 9 | 0 |
| D | 0 | 9 | 0 |
| Mode SS | |||
|---|---|---|---|
| Quadrant | BADHDUFLAG | Total packets | Discarded packets |
| A | 0 | 138 | 0 |
| B | 0 | 138 | 0 |
| C | 0 | 138 | 0 |
| D | 0 | 138 | 0 |
| Quadrant | Total seconds | Saturated seconds | Saturation percentage |
|---|---|---|---|
| A | 6802 | 34 | 0.499853% |
| B | 6802 | 109 | 1.602470% |
| C | 6802 | 405 | 5.954131% |
| D | 6803 | 34 | 0.499780% |
Noise dominated data is calculated using 1-second bins in cleaned event files. If a bin has >2000 counts, and if more than 50% of those come from <1% of pixels, then it is considered to be noise-dominated and hence unusable.
| Quadrant | # 1 sec bins | Bins with >0 counts | Bins with >2000 counts | High rate bins dominated by noise | Noise dominated (total time) | Noise dominated (detector-on time) | Marked lightcurve |
|---|---|---|---|---|---|---|---|
| A | 7702 | 6803 | 0 | 0 | 0.00% | 0.00% | 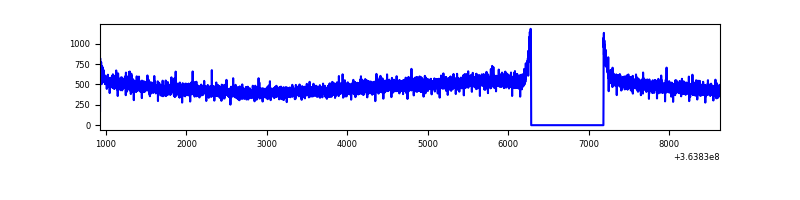 |
| B | 7702 | 6803 | 3 | 3 | 0.04% | 0.04% | 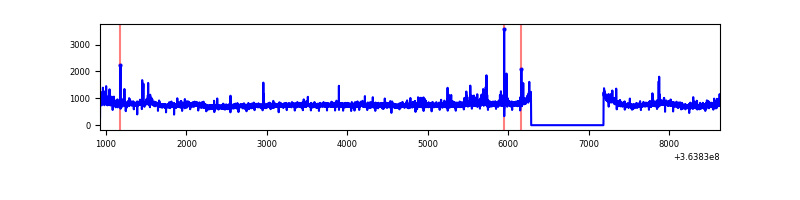 |
| C | 7702 | 6803 | 10 | 10 | 0.13% | 0.15% | 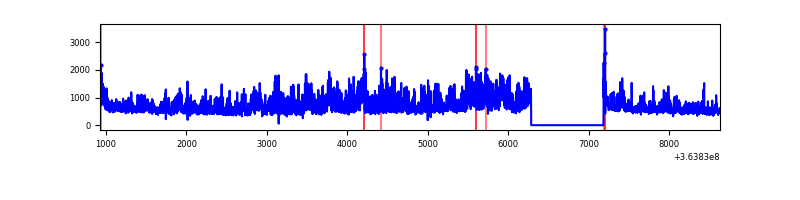 |
| D | 7703 | 6804 | 9 | 9 | 0.12% | 0.13% | 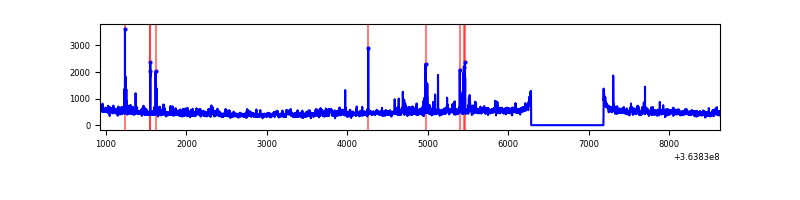 |
Top three noisy pixels from each quadrant. If the there are fewer than three noisy pixels in the level2.evt file, extra rows are filled as -1
| Pixel properties | Quadrant properties | ||||||
|---|---|---|---|---|---|---|---|
| Quadrant | DetID | PixID | Counts | Sigma | Mean | Median | Sigma |
| A | 13 | 254 | 11760 | 65.27 | 832 | 813 | 167.7 |
| A | 3 | 137 | 8700 | 47.03 | 832 | 813 | 167.7 |
| A | 0 | 226 | 6804 | 35.72 | 832 | 813 | 167.7 |
| B | 6 | 159 | 1872694 | 11837.95 | 821 | 800 | 158.1 |
| B | 4 | 80 | 116842 | 733.86 | 821 | 800 | 158.1 |
| B | 12 | 111 | 20137 | 122.29 | 821 | 800 | 158.1 |
| C | 3 | 233 | 1558072 | 8351.65 | 786 | 789 | 186.5 |
| C | 14 | 238 | 182761 | 975.91 | 786 | 789 | 186.5 |
| C | 14 | 254 | 81165 | 431.05 | 786 | 789 | 186.5 |
| D | 8 | 195 | 233751 | 1131.6 | 798 | 782 | 205.9 |
| D | 2 | 250 | 52097 | 249.25 | 798 | 782 | 205.9 |
| D | 12 | 218 | 34687 | 164.69 | 798 | 782 | 205.9 |
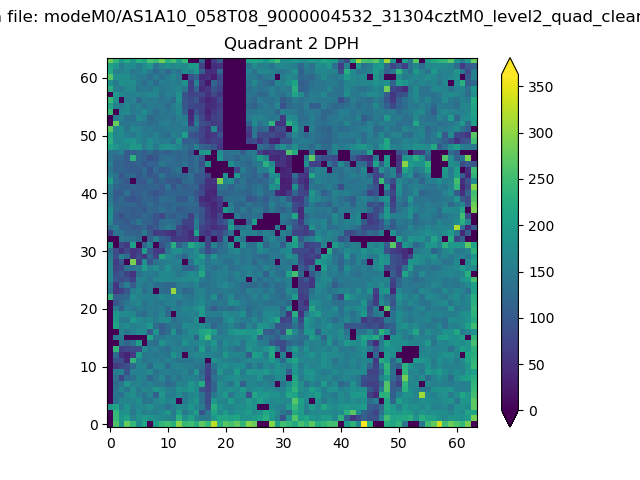
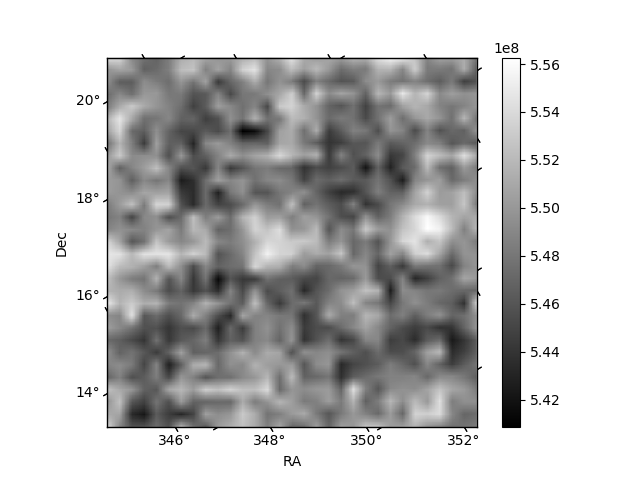
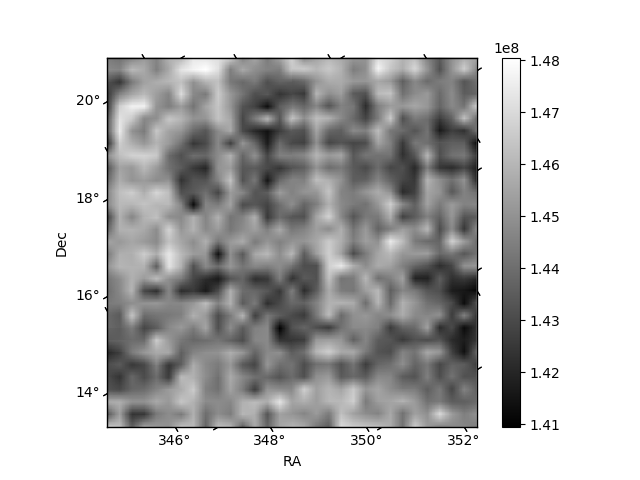
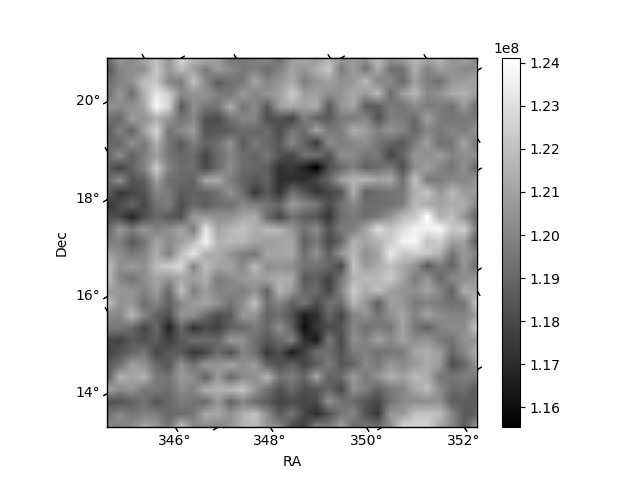
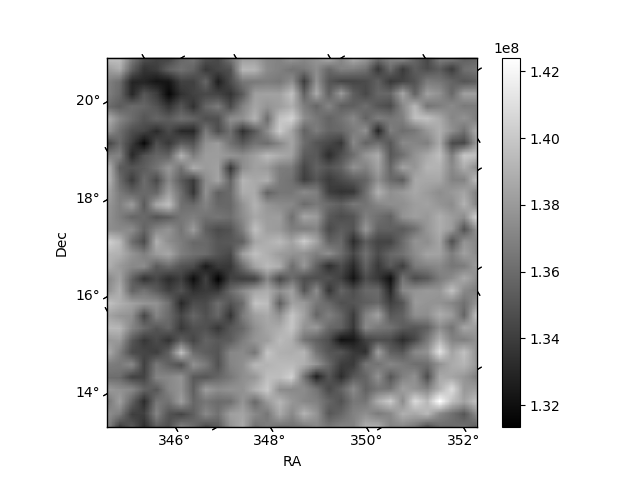
Histogram calculated using DETX and DETY for each event in the final _common_clean file
| Quadrant A | 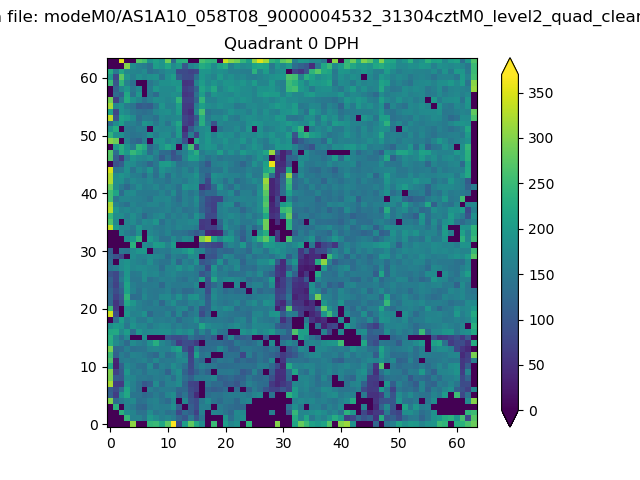 |
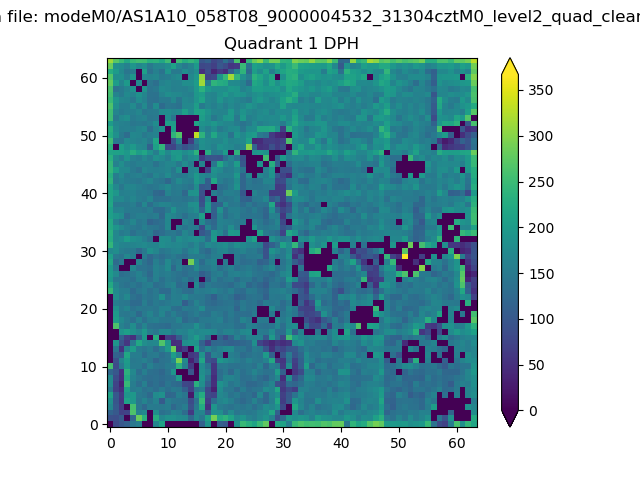 |
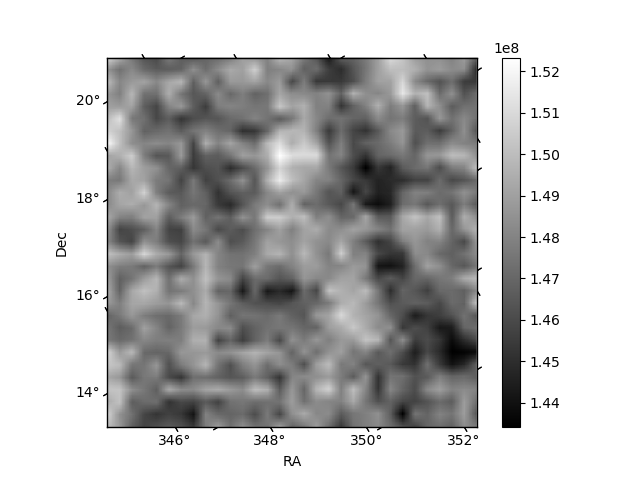
Quadrant B |
|---|---|---|---|
| Quadrant D | 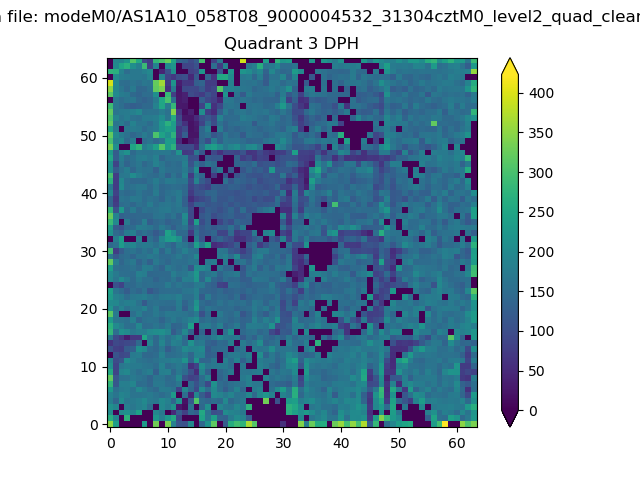 |
 |
Quadrant C |
| Plot type | Count rate plots | Images |
|---|---|---|
| Comparison with Poisson distribution Blue bars denote a histogram of data divided into 1 sec bins. Red curve is a Poisson curve with rate = median count rate of data. |
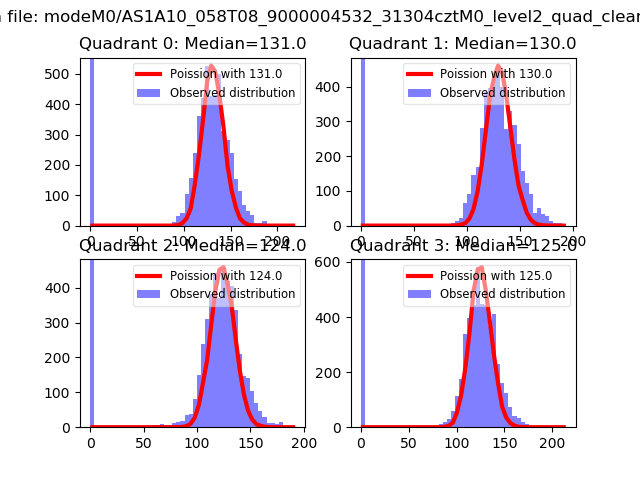 |
 |
| Quadrant-wise count rates Data is divided into 100 sec bins |
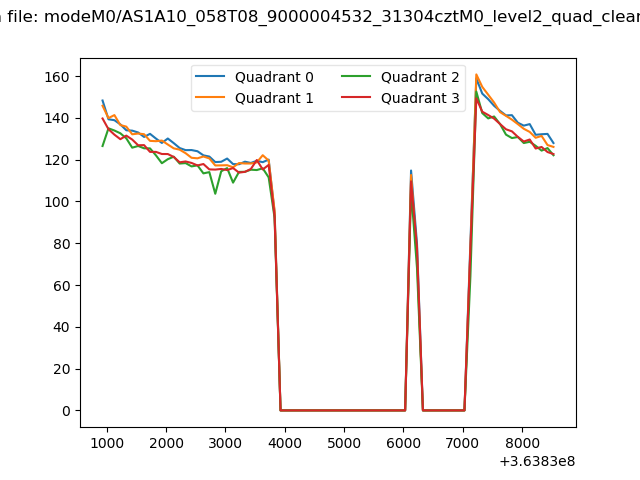 |
|
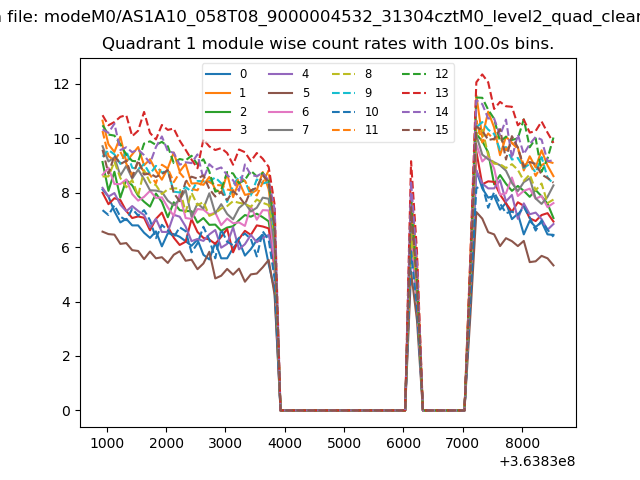
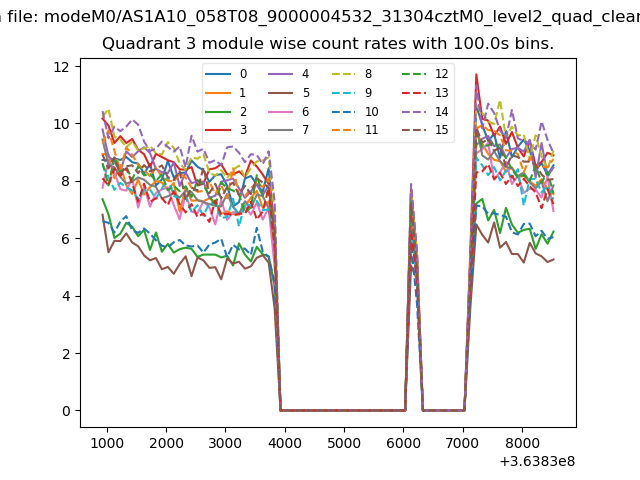
| Module-wise count rates for Quadrant A Data is divided into 100 sec bins |
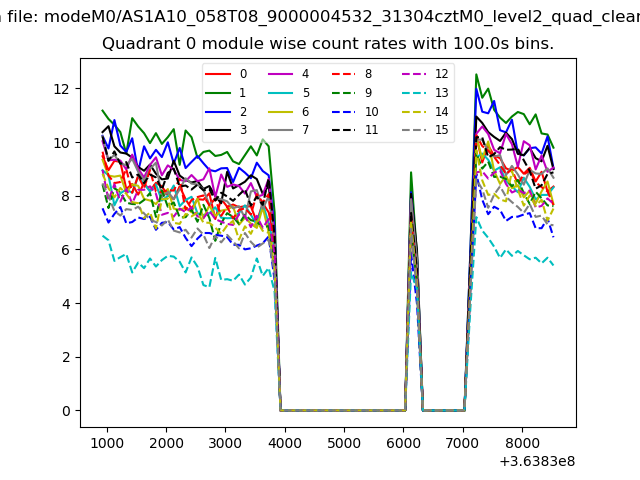 |
 |
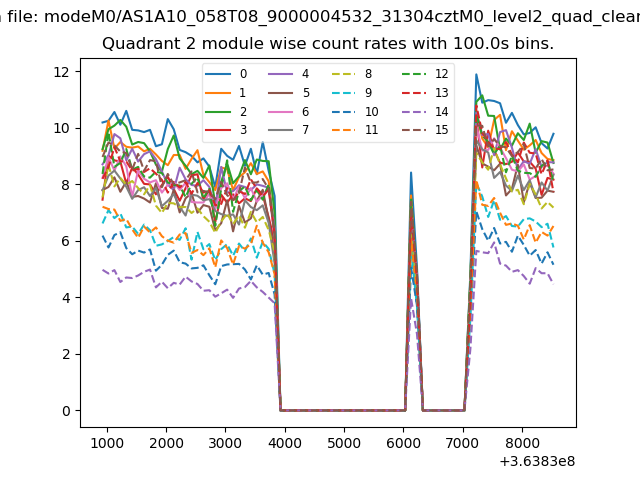
| Module-wise count rates for Quadrant B Data is divided into 100 sec bins |
 |
 |
| Module-wise count rates for Quadrant C Data is divided into 100 sec bins |
 |
 |
| Module-wise count rates for Quadrant D Data is divided into 100 sec bins |
 |
 |
| Parameter | Plot |
|---|---|
| CZT HV Monitor | 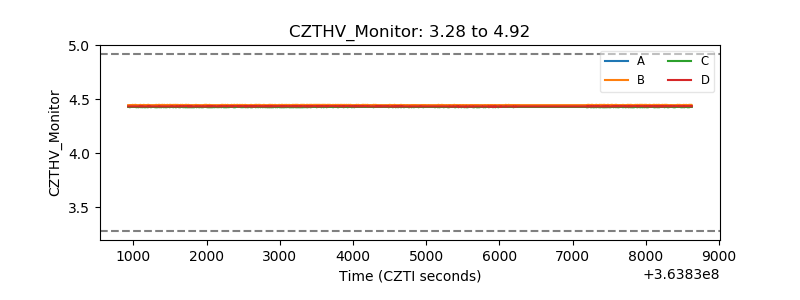 |
| D_VDD |  |
| Temperature 1 | 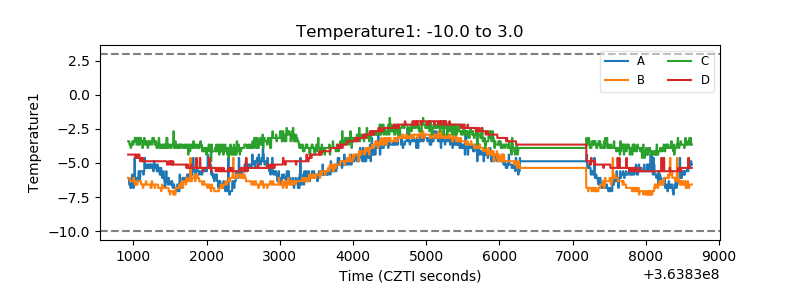 |
| Veto HV Monitor | 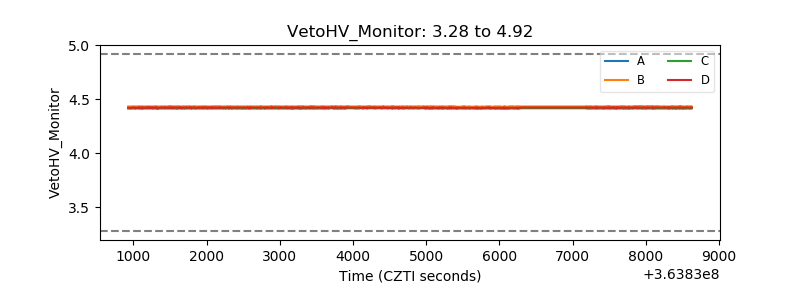 |
| Veto LLD | 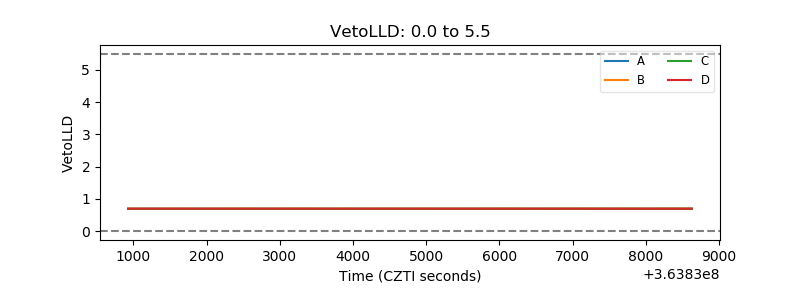 |
| Alpha Counter | 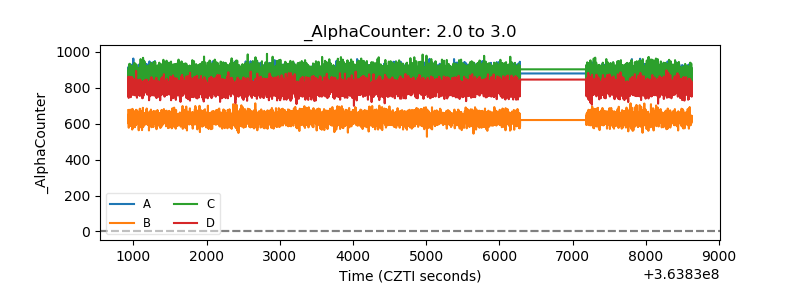 |
| _CPM_Rate | 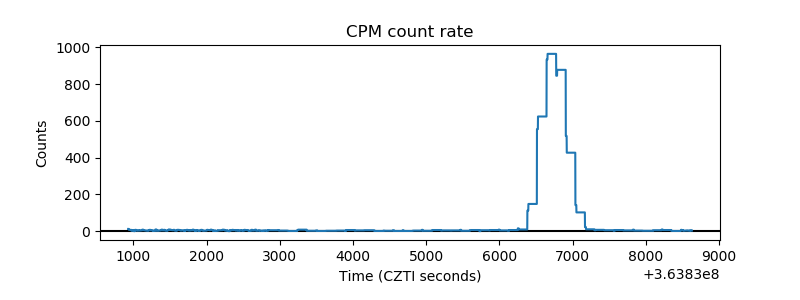 |
| CZT Counter | 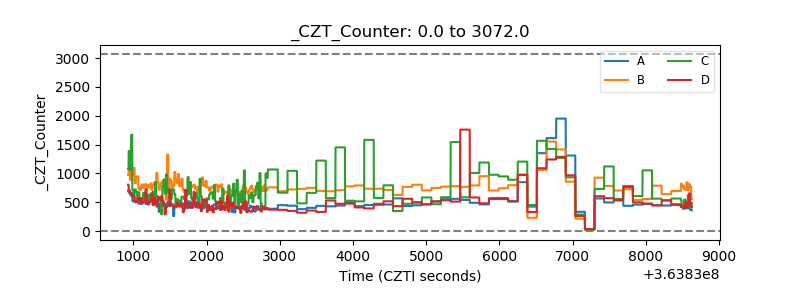 |
| +2.5 Volts monitor |  |
| +5 Volts monitor |  |
| _ROLL_ROT | 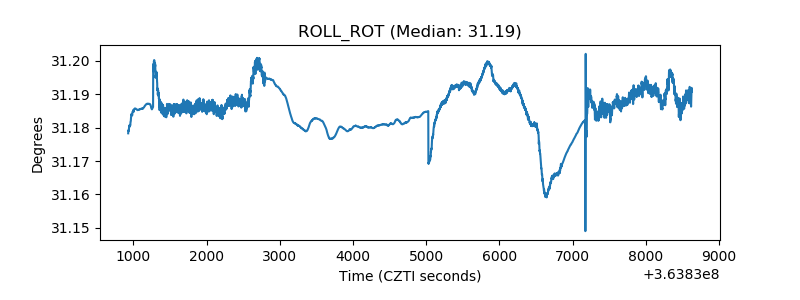 |
| _Roll_DEC | 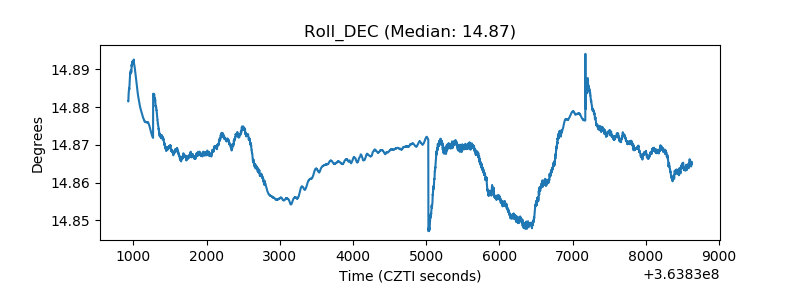 |
| _Roll_RA | 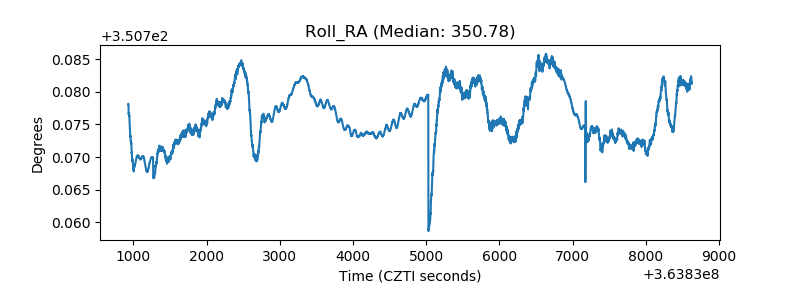 |
| Veto Counter | 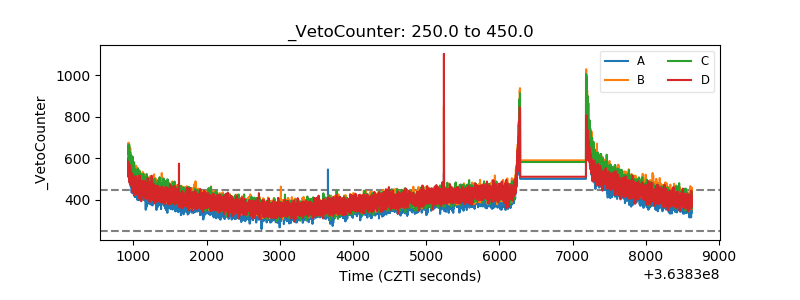 |