| Param | Original file | Final file |
|---|---|---|
| Filename | modeM0/AS1A10_058T08_9000004532_31305cztM0_level2.evt | modeM0/AS1A10_058T08_9000004532_31305cztM0_level2_quad_clean.evt |
| Size (bytes) | 537,284,160 | 94,584,960 |
| Size | 512.4 MB | 90.2 MB |
| Events in quadrant A | 3,217,889 | 619,549 |
| Events in quadrant B | 5,241,896 | 612,247 |
| Events in quadrant C | 3,806,778 | 580,925 |
| Events in quadrant D | 3,556,107 | 589,628 |
| Mode M0 | |||
|---|---|---|---|
| Quadrant | BADHDUFLAG | Total packets | Discarded packets |
| A | 0 | 13704 | 2 |
| B | 0 | 20627 | 2 |
| C | 0 | 15422 | 2 |
| D | 0 | 15014 | 3 |
| Mode M9 | |||
|---|---|---|---|
| Quadrant | BADHDUFLAG | Total packets | Discarded packets |
| A | 0 | 14 | 0 |
| B | 0 | 15 | 0 |
| C | 0 | 15 | 0 |
| D | 0 | 15 | 0 |
| Mode SS | |||
|---|---|---|---|
| Quadrant | BADHDUFLAG | Total packets | Discarded packets |
| A | 0 | 134 | 0 |
| B | 0 | 134 | 0 |
| C | 0 | 134 | 0 |
| D | 0 | 134 | 0 |
| Quadrant | Total seconds | Saturated seconds | Saturation percentage |
|---|---|---|---|
| A | 6628 | 42 | 0.633675% |
| B | 6628 | 159 | 2.398914% |
| C | 6628 | 173 | 2.610139% |
| D | 6627 | 34 | 0.513053% |
Noise dominated data is calculated using 1-second bins in cleaned event files. If a bin has >2000 counts, and if more than 50% of those come from <1% of pixels, then it is considered to be noise-dominated and hence unusable.
| Quadrant | # 1 sec bins | Bins with >0 counts | Bins with >2000 counts | High rate bins dominated by noise | Noise dominated (total time) | Noise dominated (detector-on time) | Marked lightcurve |
|---|---|---|---|---|---|---|---|
| A | 7678 | 6629 | 0 | 0 | 0.00% | 0.00% |  |
| B | 7678 | 6629 | 29 | 29 | 0.38% | 0.44% | 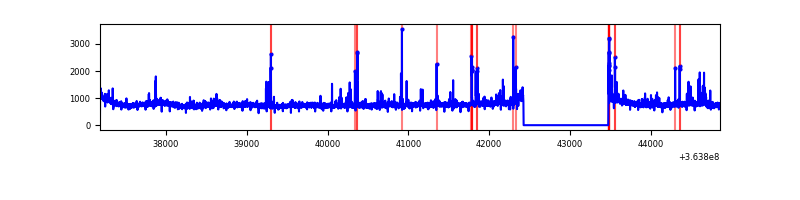 |
| C | 7678 | 6629 | 27 | 27 | 0.35% | 0.41% | 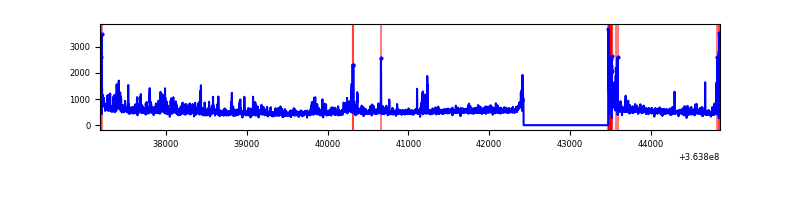 |
| D | 7677 | 6628 | 3 | 3 | 0.04% | 0.05% |  |
Top three noisy pixels from each quadrant. If the there are fewer than three noisy pixels in the level2.evt file, extra rows are filled as -1
| Pixel properties | Quadrant properties | ||||||
|---|---|---|---|---|---|---|---|
| Quadrant | DetID | PixID | Counts | Sigma | Mean | Median | Sigma |
| A | 13 | 254 | 10859 | 60.24 | 834 | 817 | 166.7 |
| A | 3 | 137 | 8644 | 46.95 | 834 | 817 | 166.7 |
| A | 0 | 226 | 6991 | 37.04 | 834 | 817 | 166.7 |
| B | 6 | 159 | 1723861 | 10942.84 | 817 | 797 | 157.5 |
| B | 4 | 80 | 177589 | 1122.77 | 817 | 797 | 157.5 |
| B | 15 | 33 | 102099 | 643.35 | 817 | 797 | 157.5 |
| C | 3 | 233 | 457218 | 2474.57 | 785 | 790 | 184.4 |
| C | 0 | 10 | 137330 | 740.27 | 785 | 790 | 184.4 |
| C | 14 | 238 | 129031 | 695.27 | 785 | 790 | 184.4 |
| D | 8 | 195 | 498557 | 2454.57 | 796 | 778 | 202.8 |
| D | 2 | 234 | 21963 | 104.46 | 796 | 778 | 202.8 |
| D | 2 | 250 | 19541 | 92.52 | 796 | 778 | 202.8 |
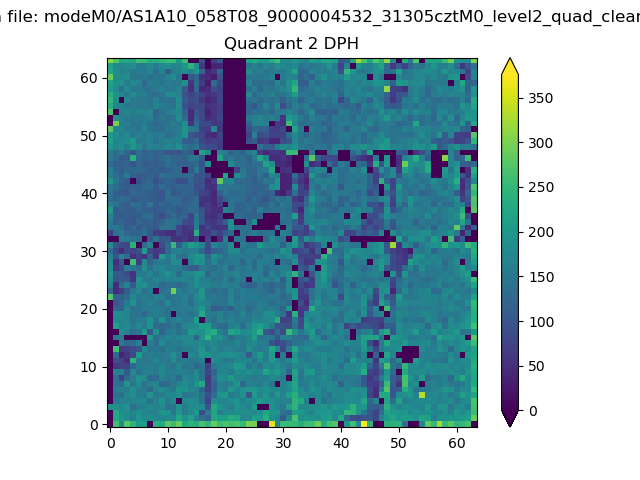
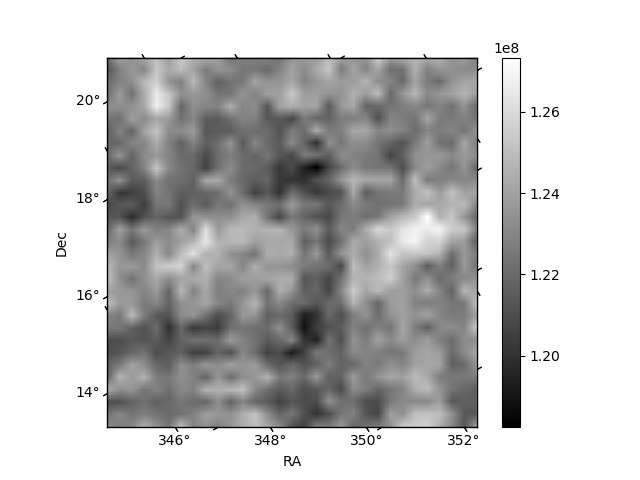
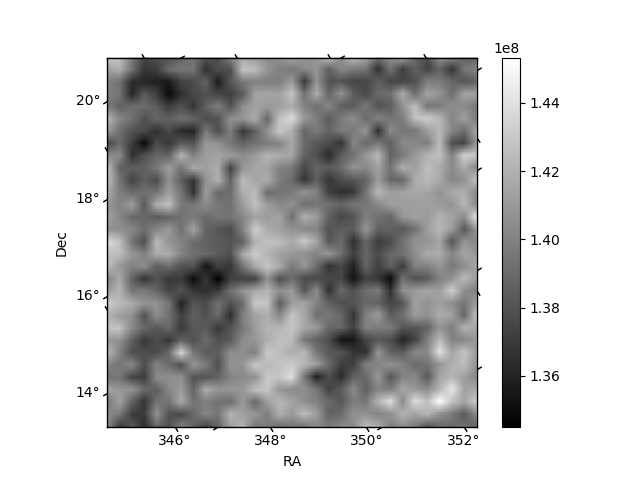
Histogram calculated using DETX and DETY for each event in the final _common_clean file
| Quadrant A | 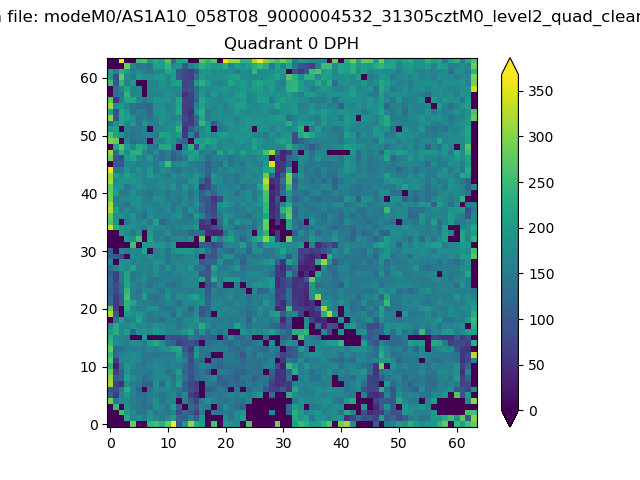 |
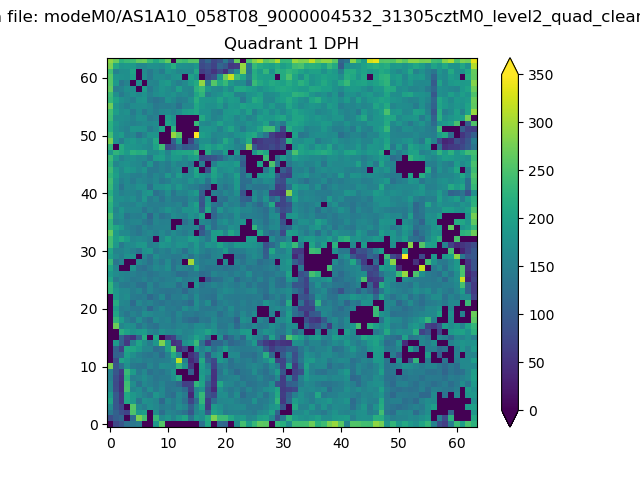 |
Quadrant B |
|---|---|---|---|
| Quadrant D | 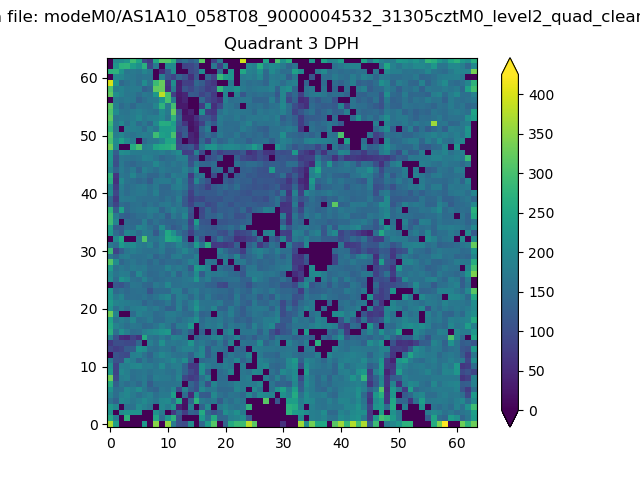 |
 |
Quadrant C |
| Plot type | Count rate plots | Images |
|---|---|---|
| Comparison with Poisson distribution Blue bars denote a histogram of data divided into 1 sec bins. Red curve is a Poisson curve with rate = median count rate of data. |
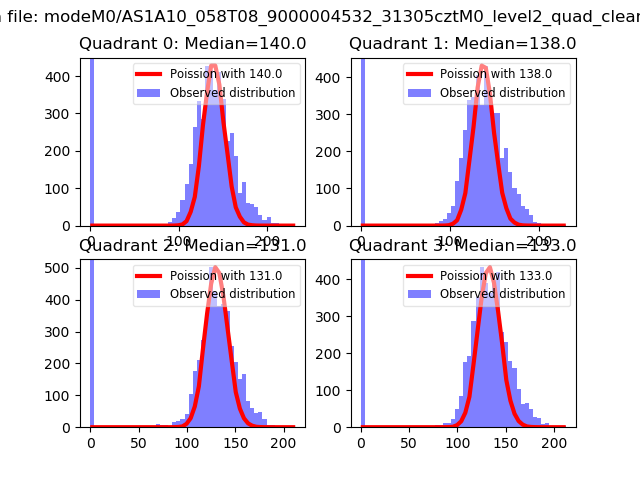 |
 |
| Quadrant-wise count rates Data is divided into 100 sec bins |
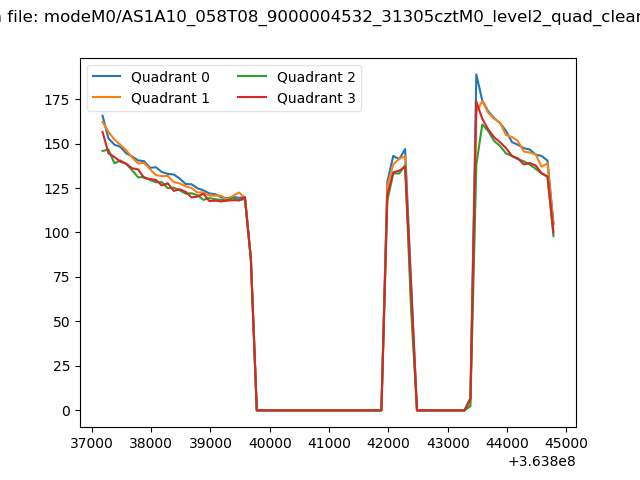 |
|
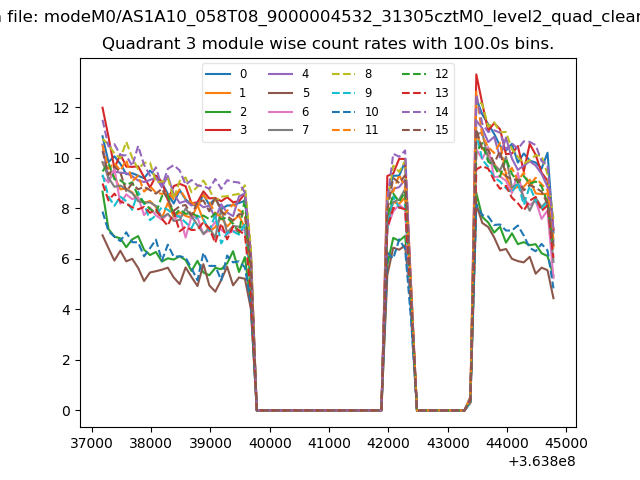
| Module-wise count rates for Quadrant A Data is divided into 100 sec bins |
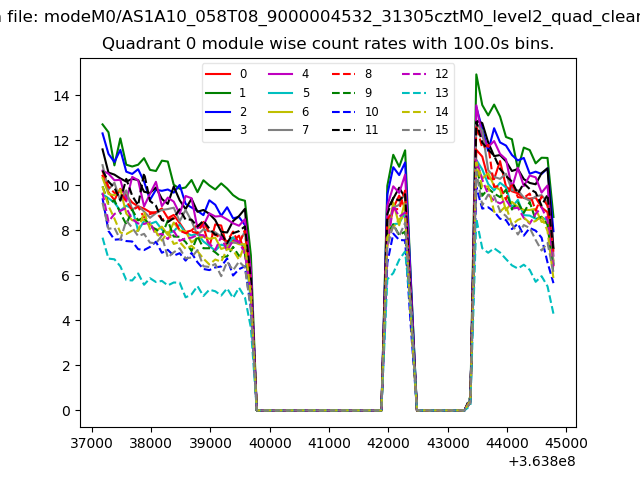 |
 |
| Module-wise count rates for Quadrant B Data is divided into 100 sec bins |
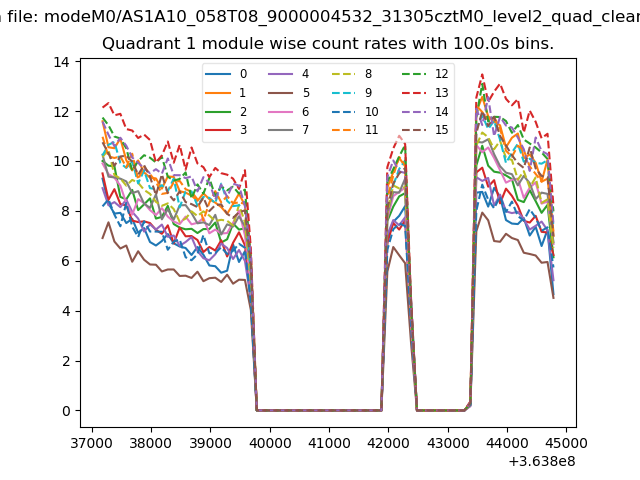 |
 |
| Module-wise count rates for Quadrant C Data is divided into 100 sec bins |
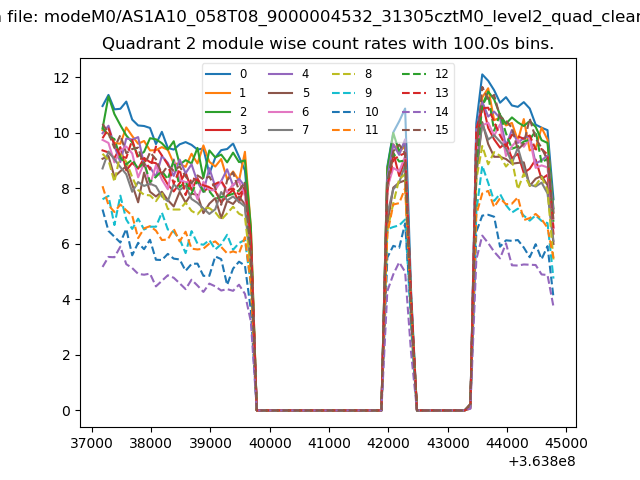 |
 |
| Module-wise count rates for Quadrant D Data is divided into 100 sec bins |
 |
 |
| Parameter | Plot |
|---|---|
| CZT HV Monitor | 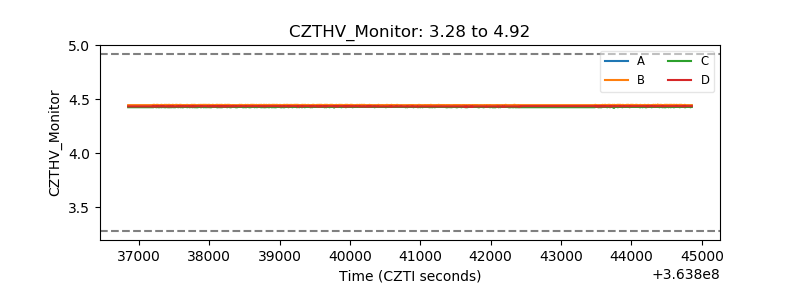 |
| D_VDD |  |
| Temperature 1 | 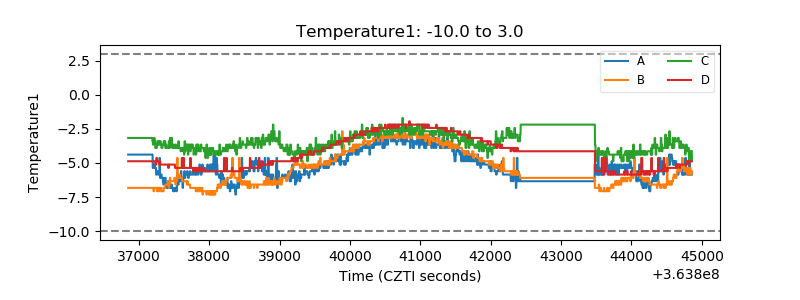 |
| Veto HV Monitor | 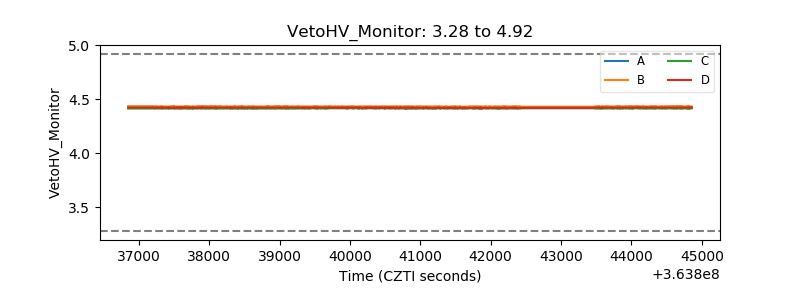 |
| Veto LLD | 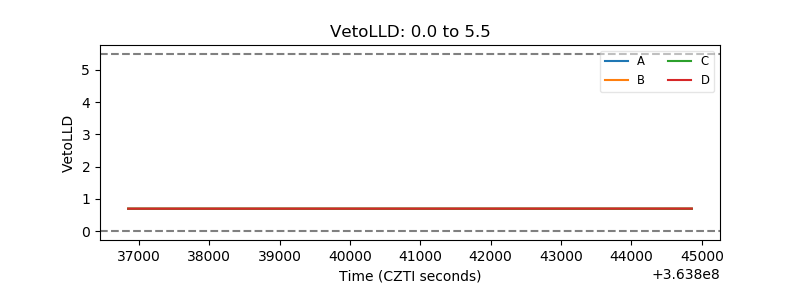 |
| Alpha Counter | 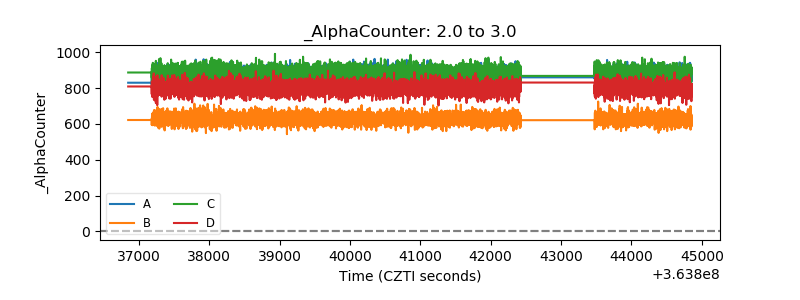 |
| _CPM_Rate | 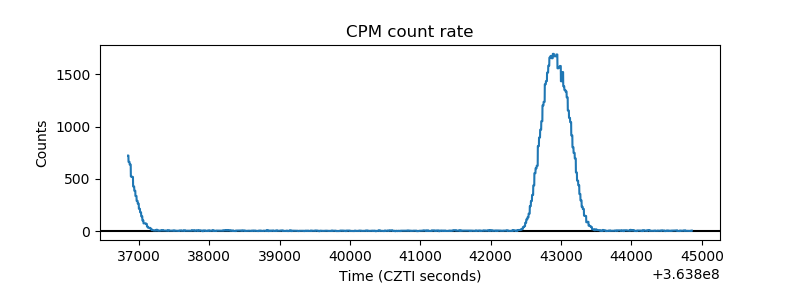 |
| CZT Counter | 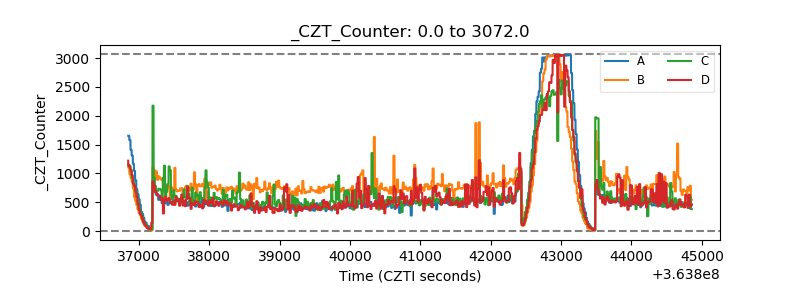 |
| +2.5 Volts monitor |  |
| +5 Volts monitor |  |
| _ROLL_ROT | 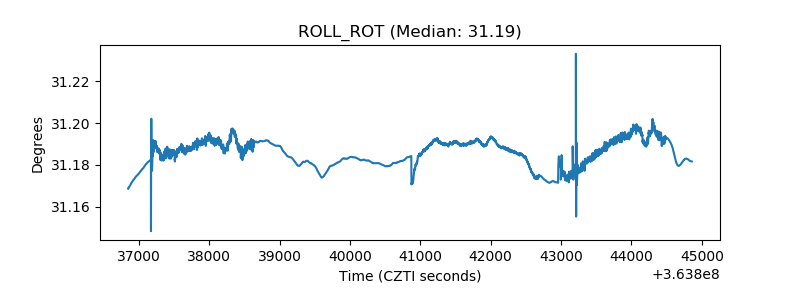 |
| _Roll_DEC | 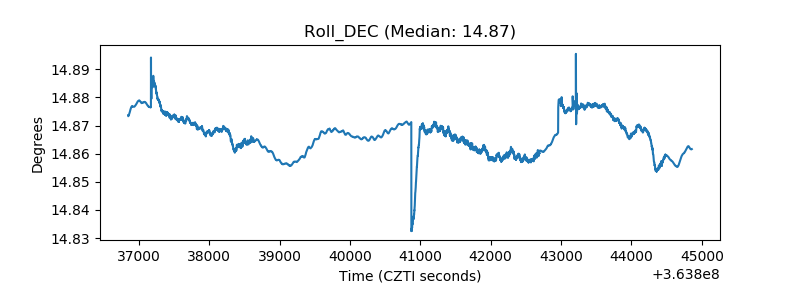 |
| _Roll_RA | 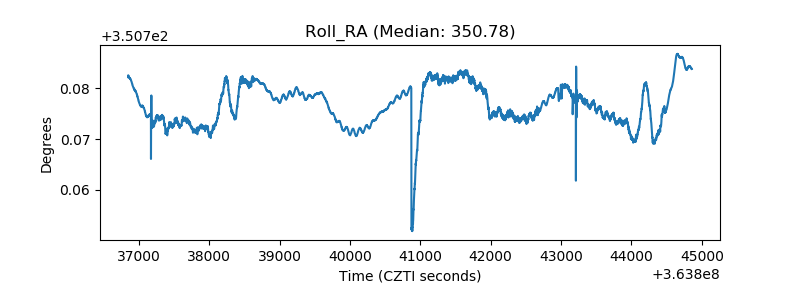 |
| Veto Counter | 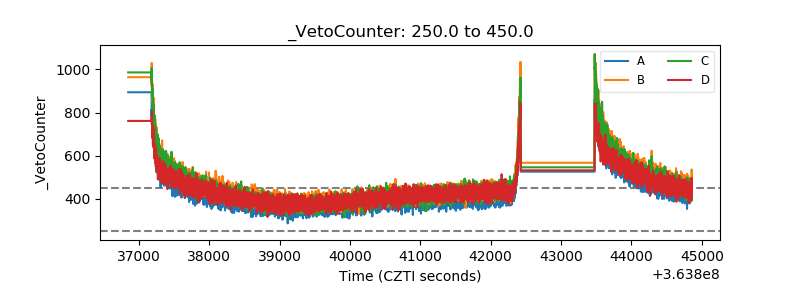 |