| Param | Original file | Final file |
|---|---|---|
| Filename | modeM0/AS1A10_058T08_9000004532_31308cztM0_level2.evt | modeM0/AS1A10_058T08_9000004532_31308cztM0_level2_quad_clean.evt |
| Size (bytes) | 908,832,960 | 149,673,600 |
| Size | 866.7 MB | 142.7 MB |
| Events in quadrant A | 5,627,990 | 982,989 |
| Events in quadrant B | 8,735,894 | 971,206 |
| Events in quadrant C | 5,979,117 | 916,724 |
| Events in quadrant D | 6,445,181 | 907,257 |
| Mode M0 | |||
|---|---|---|---|
| Quadrant | BADHDUFLAG | Total packets | Discarded packets |
| A | 0 | 23106 | 2 |
| B | 0 | 33595 | 2 |
| C | 0 | 24371 | 2 |
| D | 0 | 26087 | 2 |
| Mode M9 | |||
|---|---|---|---|
| Quadrant | BADHDUFLAG | Total packets | Discarded packets |
| A | 0 | 24 | 0 |
| B | 0 | 24 | 0 |
| C | 0 | 24 | 0 |
| D | 0 | 24 | 0 |
| Mode SS | |||
|---|---|---|---|
| Quadrant | BADHDUFLAG | Total packets | Discarded packets |
| A | 0 | 224 | 0 |
| B | 0 | 224 | 0 |
| C | 0 | 224 | 0 |
| D | 0 | 224 | 0 |
| Quadrant | Total seconds | Saturated seconds | Saturation percentage |
|---|---|---|---|
| A | 10896 | 93 | 0.853524% |
| B | 10896 | 199 | 1.826358% |
| C | 10896 | 180 | 1.651982% |
| D | 10896 | 181 | 1.661160% |
Noise dominated data is calculated using 1-second bins in cleaned event files. If a bin has >2000 counts, and if more than 50% of those come from <1% of pixels, then it is considered to be noise-dominated and hence unusable.
| Quadrant | # 1 sec bins | Bins with >0 counts | Bins with >2000 counts | High rate bins dominated by noise | Noise dominated (total time) | Noise dominated (detector-on time) | Marked lightcurve |
|---|---|---|---|---|---|---|---|
| A | 13352 | 10898 | 0 | 0 | 0.00% | 0.00% | 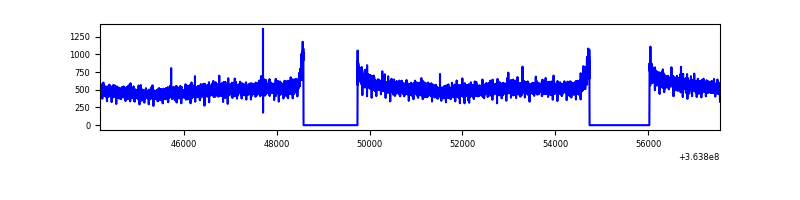 |
| B | 13352 | 10898 | 14 | 14 | 0.10% | 0.13% |  |
| C | 13352 | 10898 | 12 | 12 | 0.09% | 0.11% | 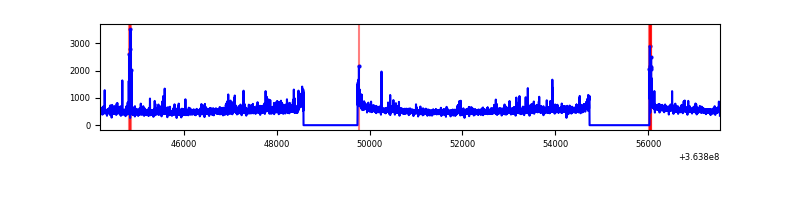 |
| D | 13352 | 10898 | 93 | 93 | 0.70% | 0.85% | 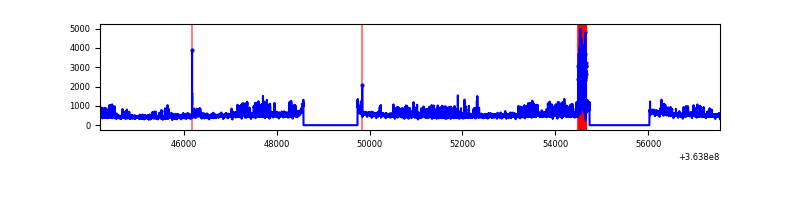 |
Top three noisy pixels from each quadrant. If the there are fewer than three noisy pixels in the level2.evt file, extra rows are filled as -1
| Pixel properties | Quadrant properties | ||||||
|---|---|---|---|---|---|---|---|
| Quadrant | DetID | PixID | Counts | Sigma | Mean | Median | Sigma |
| A | 13 | 254 | 18159 | 58.35 | 1459 | 1436 | 286.6 |
| A | 3 | 137 | 14037 | 43.97 | 1459 | 1436 | 286.6 |
| A | 0 | 226 | 12406 | 38.28 | 1459 | 1436 | 286.6 |
| B | 6 | 159 | 2840477 | 10562.69 | 1421 | 1389 | 268.8 |
| B | 4 | 80 | 167121 | 616.6 | 1421 | 1389 | 268.8 |
| B | 15 | 33 | 92045 | 337.28 | 1421 | 1389 | 268.8 |
| C | 3 | 233 | 333046 | 1049.25 | 1360 | 1371 | 316.1 |
| C | 14 | 238 | 224033 | 704.39 | 1360 | 1371 | 316.1 |
| C | 0 | 10 | 86269 | 268.57 | 1360 | 1371 | 316.1 |
| D | 8 | 195 | 900129 | 2530.09 | 1373 | 1348 | 355.2 |
| D | 1 | 52 | 300902 | 843.25 | 1373 | 1348 | 355.2 |
| D | 2 | 234 | 37050 | 100.5 | 1373 | 1348 | 355.2 |
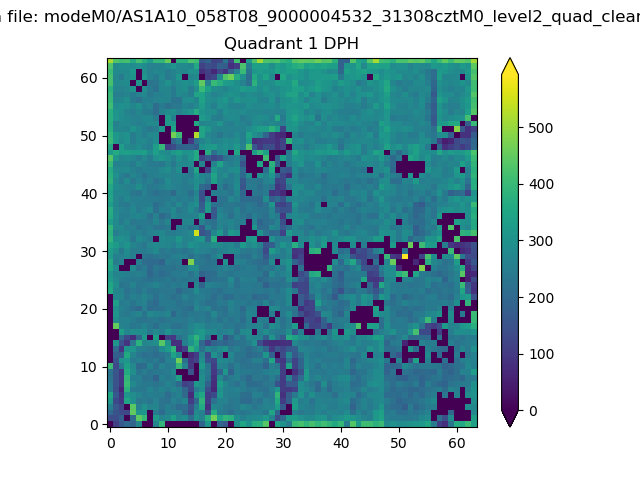
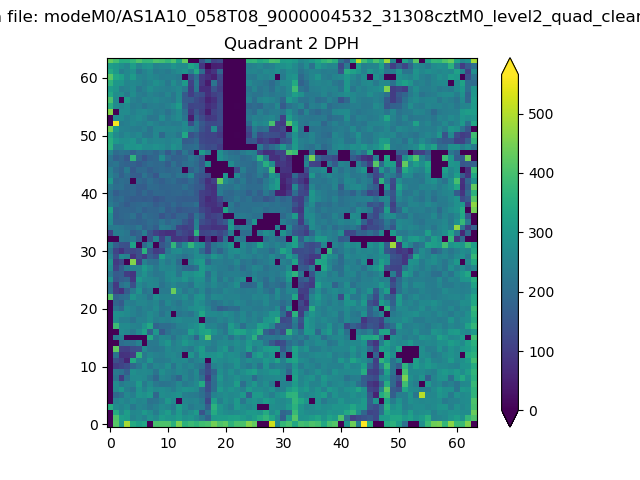
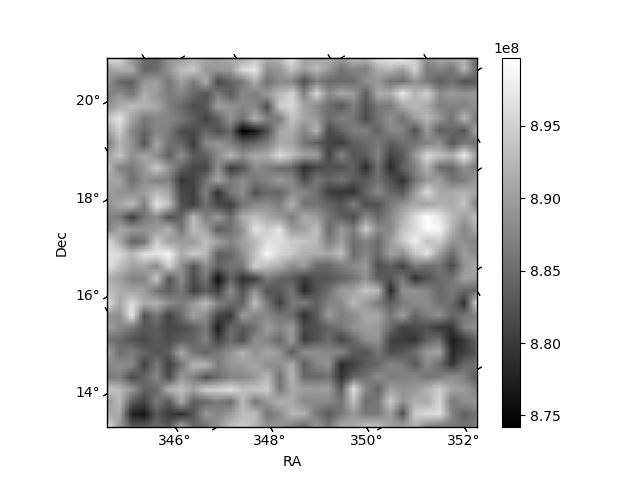
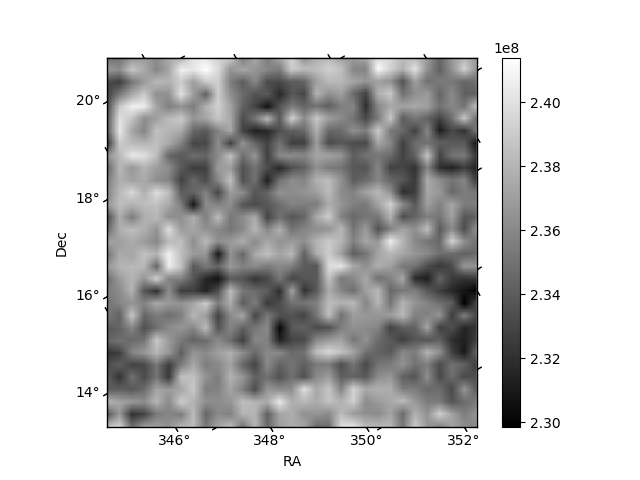
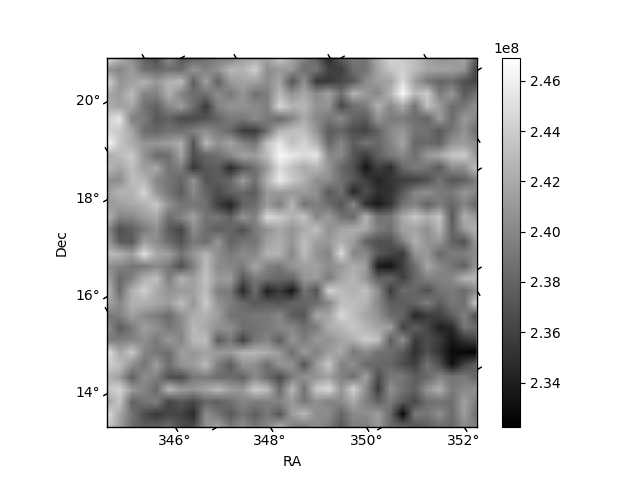
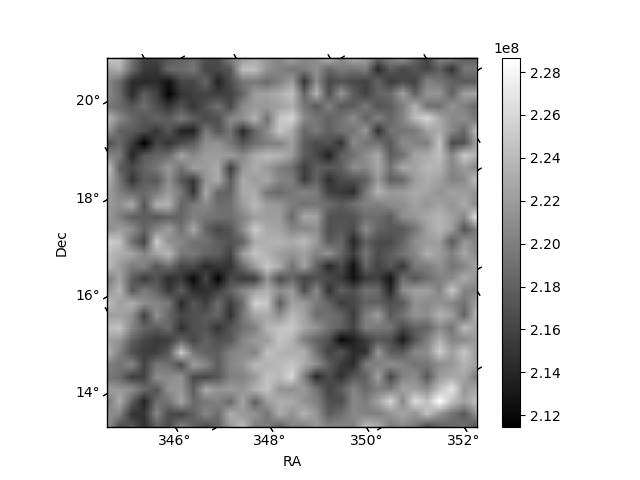
Histogram calculated using DETX and DETY for each event in the final _common_clean file
| Quadrant A | 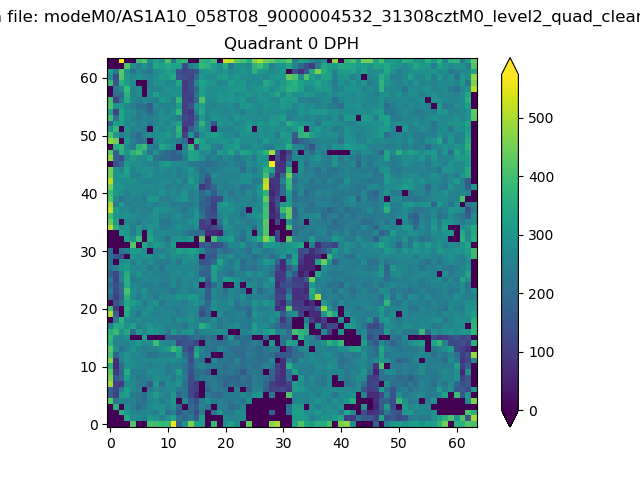 |
 |
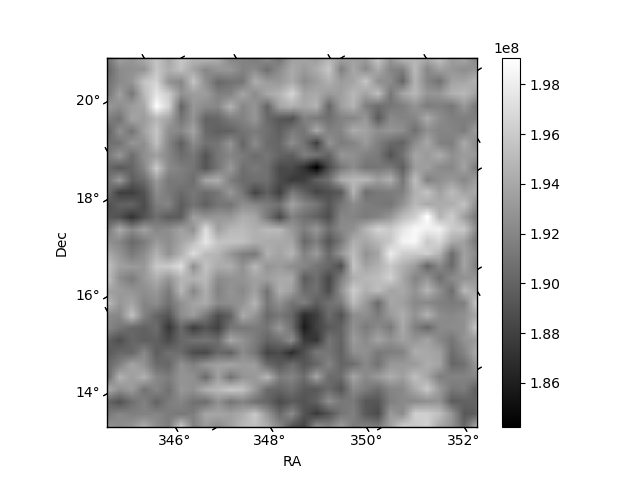
Quadrant B |
|---|---|---|---|
| Quadrant D | 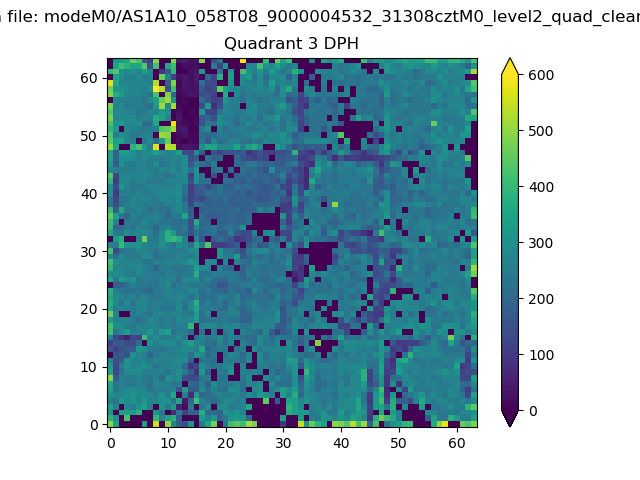 |
 |
Quadrant C |
| Plot type | Count rate plots | Images |
|---|---|---|
| Comparison with Poisson distribution Blue bars denote a histogram of data divided into 1 sec bins. Red curve is a Poisson curve with rate = median count rate of data. |
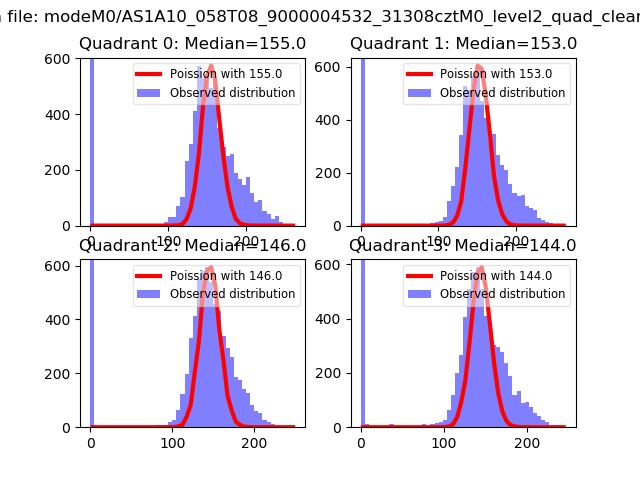 |
 |
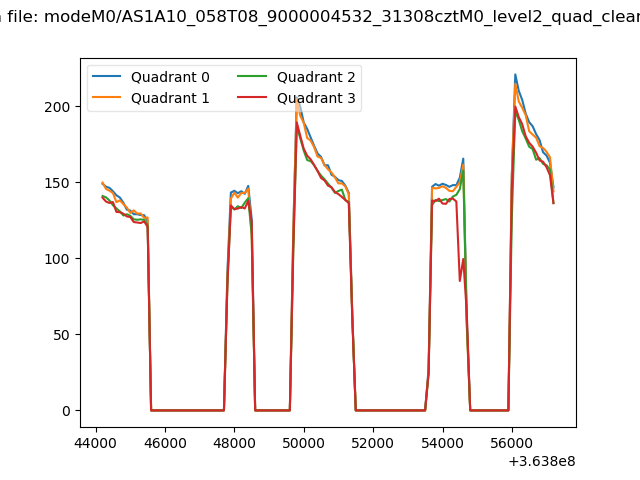
| Quadrant-wise count rates Data is divided into 100 sec bins |
 |
|
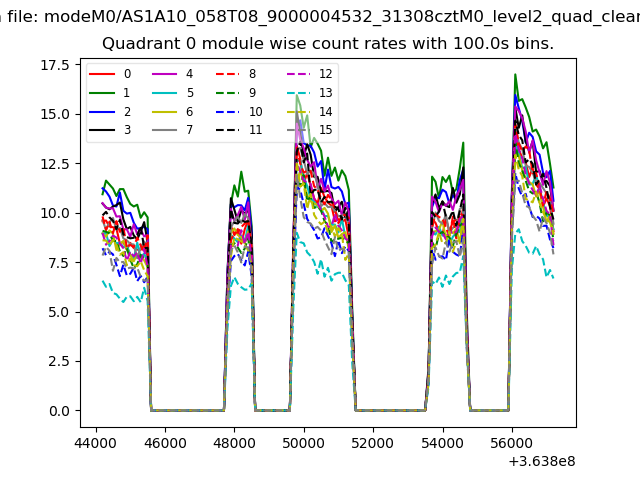
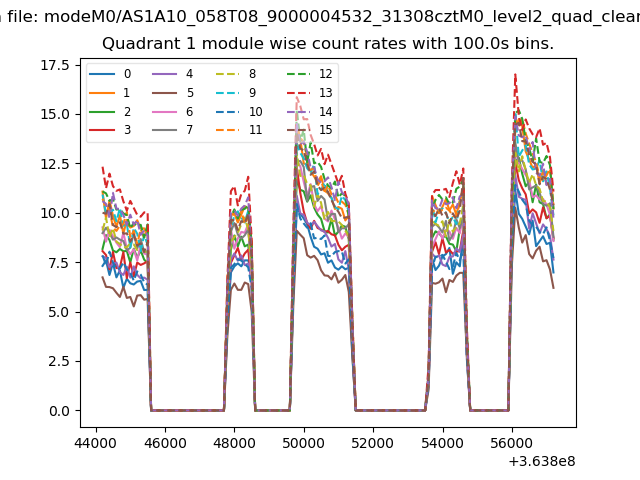
| Module-wise count rates for Quadrant A Data is divided into 100 sec bins |
 |
 |
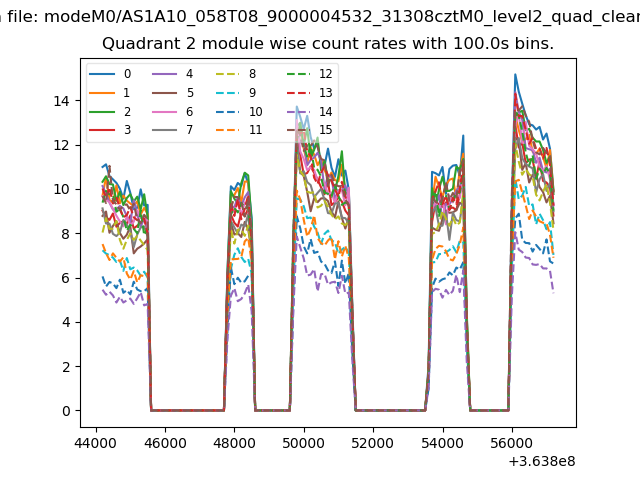
| Module-wise count rates for Quadrant B Data is divided into 100 sec bins |
 |
 |
| Module-wise count rates for Quadrant C Data is divided into 100 sec bins |
 |
 |
| Module-wise count rates for Quadrant D Data is divided into 100 sec bins |
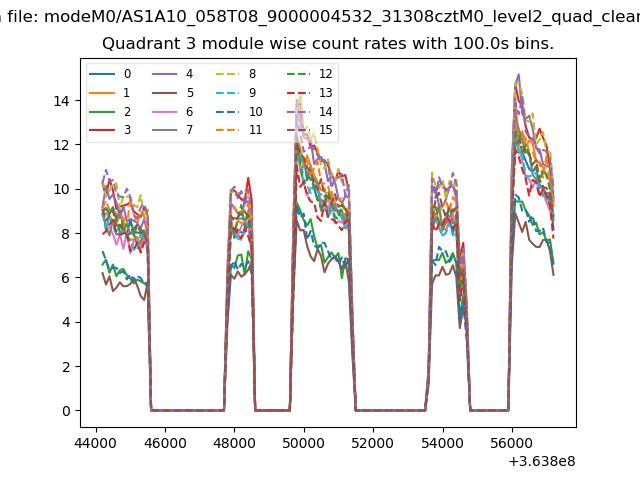 |
 |
| Parameter | Plot |
|---|---|
| CZT HV Monitor | 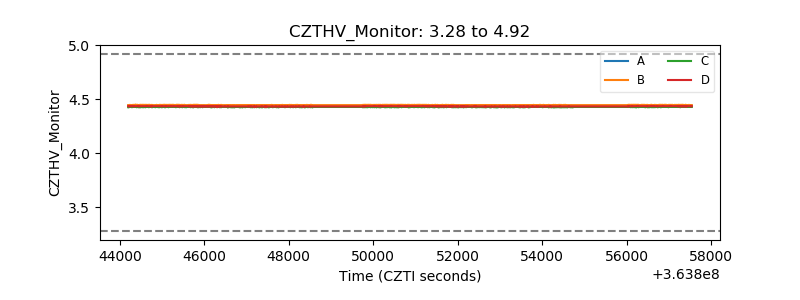 |
| D_VDD | 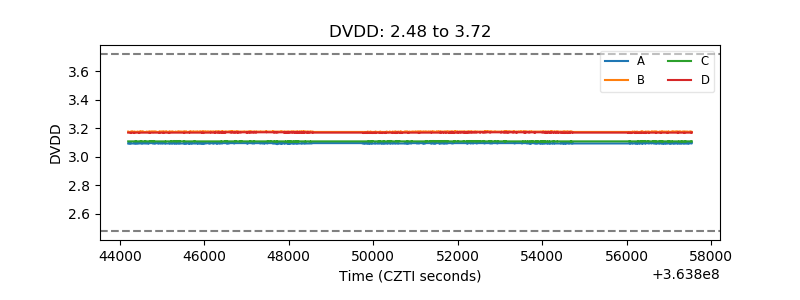 |
| Temperature 1 | 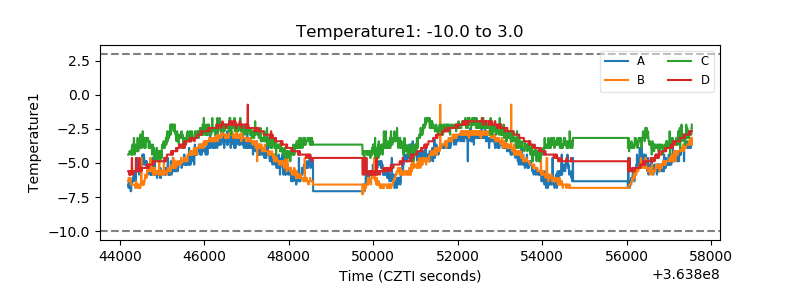 |
| Veto HV Monitor | 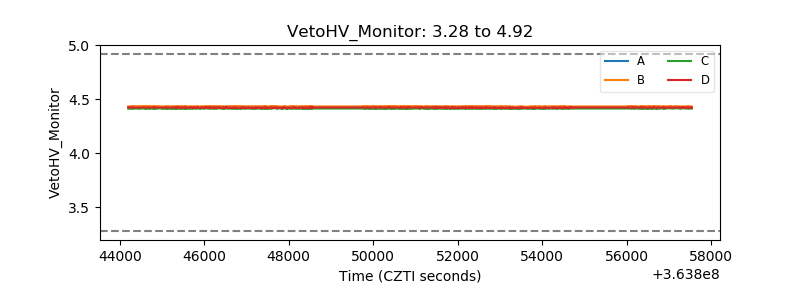 |
| Veto LLD | 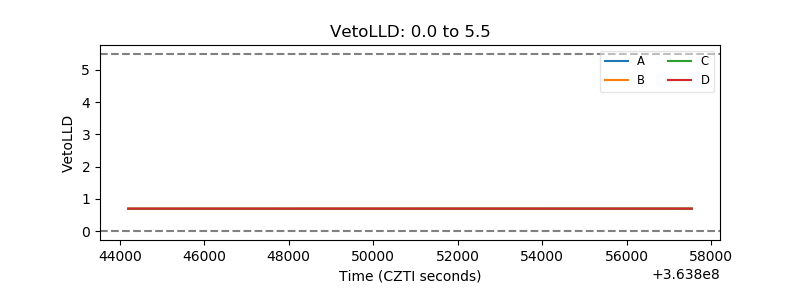 |
| Alpha Counter | 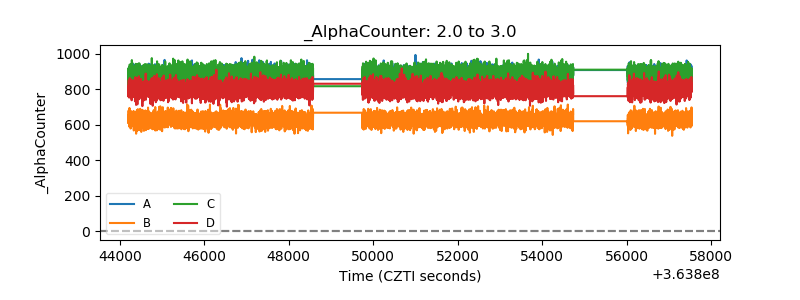 |
| _CPM_Rate | 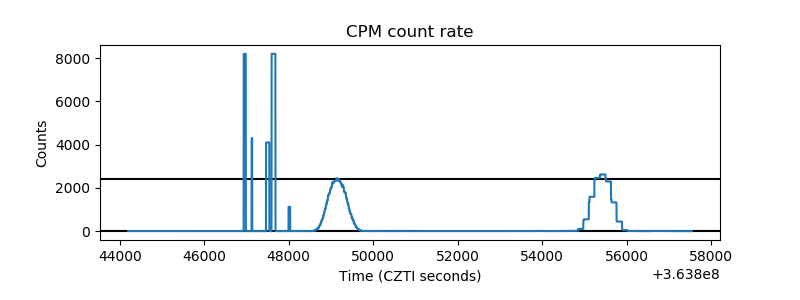 |
| CZT Counter | 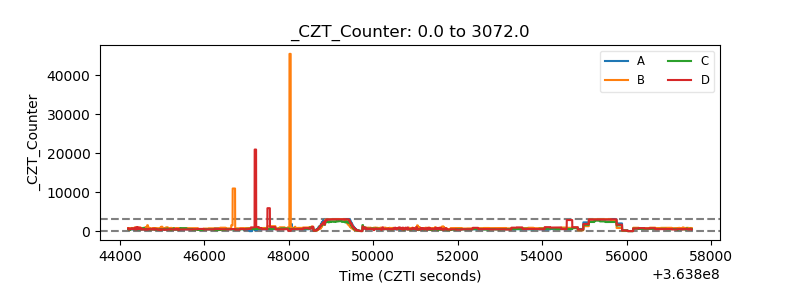 |
| +2.5 Volts monitor | 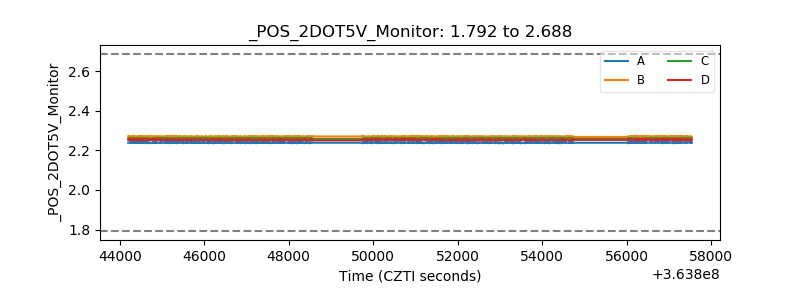 |
| +5 Volts monitor | 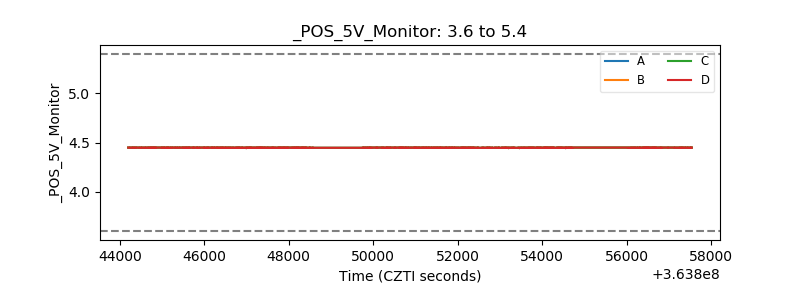 |
| _ROLL_ROT | 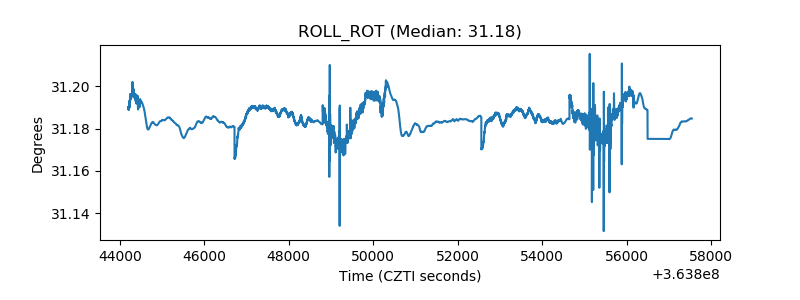 |
| _Roll_DEC | 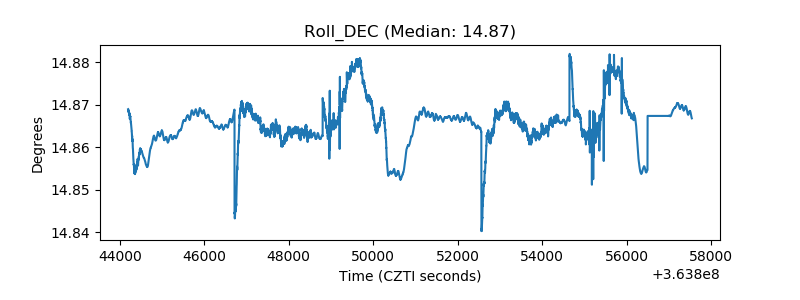 |
| _Roll_RA | 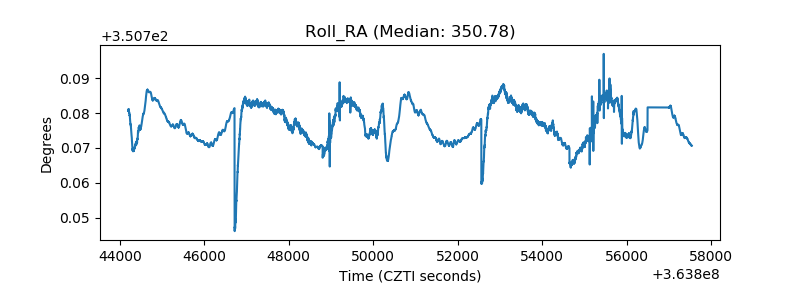 |
| Veto Counter | 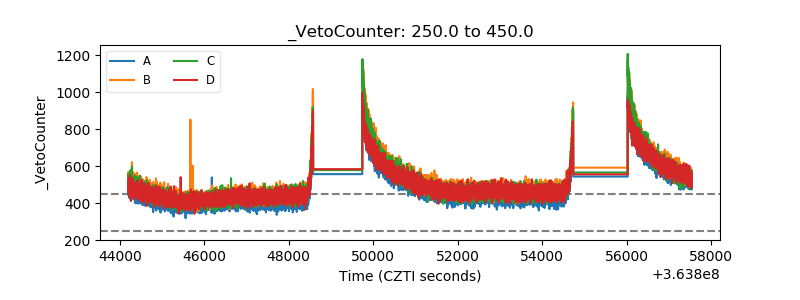 |