| Param | Original file | Final file |
|---|---|---|
| Filename | modeM0/AS1A10_058T08_9000004532_31309cztM0_level2.evt | modeM0/AS1A10_058T08_9000004532_31309cztM0_level2_quad_clean.evt |
| Size (bytes) | 1,354,380,480 | 210,634,560 |
| Size | 1.3 GB | 200.9 MB |
| Events in quadrant A | 8,400,790 | 1,374,024 |
| Events in quadrant B | 12,942,979 | 1,354,868 |
| Events in quadrant C | 9,265,728 | 1,276,665 |
| Events in quadrant D | 9,335,524 | 1,275,607 |
| Mode M0 | |||
|---|---|---|---|
| Quadrant | BADHDUFLAG | Total packets | Discarded packets |
| A | 0 | 34163 | 3 |
| B | 0 | 49292 | 3 |
| C | 0 | 37459 | 3 |
| D | 0 | 37652 | 3 |
| Mode M9 | |||
|---|---|---|---|
| Quadrant | BADHDUFLAG | Total packets | Discarded packets |
| A | 0 | 37 | 0 |
| B | 0 | 37 | 0 |
| C | 0 | 37 | 0 |
| D | 0 | 37 | 0 |
| Mode SS | |||
|---|---|---|---|
| Quadrant | BADHDUFLAG | Total packets | Discarded packets |
| A | 0 | 326 | 0 |
| B | 0 | 326 | 0 |
| C | 0 | 326 | 0 |
| D | 0 | 326 | 0 |
| Quadrant | Total seconds | Saturated seconds | Saturation percentage |
|---|---|---|---|
| A | 15917 | 138 | 0.866998% |
| B | 15917 | 321 | 2.016712% |
| C | 15917 | 371 | 2.330841% |
| D | 15917 | 209 | 1.313062% |
Noise dominated data is calculated using 1-second bins in cleaned event files. If a bin has >2000 counts, and if more than 50% of those come from <1% of pixels, then it is considered to be noise-dominated and hence unusable.
| Quadrant | # 1 sec bins | Bins with >0 counts | Bins with >2000 counts | High rate bins dominated by noise | Noise dominated (total time) | Noise dominated (detector-on time) | Marked lightcurve |
|---|---|---|---|---|---|---|---|
| A | 19703 | 15920 | 0 | 0 | 0.00% | 0.00% | 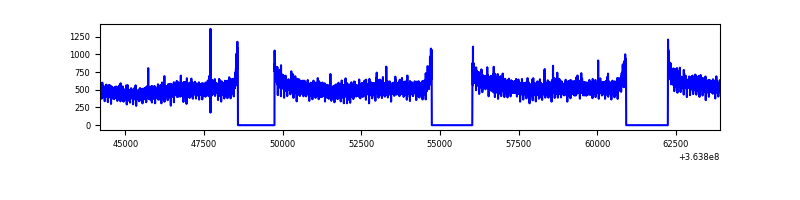 |
| B | 19703 | 15920 | 15 | 15 | 0.08% | 0.09% | 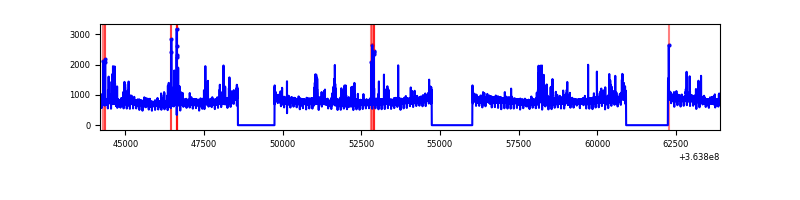 |
| C | 19703 | 15920 | 60 | 60 | 0.30% | 0.38% | 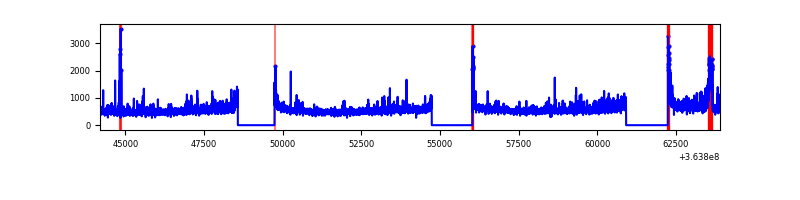 |
| D | 19703 | 15920 | 95 | 95 | 0.48% | 0.60% | 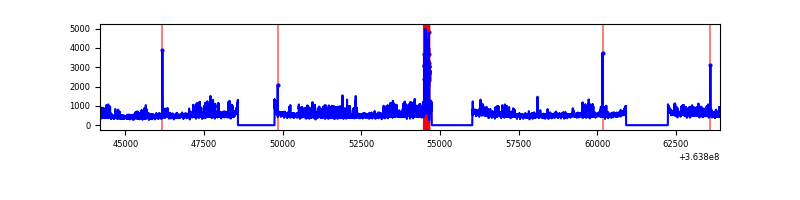 |
Top three noisy pixels from each quadrant. If the there are fewer than three noisy pixels in the level2.evt file, extra rows are filled as -1
| Pixel properties | Quadrant properties | ||||||
|---|---|---|---|---|---|---|---|
| Quadrant | DetID | PixID | Counts | Sigma | Mean | Median | Sigma |
| A | 13 | 254 | 27795 | 60.29 | 2178 | 2144 | 425.5 |
| A | 3 | 137 | 20767 | 43.77 | 2178 | 2144 | 425.5 |
| A | 0 | 226 | 18438 | 38.29 | 2178 | 2144 | 425.5 |
| B | 6 | 159 | 4165734 | 10524.74 | 2115 | 2067 | 395.6 |
| B | 4 | 80 | 275233 | 690.5 | 2115 | 2067 | 395.6 |
| B | 15 | 33 | 99868 | 247.22 | 2115 | 2067 | 395.6 |
| C | 3 | 233 | 855427 | 1825.38 | 2021 | 2040 | 467.5 |
| C | 14 | 238 | 335872 | 714.06 | 2021 | 2040 | 467.5 |
| C | 0 | 10 | 151546 | 319.79 | 2021 | 2040 | 467.5 |
| D | 8 | 195 | 1169778 | 2247.67 | 2061 | 2022 | 519.5 |
| D | 1 | 52 | 306549 | 586.15 | 2061 | 2022 | 519.5 |
| D | 2 | 234 | 55647 | 103.22 | 2061 | 2022 | 519.5 |
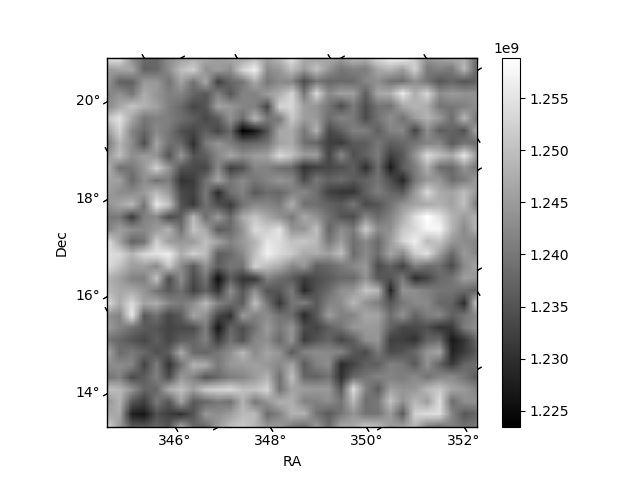
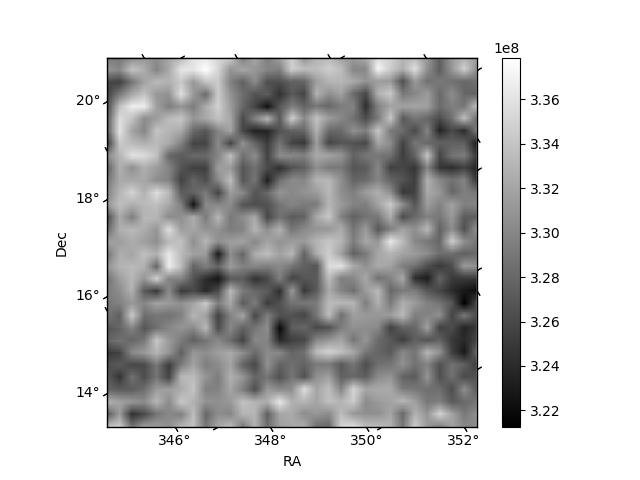
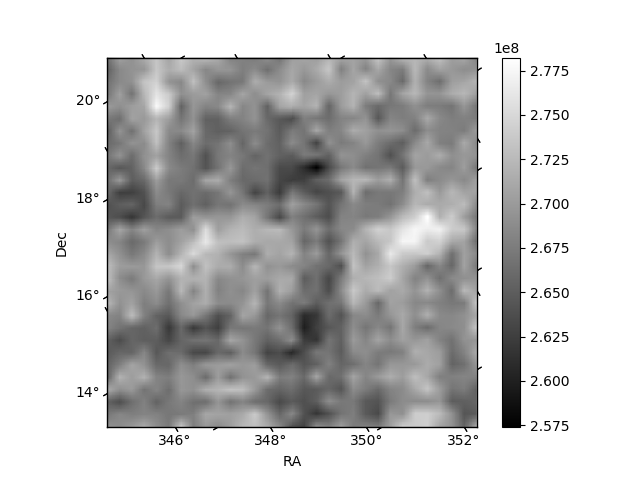
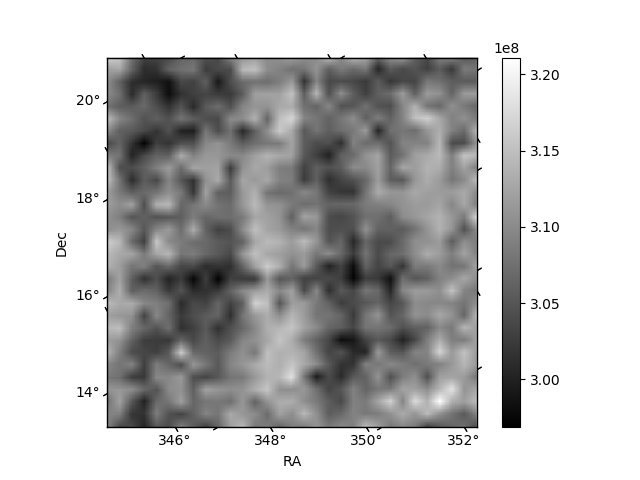
Histogram calculated using DETX and DETY for each event in the final _common_clean file
| Quadrant A | 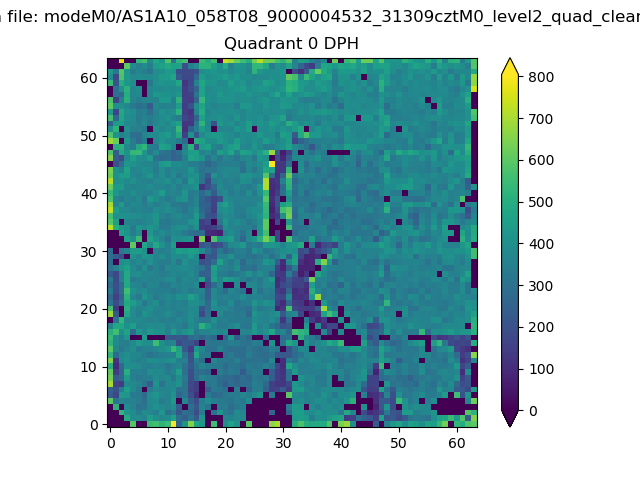 |
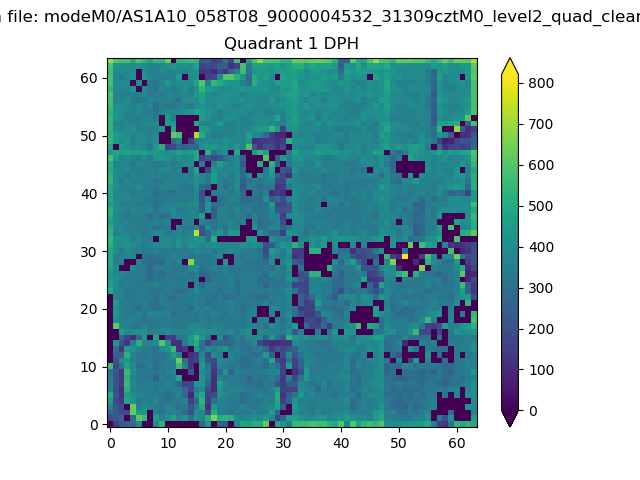 |
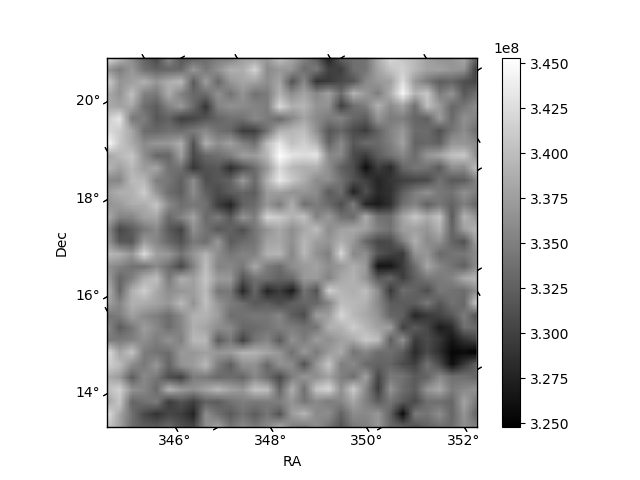
Quadrant B |
|---|---|---|---|
| Quadrant D | 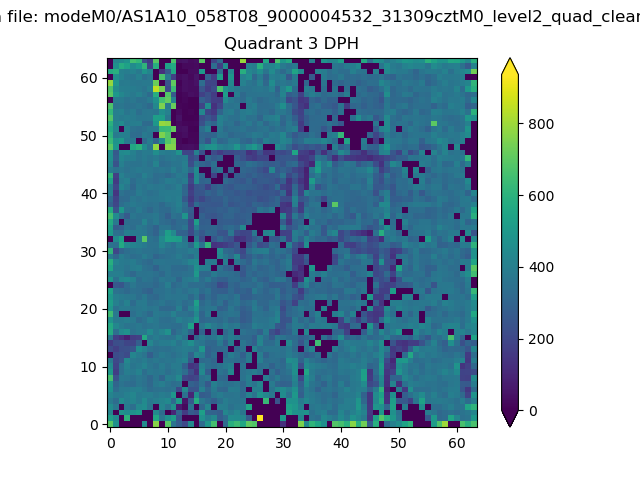 |
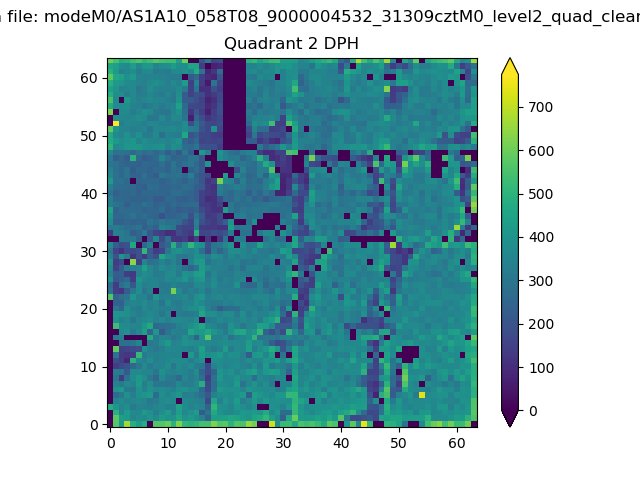 |
Quadrant C |
| Plot type | Count rate plots | Images |
|---|---|---|
| Comparison with Poisson distribution Blue bars denote a histogram of data divided into 1 sec bins. Red curve is a Poisson curve with rate = median count rate of data. |
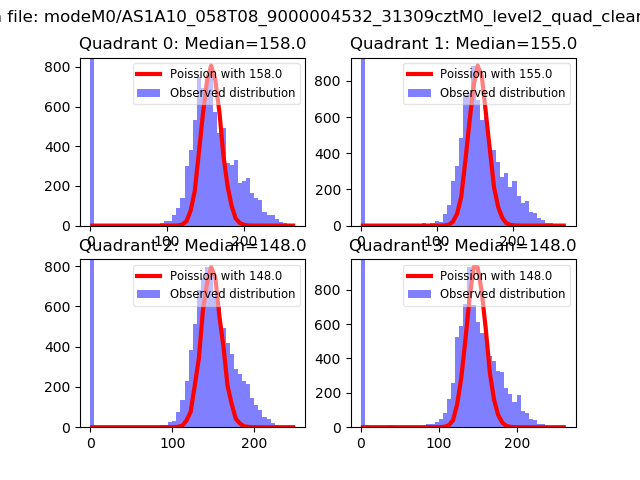 |
 |
| Quadrant-wise count rates Data is divided into 100 sec bins |
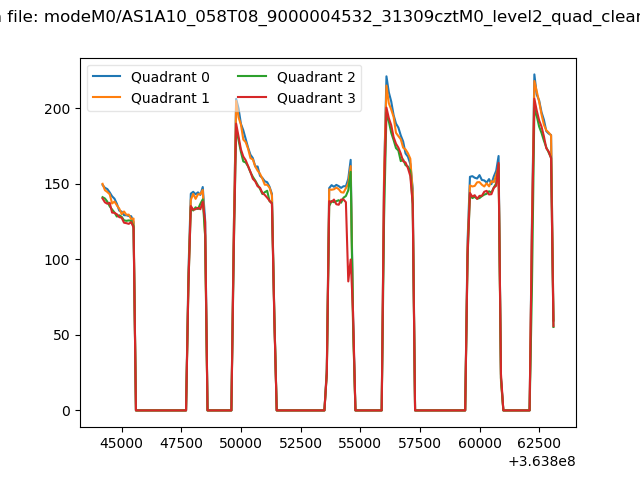 |
|
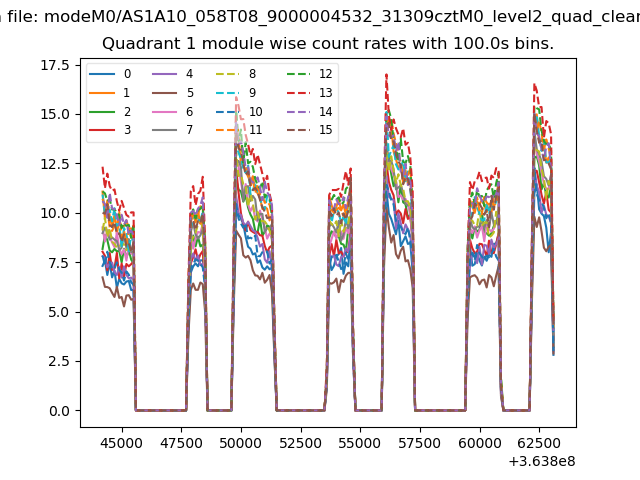
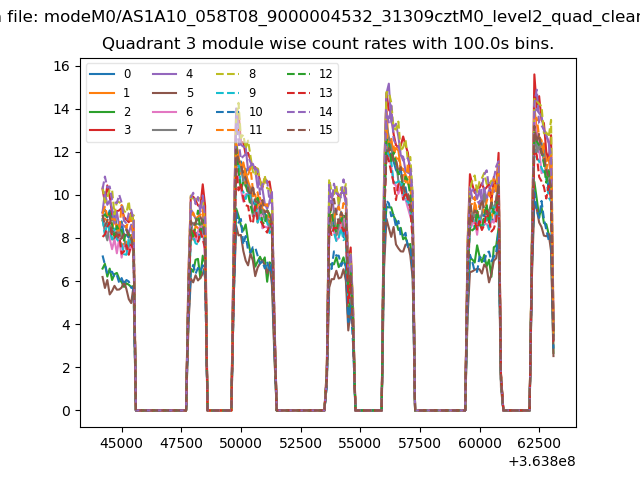
| Module-wise count rates for Quadrant A Data is divided into 100 sec bins |
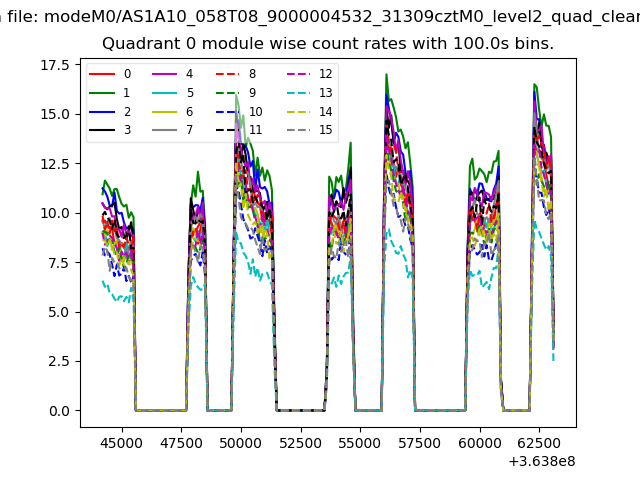 |
 |
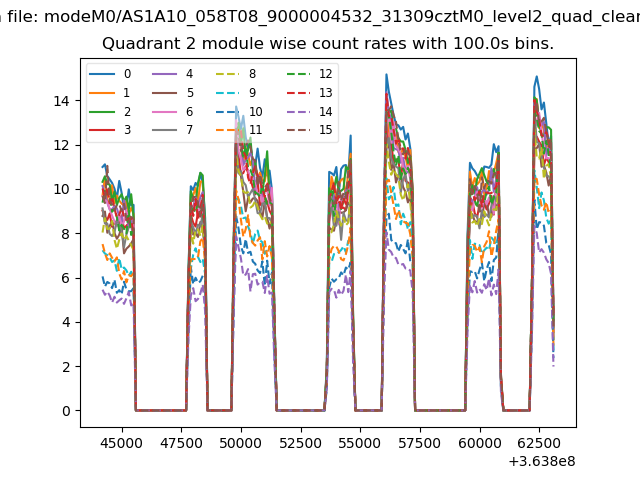
| Module-wise count rates for Quadrant B Data is divided into 100 sec bins |
 |
 |
| Module-wise count rates for Quadrant C Data is divided into 100 sec bins |
 |
 |
| Module-wise count rates for Quadrant D Data is divided into 100 sec bins |
 |
 |
| Parameter | Plot |
|---|---|
| CZT HV Monitor | 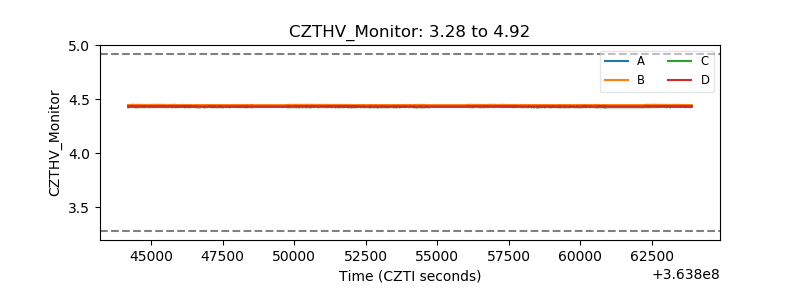 |
| D_VDD | 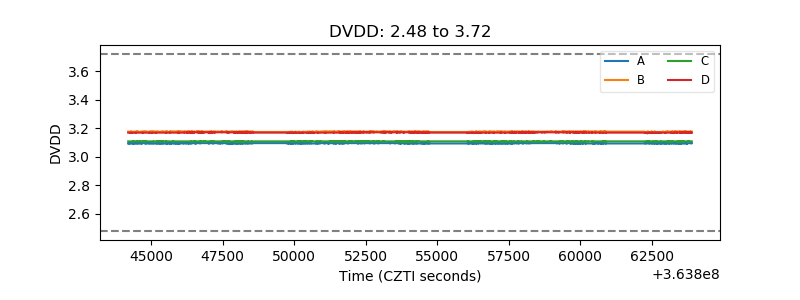 |
| Temperature 1 | 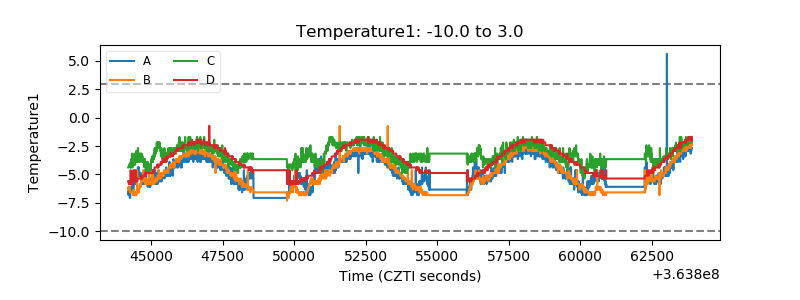 |
| Veto HV Monitor | 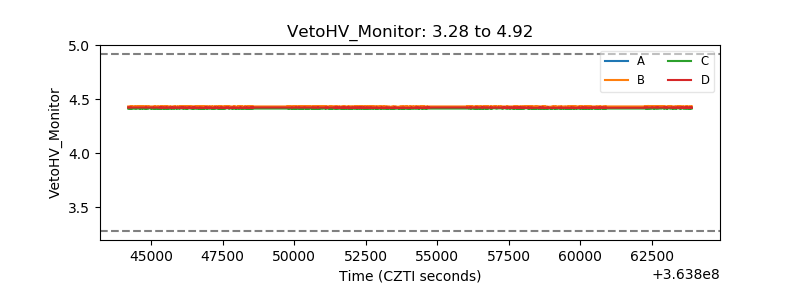 |
| Veto LLD | 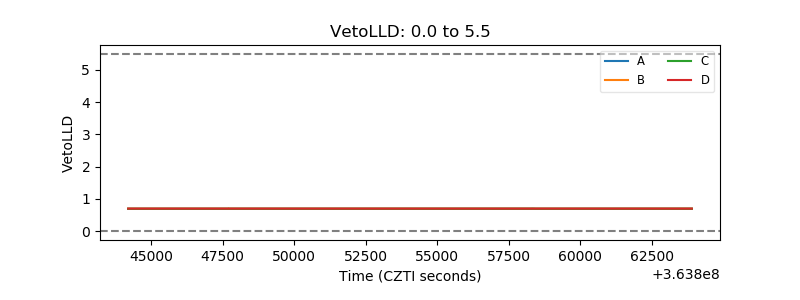 |
| Alpha Counter | 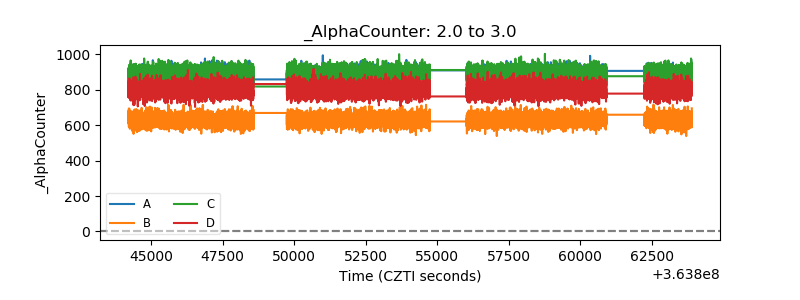 |
| _CPM_Rate | 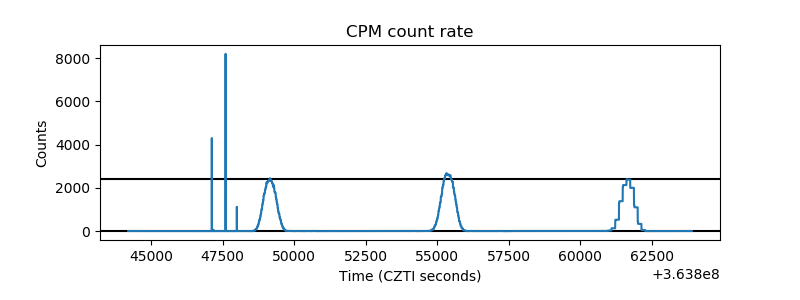 |
| CZT Counter | 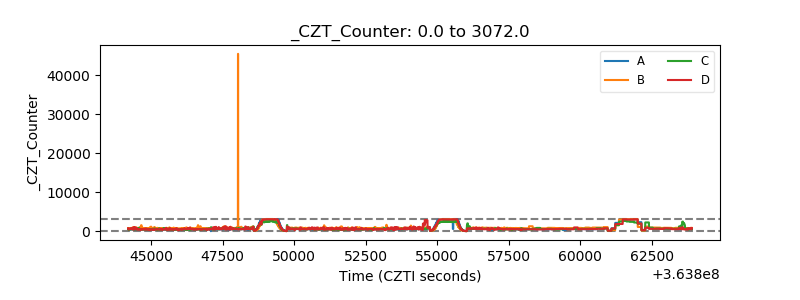 |
| +2.5 Volts monitor | 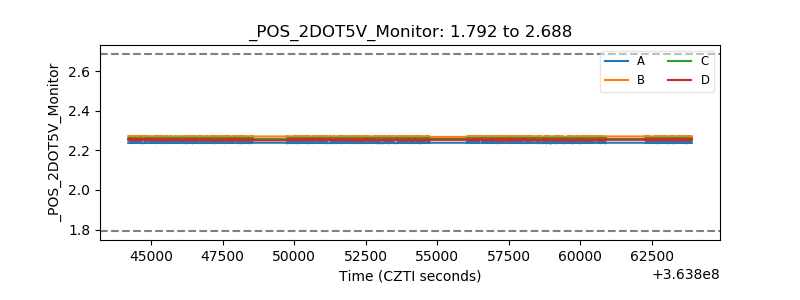 |
| +5 Volts monitor | 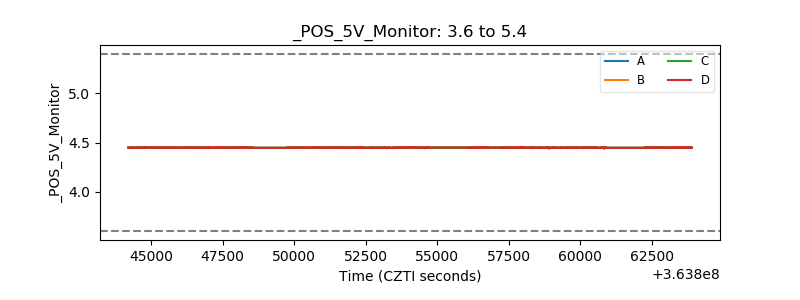 |
| _ROLL_ROT | 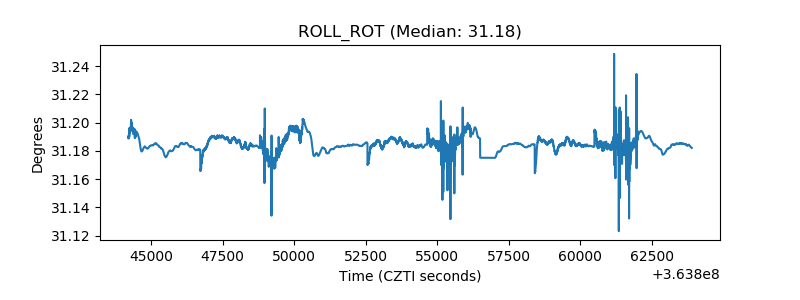 |
| _Roll_DEC | 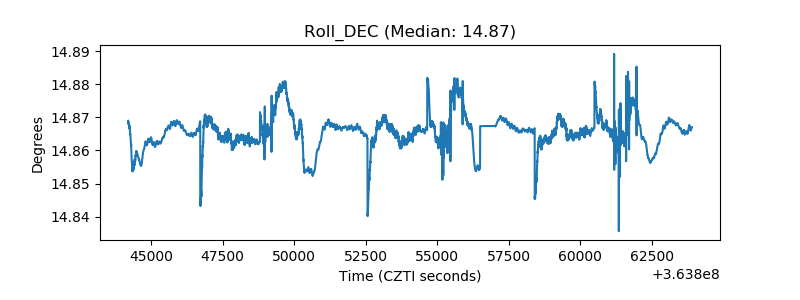 |
| _Roll_RA | 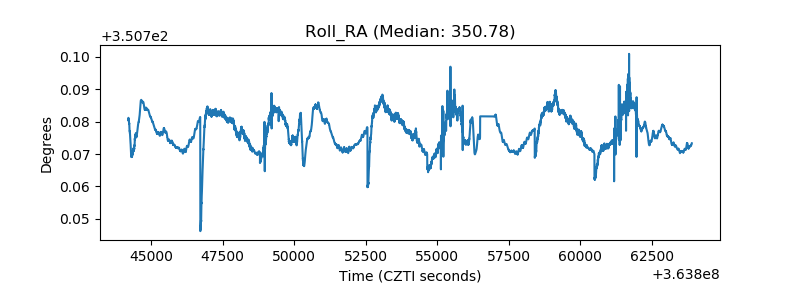 |
| Veto Counter | 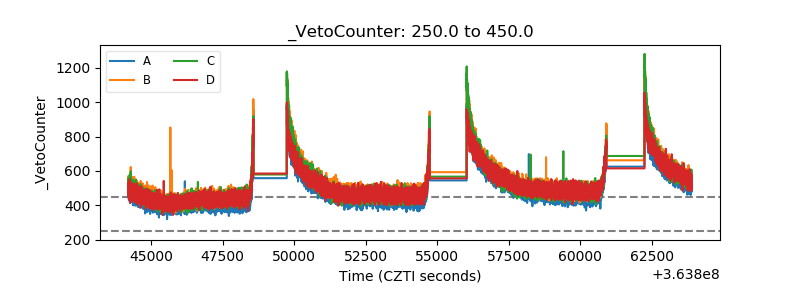 |