| Param | Original file | Final file |
|---|---|---|
| Filename | modeM0/AS1A10_058T08_9000004532_31312cztM0_level2.evt | modeM0/AS1A10_058T08_9000004532_31312cztM0_level2_quad_clean.evt |
| Size (bytes) | 425,707,200 | 43,994,880 |
| Size | 406.0 MB | 42.0 MB |
| Events in quadrant A | 2,078,475 | 275,025 |
| Events in quadrant B | 3,360,636 | 270,302 |
| Events in quadrant C | 3,817,196 | 247,286 |
| Events in quadrant D | 3,353,688 | 245,166 |
| Mode M0 | |||
|---|---|---|---|
| Quadrant | BADHDUFLAG | Total packets | Discarded packets |
| A | 0 | 8574 | 1 |
| B | 0 | 12904 | 1 |
| C | 0 | 14345 | 1 |
| D | 0 | 12637 | 1 |
| Mode M9 | |||
|---|---|---|---|
| Quadrant | BADHDUFLAG | Total packets | Discarded packets |
| A | 1 | 140189274905384 | 46 |
| B | 1 | -1 | -1 |
| C | 1 | -1 | -1 |
| D | 1 | -1 | -1 |
| Mode SS | |||
|---|---|---|---|
| Quadrant | BADHDUFLAG | Total packets | Discarded packets |
| A | 0 | 84 | 0 |
| B | 0 | 84 | 0 |
| C | 0 | 84 | 0 |
| D | 0 | 84 | 0 |
| Quadrant | Total seconds | Saturated seconds | Saturation percentage |
|---|---|---|---|
| A | 4166 | 7 | 0.168027% |
| B | 4166 | 51 | 1.224196% |
| C | 4166 | 340 | 8.161306% |
| D | 4166 | 313 | 7.513202% |
Noise dominated data is calculated using 1-second bins in cleaned event files. If a bin has >2000 counts, and if more than 50% of those come from <1% of pixels, then it is considered to be noise-dominated and hence unusable.
| Quadrant | # 1 sec bins | Bins with >0 counts | Bins with >2000 counts | High rate bins dominated by noise | Noise dominated (total time) | Noise dominated (detector-on time) | Marked lightcurve |
|---|---|---|---|---|---|---|---|
| A | 4166 | 4166 | 0 | 0 | 0.00% | 0.00% | 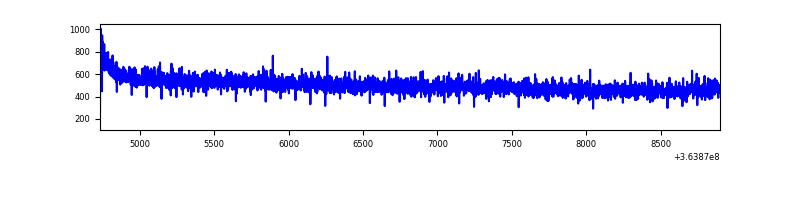 |
| B | 4166 | 4166 | 15 | 15 | 0.36% | 0.36% | 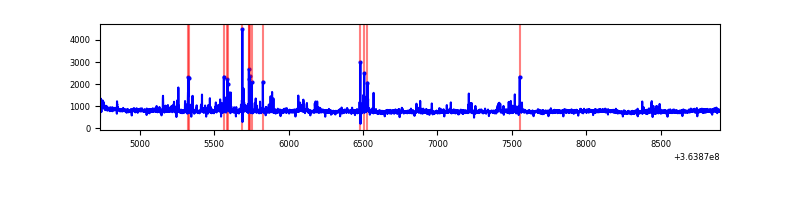 |
| C | 4166 | 4166 | 22 | 22 | 0.53% | 0.53% | 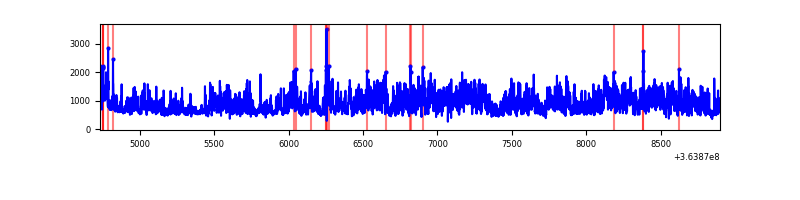 |
| D | 4166 | 4166 | 273 | 273 | 6.55% | 6.55% | 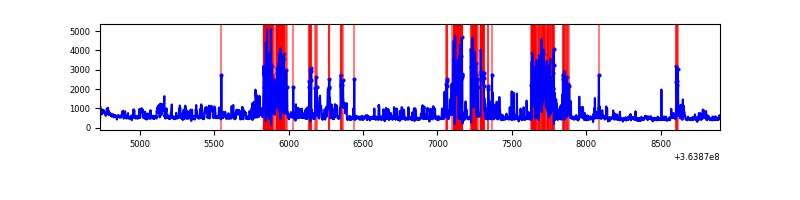 |
Top three noisy pixels from each quadrant. If the there are fewer than three noisy pixels in the level2.evt file, extra rows are filled as -1
| Pixel properties | Quadrant properties | ||||||
|---|---|---|---|---|---|---|---|
| Quadrant | DetID | PixID | Counts | Sigma | Mean | Median | Sigma |
| A | 13 | 254 | 7730 | 66.84 | 538 | 529 | 107.7 |
| A | 3 | 137 | 5259 | 43.91 | 538 | 529 | 107.7 |
| A | 0 | 226 | 4610 | 37.88 | 538 | 529 | 107.7 |
| B | 6 | 159 | 1109704 | 10994.03 | 526 | 513 | 100.9 |
| B | 4 | 80 | 166096 | 1641.22 | 526 | 513 | 100.9 |
| B | 12 | 111 | 12211 | 115.95 | 526 | 513 | 100.9 |
| C | 3 | 233 | 1608834 | 13779.61 | 500 | 505 | 116.7 |
| C | 14 | 238 | 131621 | 1123.36 | 500 | 505 | 116.7 |
| C | 14 | 254 | 71967 | 612.26 | 500 | 505 | 116.7 |
| D | 1 | 52 | 1009201 | 8369.72 | 503 | 491 | 120.5 |
| D | 8 | 195 | 320775 | 2657.54 | 503 | 491 | 120.5 |
| D | 12 | 79 | 86732 | 715.58 | 503 | 491 | 120.5 |
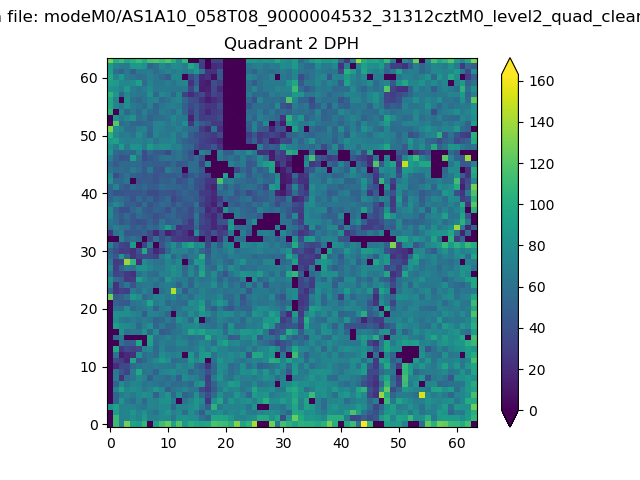
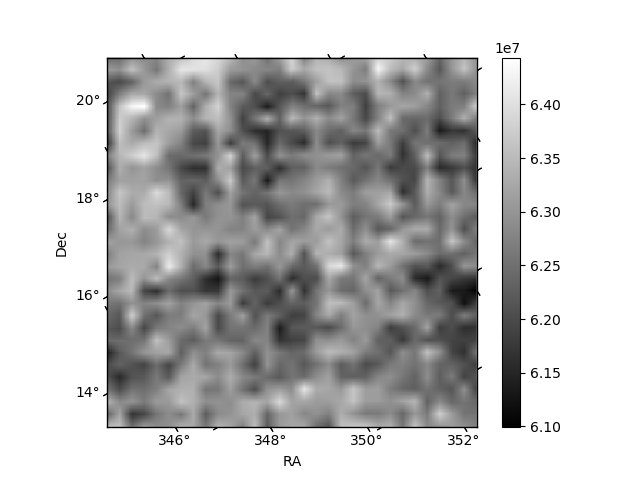
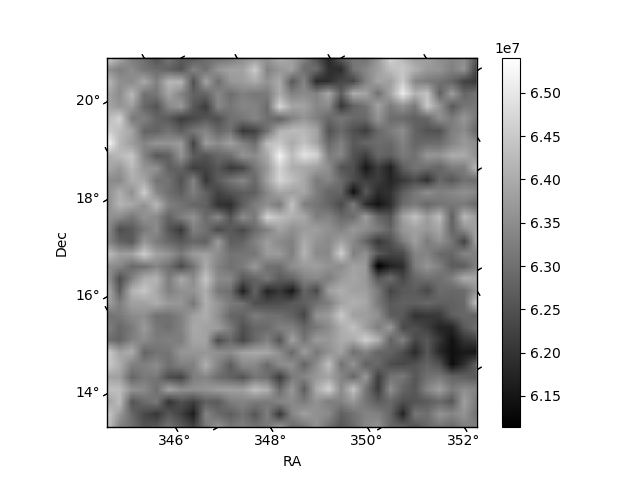
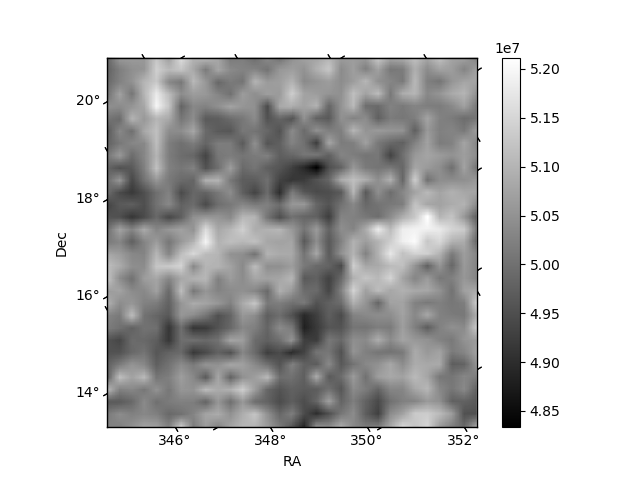
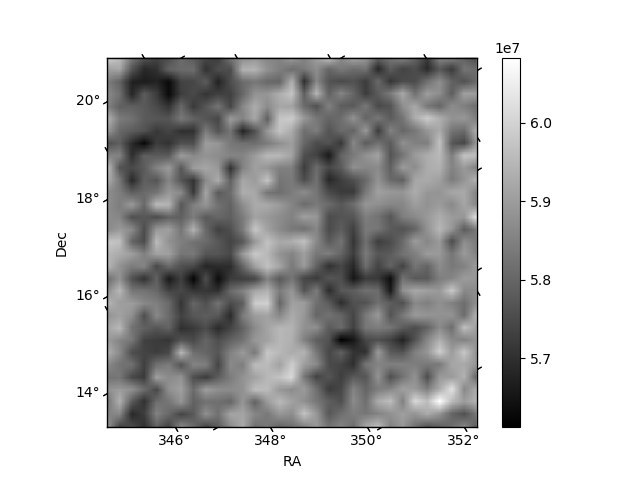
Histogram calculated using DETX and DETY for each event in the final _common_clean file
| Quadrant A | 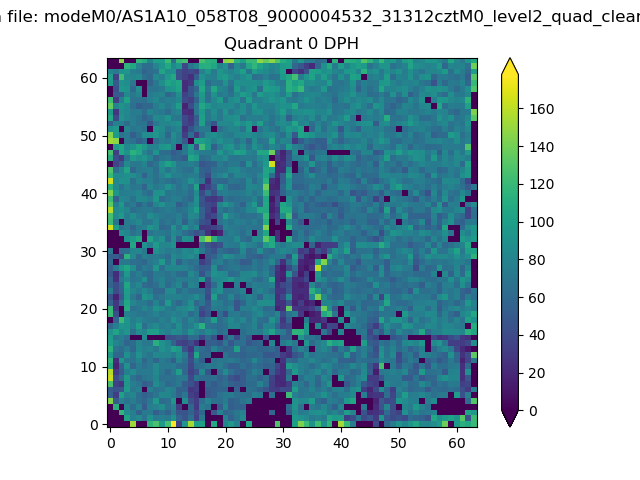 |
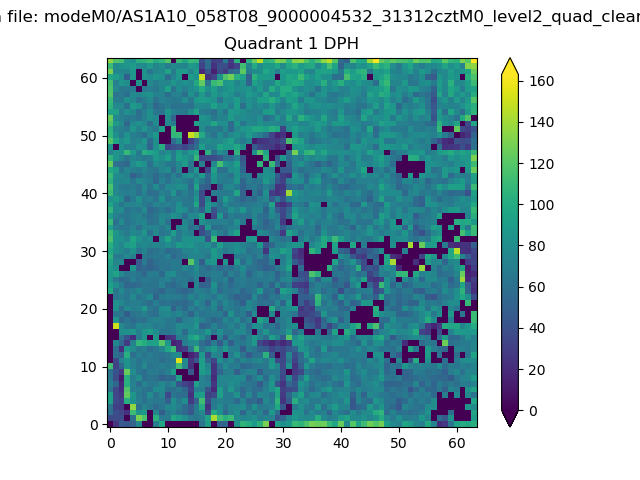 |
Quadrant B |
|---|---|---|---|
| Quadrant D | 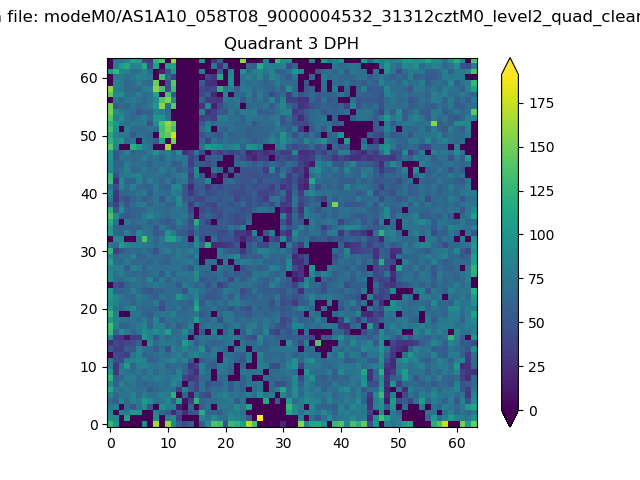 |
 |
Quadrant C |
| Plot type | Count rate plots | Images |
|---|---|---|
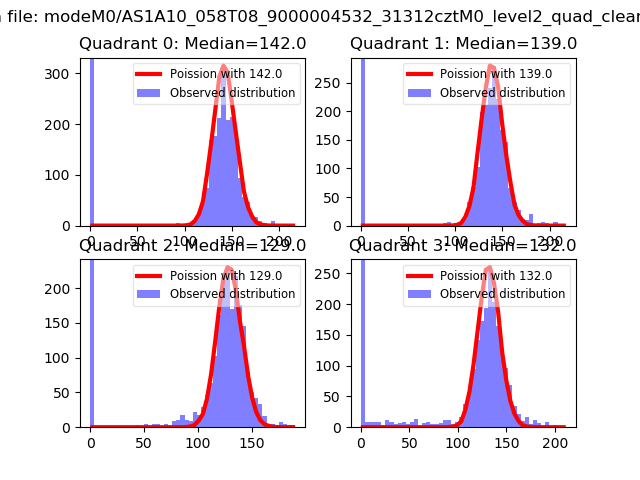
| Comparison with Poisson distribution Blue bars denote a histogram of data divided into 1 sec bins. Red curve is a Poisson curve with rate = median count rate of data. |
 |
 |
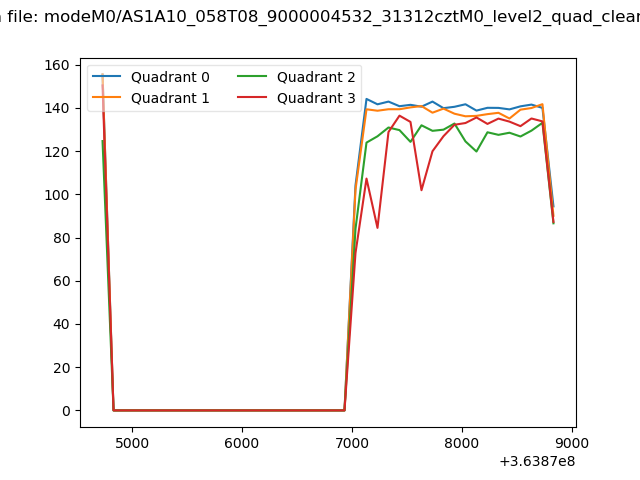
| Quadrant-wise count rates Data is divided into 100 sec bins |
 |
|
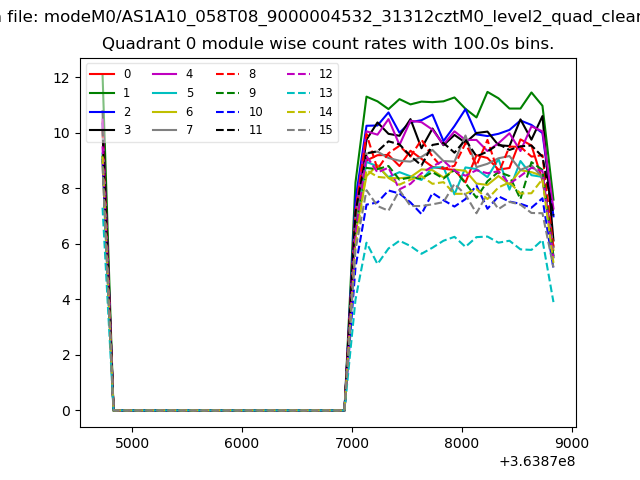
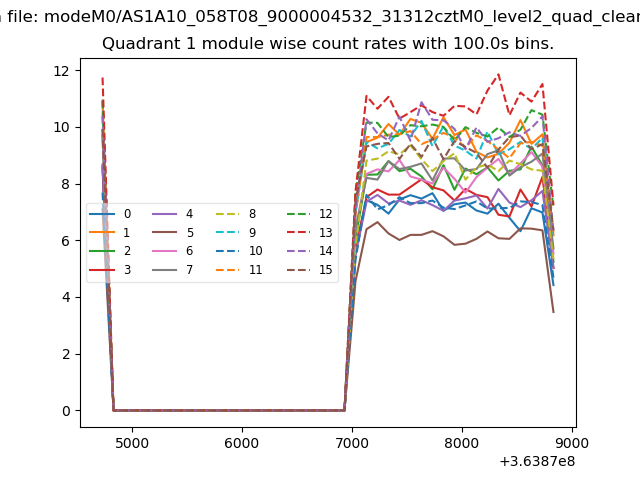
| Module-wise count rates for Quadrant A Data is divided into 100 sec bins |
 |
 |
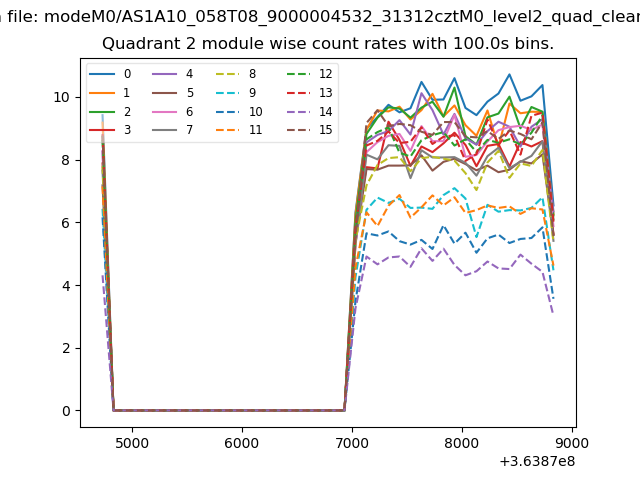
| Module-wise count rates for Quadrant B Data is divided into 100 sec bins |
 |
 |
| Module-wise count rates for Quadrant C Data is divided into 100 sec bins |
 |
 |
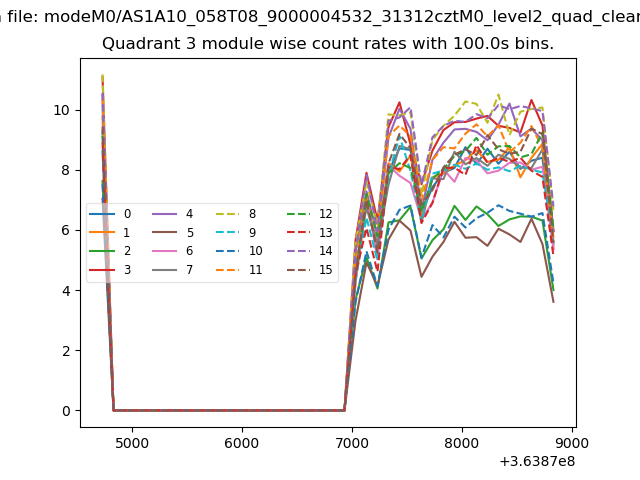
| Module-wise count rates for Quadrant D Data is divided into 100 sec bins |
 |
 |
| Parameter | Plot |
|---|---|
| CZT HV Monitor | 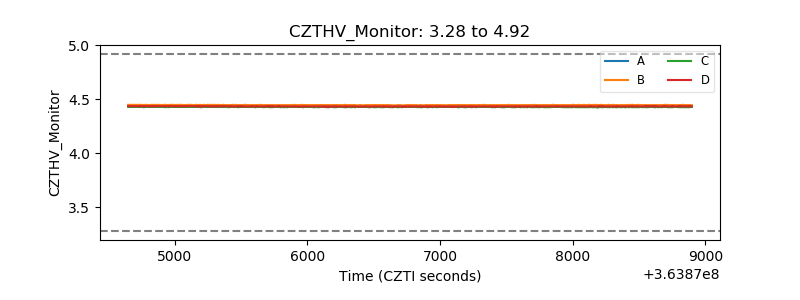 |
| D_VDD | 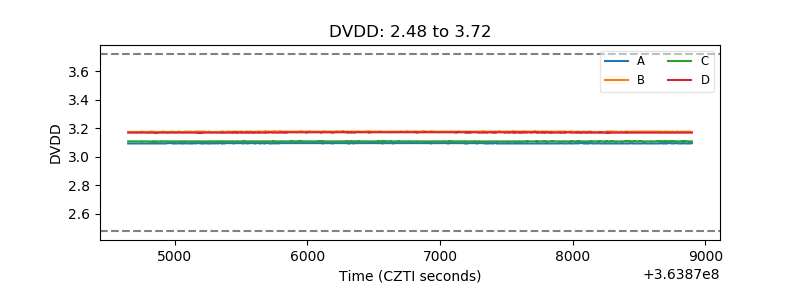 |
| Temperature 1 | 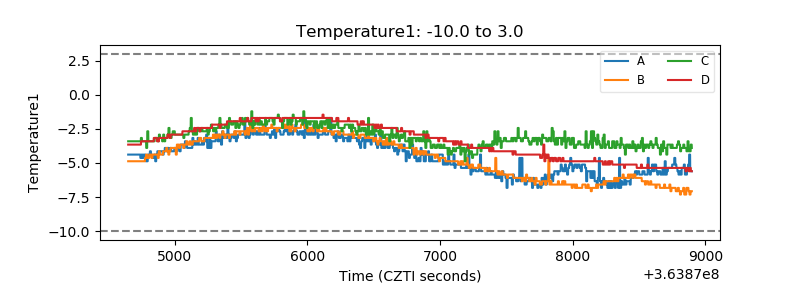 |
| Veto HV Monitor | 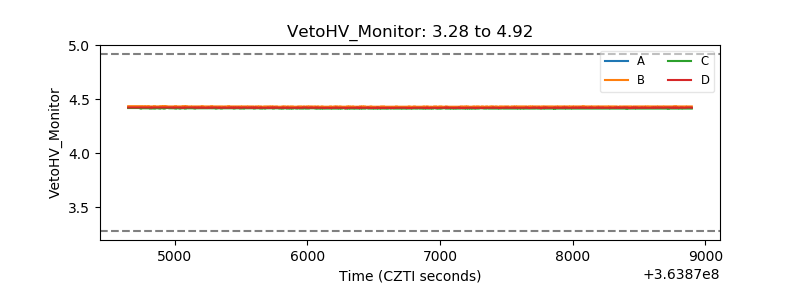 |
| Veto LLD | 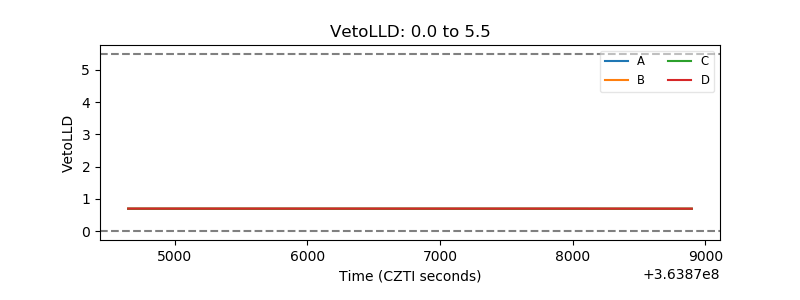 |
| Alpha Counter | 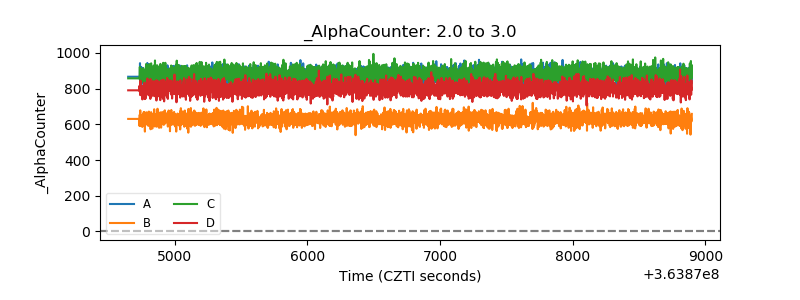 |
| _CPM_Rate | 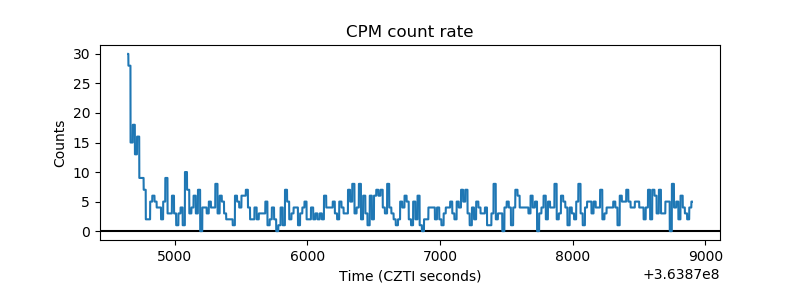 |
| CZT Counter | 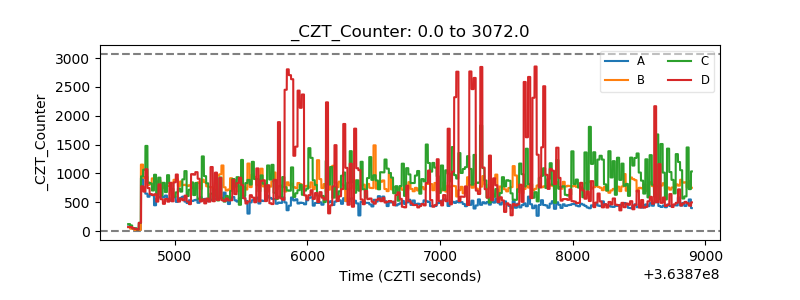 |
| +2.5 Volts monitor |  |
| +5 Volts monitor |  |
| _ROLL_ROT | 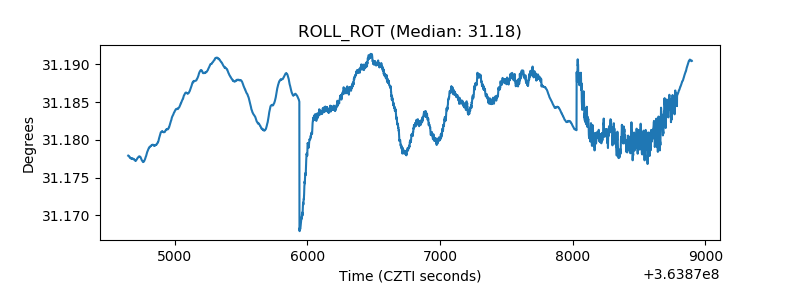 |
| _Roll_DEC |  |
| _Roll_RA | 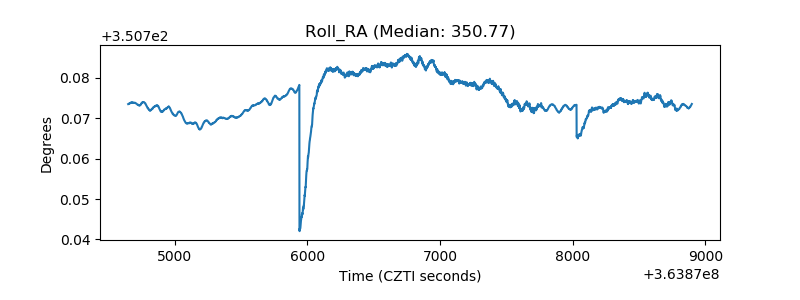 |
| Veto Counter | 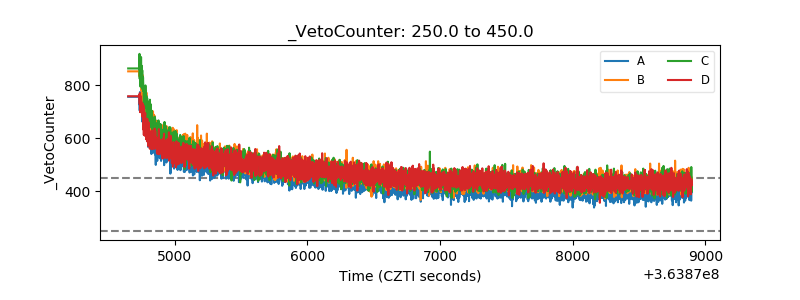 |