| Param | Original file | Final file |
|---|---|---|
| Filename | modeM0/AS1A10_058T08_9000004532_31480cztM0_level2.evt | modeM0/AS1A10_058T08_9000004532_31480cztM0_level2_quad_clean.evt |
| Size (bytes) | 115,081,920 | 5,604,480 |
| Size | 109.8 MB | 5.3 MB |
| Events in quadrant A | 683,320 | 21,755 |
| Events in quadrant B | 1,117,015 | 8,732 |
| Events in quadrant C | 708,186 | 20,262 |
| Events in quadrant D | 884,909 | 19,693 |
| Mode M0 | |||
|---|---|---|---|
| Quadrant | BADHDUFLAG | Total packets | Discarded packets |
| A | 0 | 4314 | 1523 |
| B | 0 | 7610 | 3514 |
| C | 0 | 4702 | 1812 |
| D | 0 | 5299 | 1808 |
| Mode M9 | |||
|---|---|---|---|
| Quadrant | BADHDUFLAG | Total packets | Discarded packets |
| A | 0 | 5 | 3 |
| B | 0 | 3 | 2 |
| C | 0 | 4 | 3 |
| D | 0 | 3 | 2 |
| Mode SS | |||
|---|---|---|---|
| Quadrant | BADHDUFLAG | Total packets | Discarded packets |
| A | 0 | 42 | 14 |
| B | 0 | 44 | 18 |
| C | 0 | 41 | 13 |
| D | 0 | 43 | 15 |
| Quadrant | Total seconds | Saturated seconds | Saturation percentage |
|---|---|---|---|
| A | 1326 | 5 | 0.377074% |
| B | 1269 | 53 | 4.176517% |
| C | 1320 | 6 | 0.454545% |
| D | 1319 | 15 | 1.137225% |
Noise dominated data is calculated using 1-second bins in cleaned event files. If a bin has >2000 counts, and if more than 50% of those come from <1% of pixels, then it is considered to be noise-dominated and hence unusable.
| Quadrant | # 1 sec bins | Bins with >0 counts | Bins with >2000 counts | High rate bins dominated by noise | Noise dominated (total time) | Noise dominated (detector-on time) | Marked lightcurve |
|---|---|---|---|---|---|---|---|
| A | 2827 | 1381 | 0 | 0 | 0.00% | 0.00% | 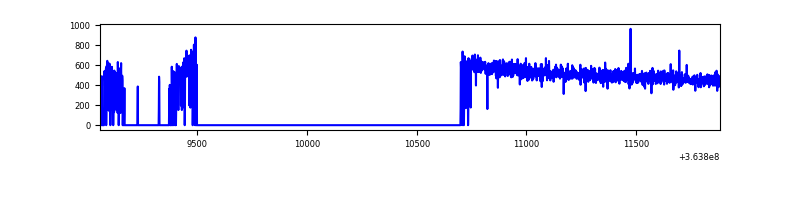 |
| B | 2814 | 1305 | 38 | 38 | 1.35% | 2.91% | 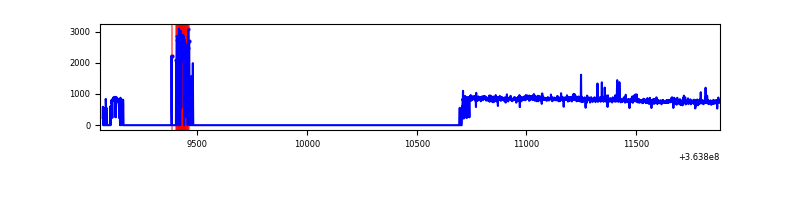 |
| C | 2814 | 1366 | 0 | 0 | 0.00% | 0.00% | 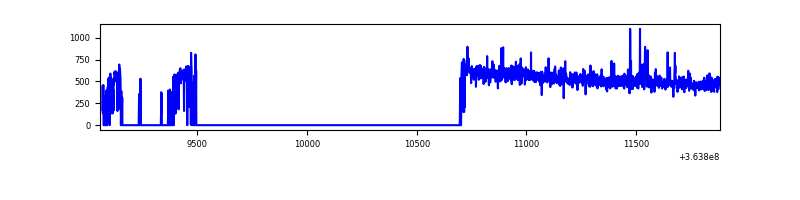 |
| D | 2819 | 1374 | 15 | 15 | 0.53% | 1.09% | 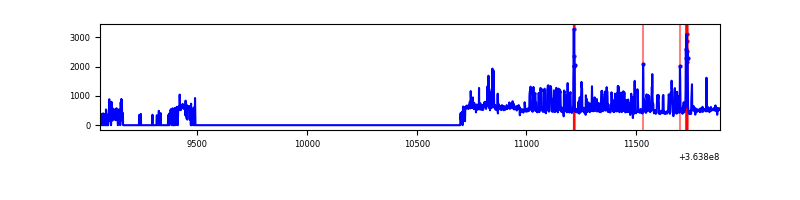 |
Top three noisy pixels from each quadrant. If the there are fewer than three noisy pixels in the level2.evt file, extra rows are filled as -1
| Pixel properties | Quadrant properties | ||||||
|---|---|---|---|---|---|---|---|
| Quadrant | DetID | PixID | Counts | Sigma | Mean | Median | Sigma |
| A | 13 | 254 | 2665 | 65.68 | 176 | 173 | 37.9 |
| A | 0 | 13 | 1931 | 46.34 | 176 | 173 | 37.9 |
| A | 3 | 137 | 1676 | 39.61 | 176 | 173 | 37.9 |
| B | 6 | 159 | 348637 | 10544.41 | 162 | 159 | 33.0 |
| B | 12 | 1 | 107059 | 3234.63 | 162 | 159 | 33.0 |
| B | 0 | 199 | 5218 | 153.08 | 162 | 159 | 33.0 |
| C | 14 | 238 | 26936 | 659.28 | 165 | 166 | 40.6 |
| C | 0 | 10 | 19827 | 484.2 | 165 | 166 | 40.6 |
| C | 10 | 22 | 7438 | 179.09 | 165 | 166 | 40.6 |
| D | 8 | 195 | 180830 | 4358.22 | 164 | 160 | 41.5 |
| D | 13 | 249 | 29444 | 706.4 | 164 | 160 | 41.5 |
| D | 12 | 79 | 26635 | 638.64 | 164 | 160 | 41.5 |
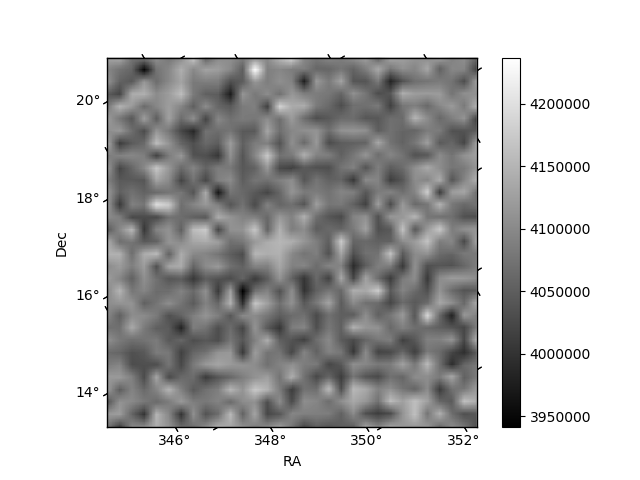
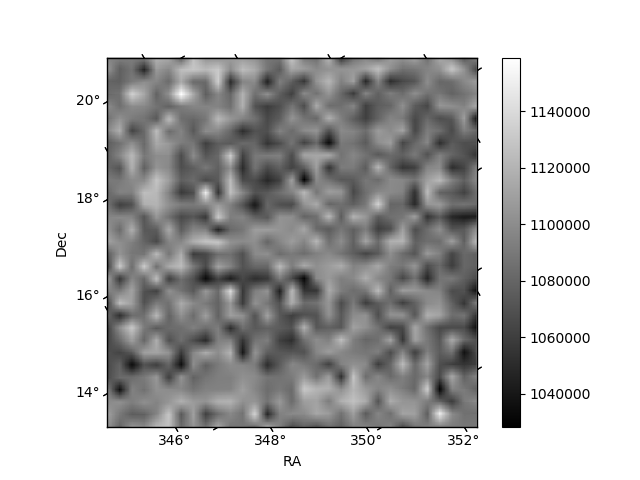
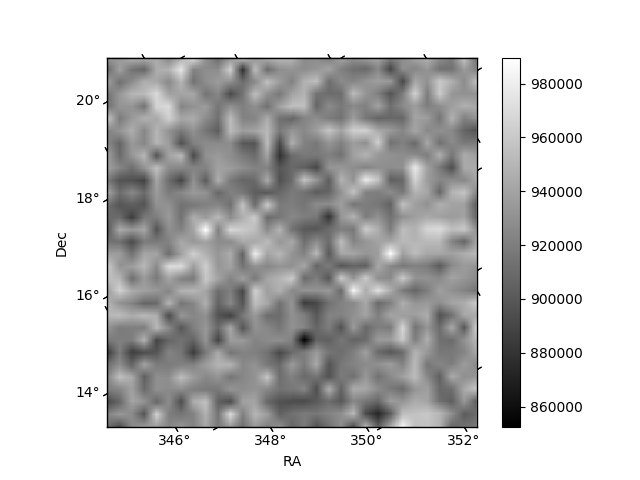
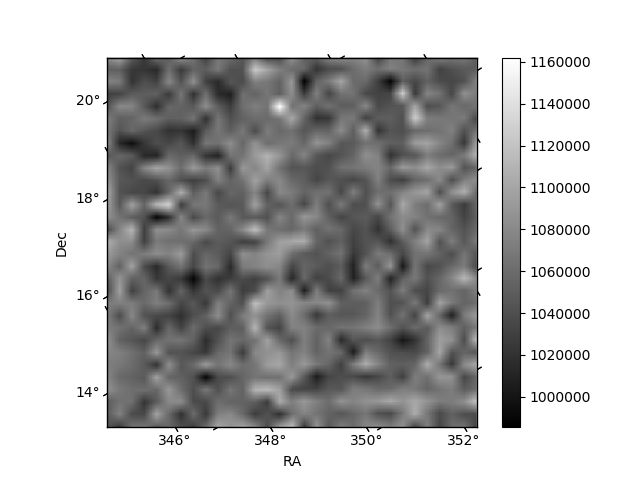
Histogram calculated using DETX and DETY for each event in the final _common_clean file
| Quadrant A | 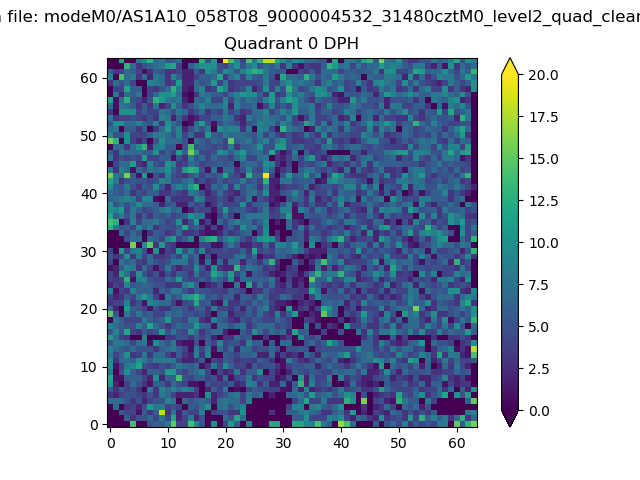 |
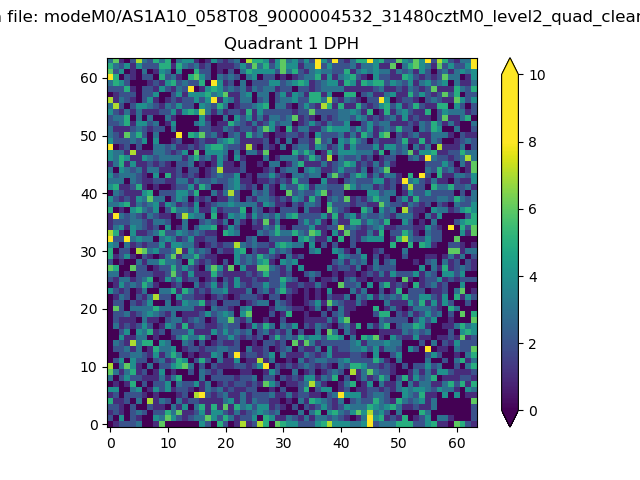 |
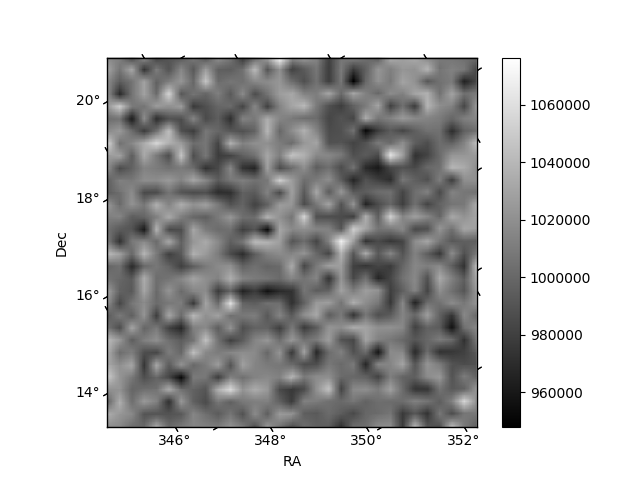
Quadrant B |
|---|---|---|---|
| Quadrant D | 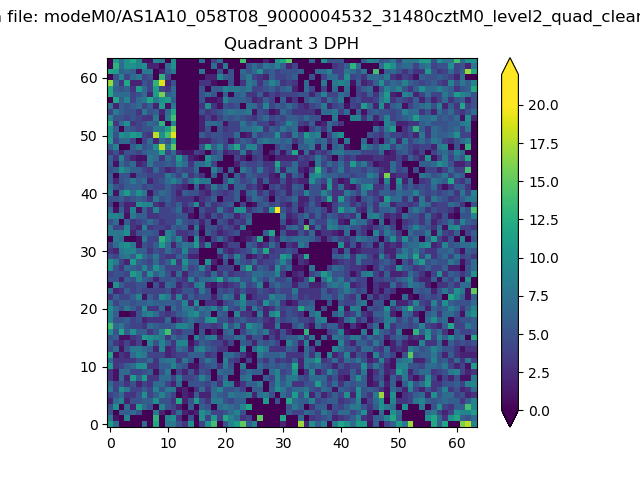 |
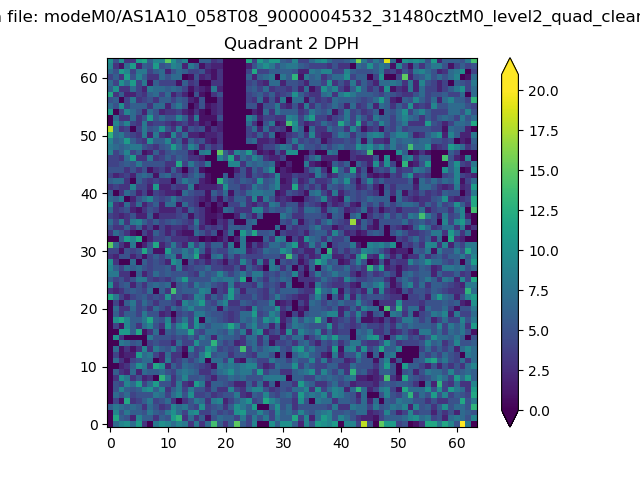 |
Quadrant C |
| Plot type | Count rate plots | Images |
|---|---|---|
| Comparison with Poisson distribution Blue bars denote a histogram of data divided into 1 sec bins. Red curve is a Poisson curve with rate = median count rate of data. |
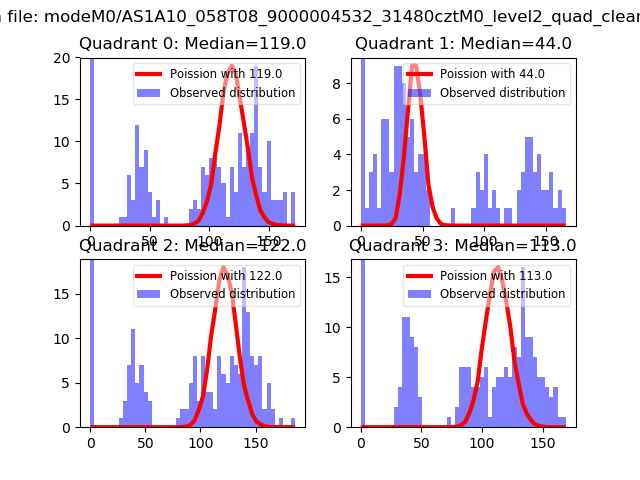 |
 |
| Quadrant-wise count rates Data is divided into 100 sec bins |
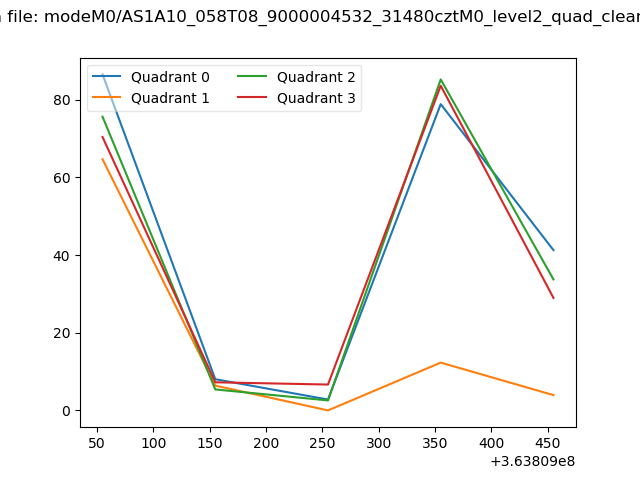 |
|
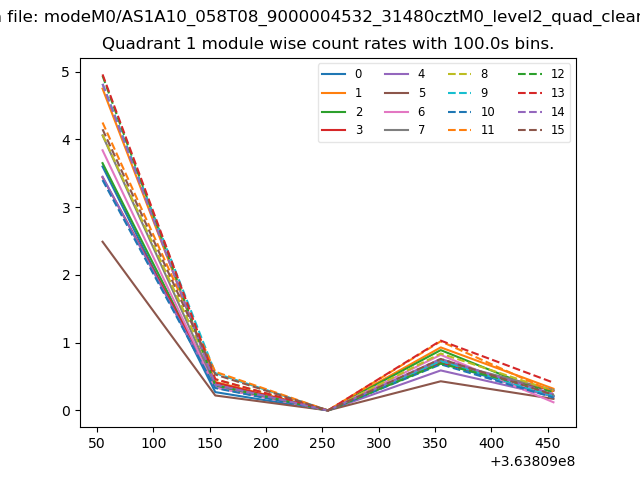
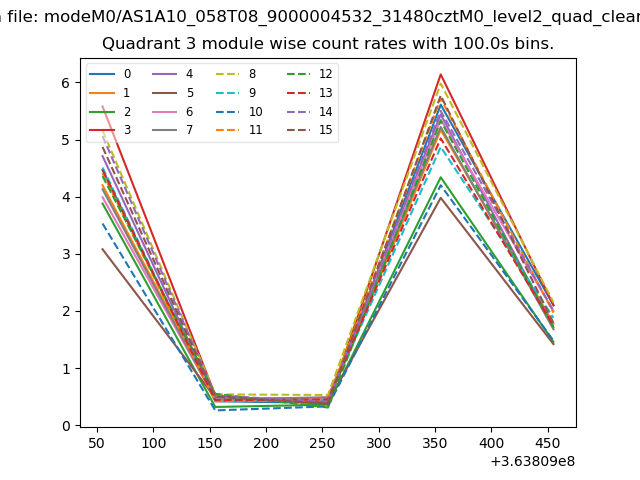
| Module-wise count rates for Quadrant A Data is divided into 100 sec bins |
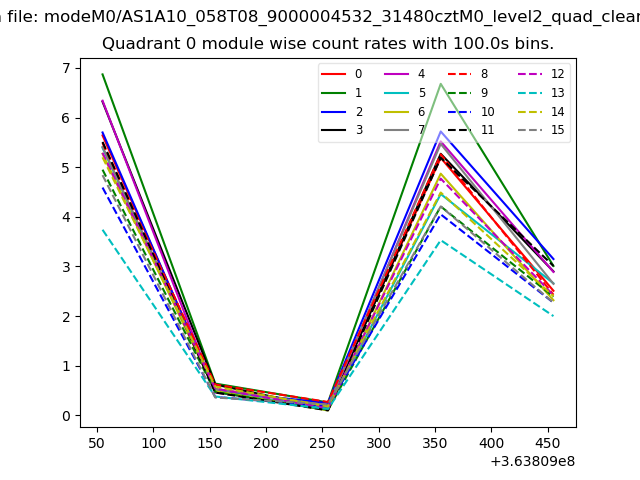 |
 |
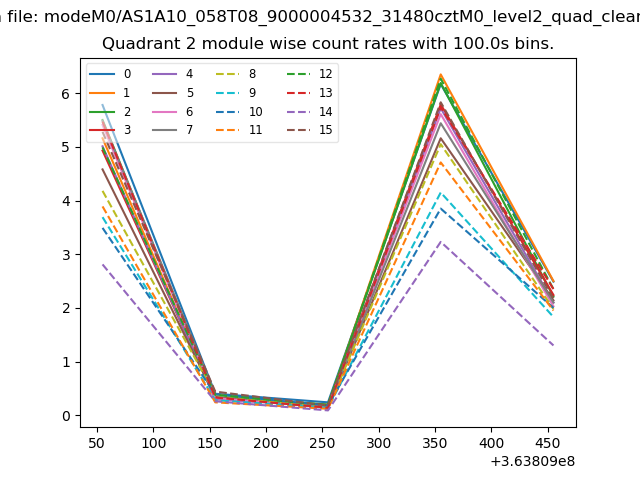
| Module-wise count rates for Quadrant B Data is divided into 100 sec bins |
 |
 |
| Module-wise count rates for Quadrant C Data is divided into 100 sec bins |
 |
 |
| Module-wise count rates for Quadrant D Data is divided into 100 sec bins |
 |
 |
| Parameter | Plot |
|---|---|
| CZT HV Monitor | 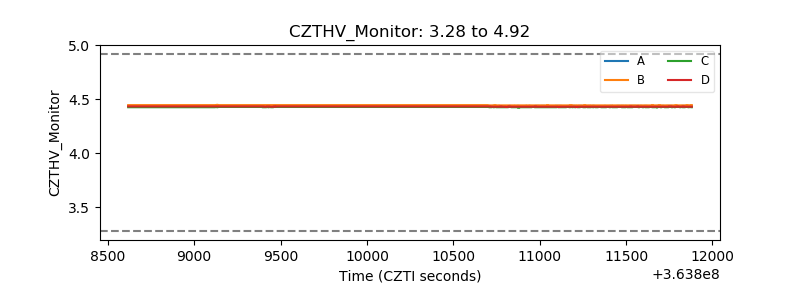 |
| D_VDD | 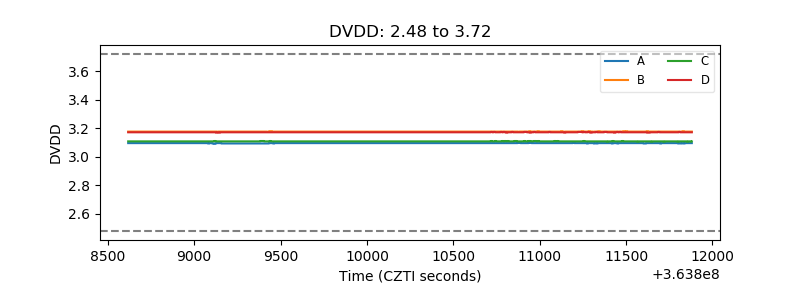 |
| Temperature 1 | 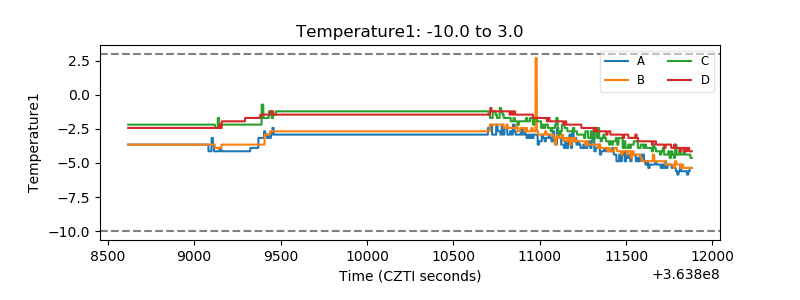 |
| Veto HV Monitor | 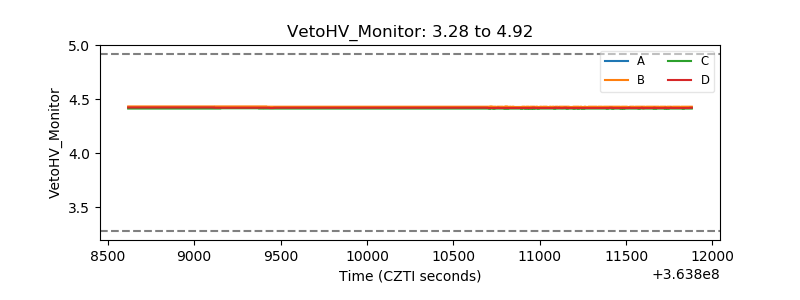 |
| Veto LLD | 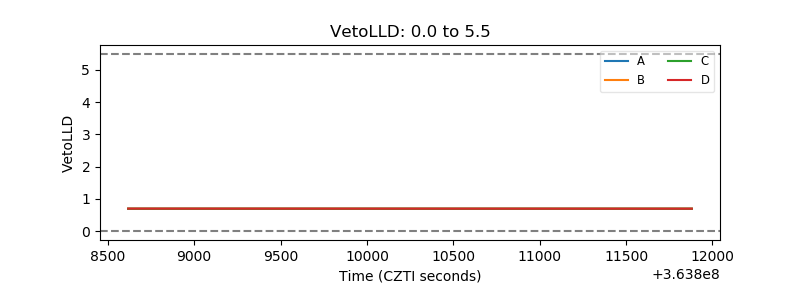 |
| Alpha Counter | 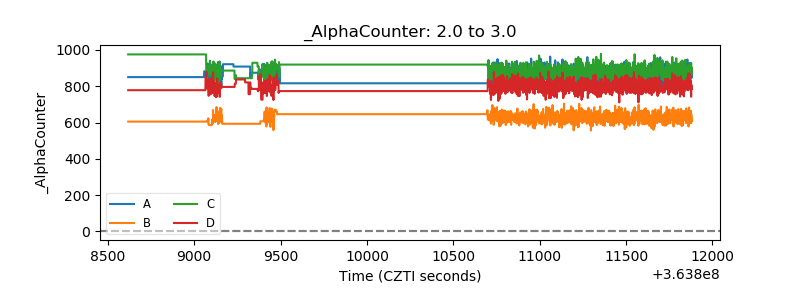 |
| _CPM_Rate |  |
| CZT Counter | 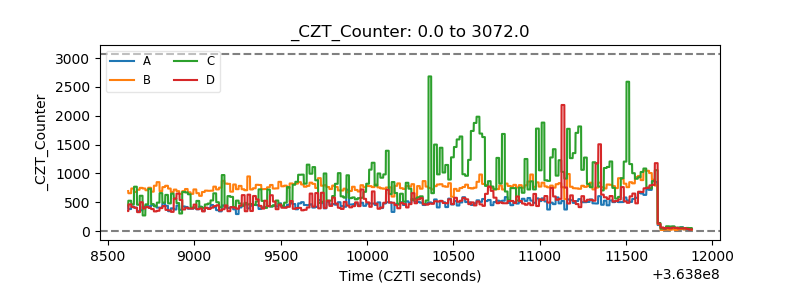 |
| +2.5 Volts monitor | 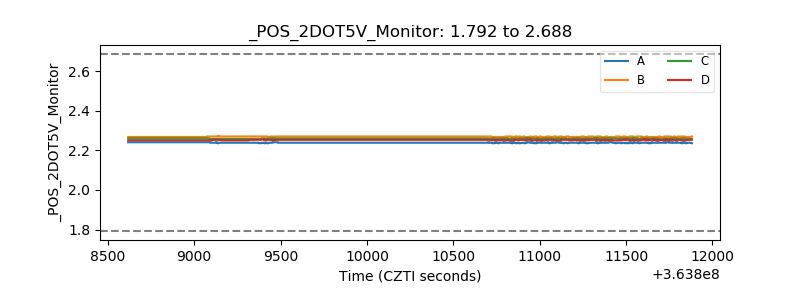 |
| +5 Volts monitor |  |
| _ROLL_ROT | 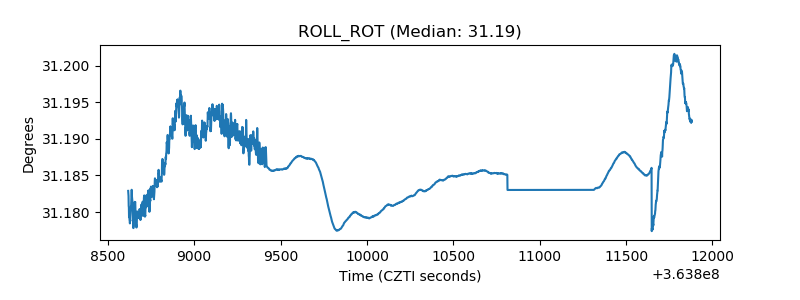 |
| _Roll_DEC | 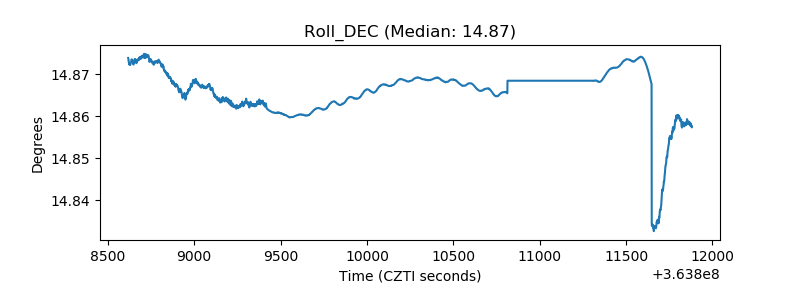 |
| _Roll_RA | 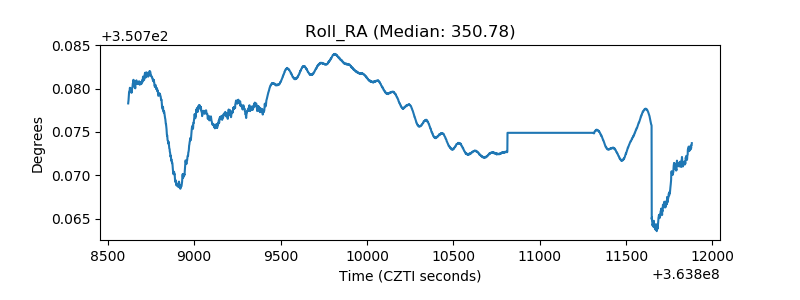 |
| Veto Counter | 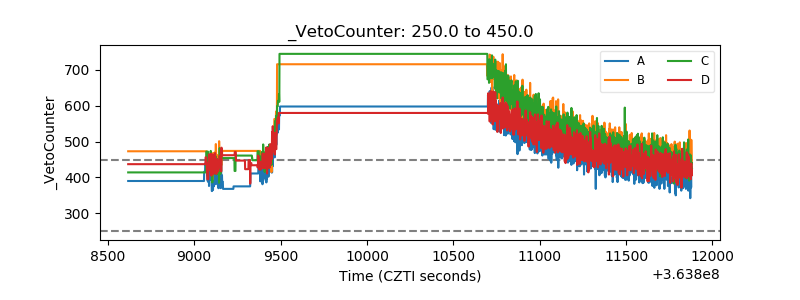 |