| Param | Original file | Final file |
|---|---|---|
| Filename | modeM0/AS1A10_058T08_9000004532_31489cztM0_level2.evt | modeM0/AS1A10_058T08_9000004532_31489cztM0_level2_quad_clean.evt |
| Size (bytes) | 581,814,720 | 87,514,560 |
| Size | 554.9 MB | 83.5 MB |
| Events in quadrant A | 3,439,497 | 546,799 |
| Events in quadrant B | 5,683,453 | 546,760 |
| Events in quadrant C | 3,619,979 | 537,185 |
| Events in quadrant D | 4,391,455 | 519,897 |
| Mode M0 | |||
|---|---|---|---|
| Quadrant | BADHDUFLAG | Total packets | Discarded packets |
| A | 0 | 14991 | 145 |
| B | 0 | 22602 | 382 |
| C | 0 | 15366 | 146 |
| D | 0 | 17903 | 305 |
| Mode M9 | |||
|---|---|---|---|
| Quadrant | BADHDUFLAG | Total packets | Discarded packets |
| A | 0 | 1 | 0 |
| B | 0 | 2 | 1 |
| C | 0 | 1 | 0 |
| D | 0 | 1 | 0 |
| Mode SS | |||
|---|---|---|---|
| Quadrant | BADHDUFLAG | Total packets | Discarded packets |
| A | 0 | 146 | 0 |
| B | 0 | 146 | 2 |
| C | 0 | 145 | 2 |
| D | 0 | 146 | 0 |
| Quadrant | Total seconds | Saturated seconds | Saturation percentage |
|---|---|---|---|
| A | 7181 | 252 | 3.509261% |
| B | 7156 | 400 | 5.589715% |
| C | 7181 | 307 | 4.275171% |
| D | 7158 | 274 | 3.827885% |
Noise dominated data is calculated using 1-second bins in cleaned event files. If a bin has >2000 counts, and if more than 50% of those come from <1% of pixels, then it is considered to be noise-dominated and hence unusable.
| Quadrant | # 1 sec bins | Bins with >0 counts | Bins with >2000 counts | High rate bins dominated by noise | Noise dominated (total time) | Noise dominated (detector-on time) | Marked lightcurve |
|---|---|---|---|---|---|---|---|
| A | 7337 | 7244 | 0 | 0 | 0.00% | 0.00% | 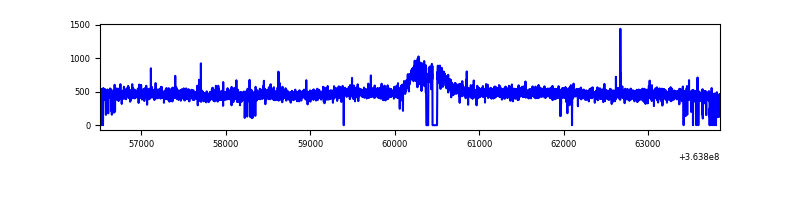 |
| B | 7325 | 7227 | 27 | 27 | 0.37% | 0.37% | 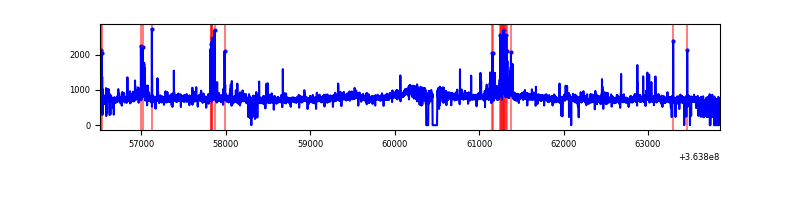 |
| C | 7339 | 7244 | 6 | 6 | 0.08% | 0.08% | 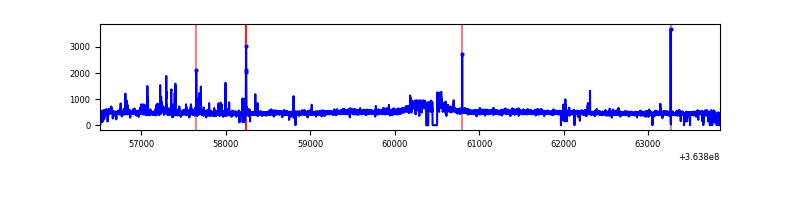 |
| D | 7338 | 7237 | 44 | 44 | 0.60% | 0.61% | 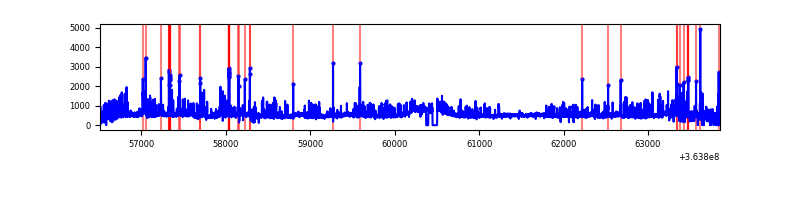 |
Top three noisy pixels from each quadrant. If the there are fewer than three noisy pixels in the level2.evt file, extra rows are filled as -1
| Pixel properties | Quadrant properties | ||||||
|---|---|---|---|---|---|---|---|
| Quadrant | DetID | PixID | Counts | Sigma | Mean | Median | Sigma |
| A | 0 | 13 | 20479 | 108.39 | 886 | 865 | 181.0 |
| A | 13 | 254 | 12455 | 64.05 | 886 | 865 | 181.0 |
| A | 3 | 137 | 9234 | 46.25 | 886 | 865 | 181.0 |
| B | 6 | 159 | 1918195 | 11301.05 | 864 | 840 | 169.7 |
| B | 12 | 1 | 160865 | 943.2 | 864 | 840 | 169.7 |
| B | 4 | 80 | 56072 | 325.54 | 864 | 840 | 169.7 |
| C | 14 | 238 | 134959 | 671.16 | 843 | 846 | 199.8 |
| C | 0 | 10 | 102901 | 510.73 | 843 | 846 | 199.8 |
| C | 10 | 22 | 23241 | 112.07 | 843 | 846 | 199.8 |
| D | 8 | 195 | 728712 | 3562.38 | 851 | 829 | 204.3 |
| D | 12 | 79 | 98867 | 479.81 | 851 | 829 | 204.3 |
| D | 13 | 249 | 88796 | 430.53 | 851 | 829 | 204.3 |
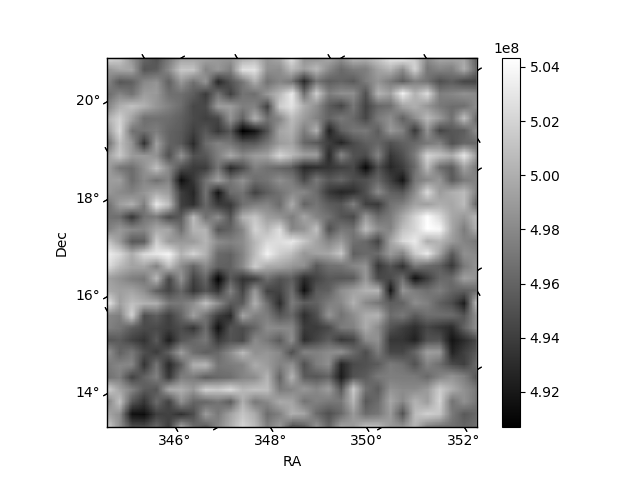
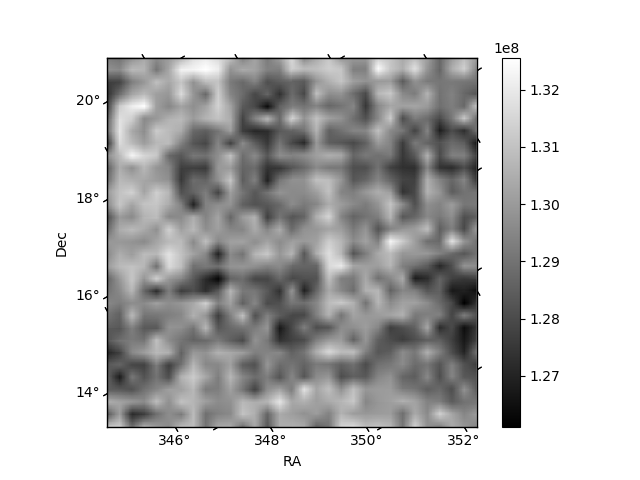
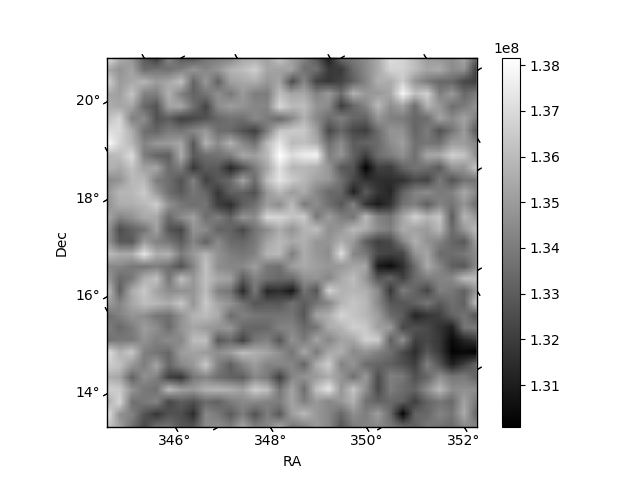
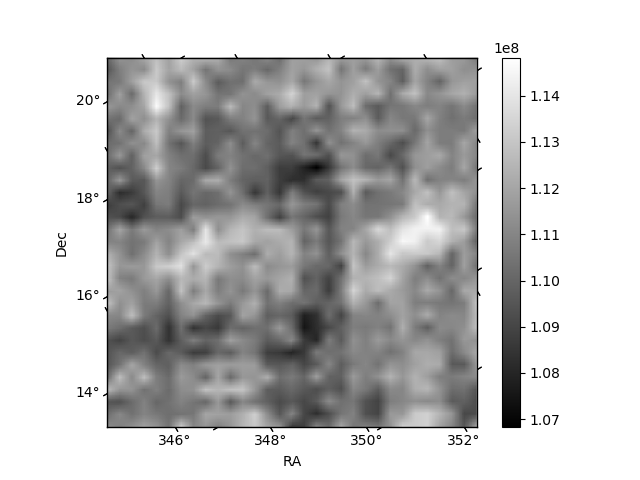
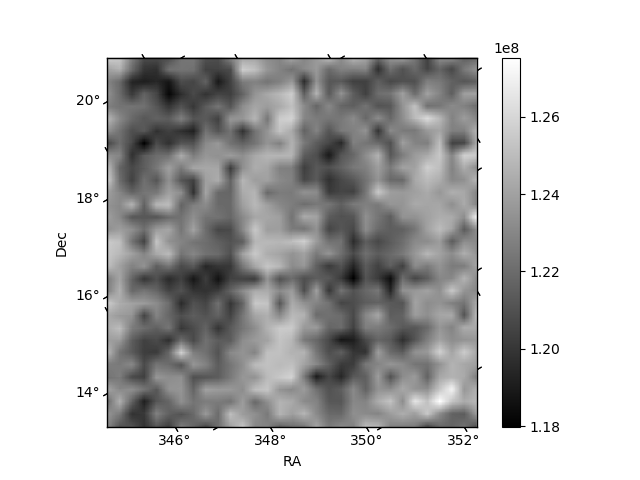
Histogram calculated using DETX and DETY for each event in the final _common_clean file
| Quadrant A | 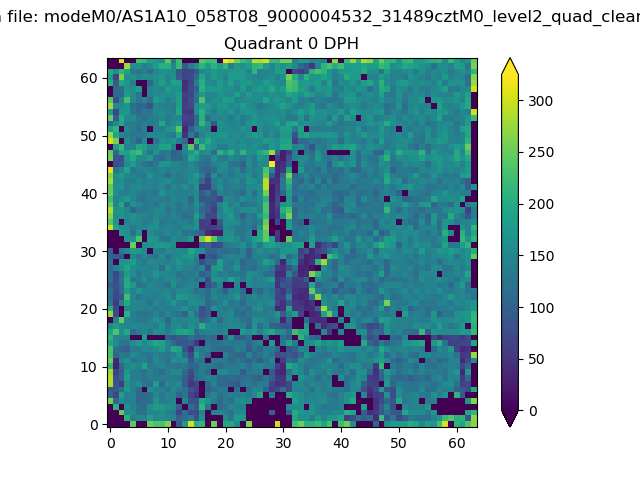 |
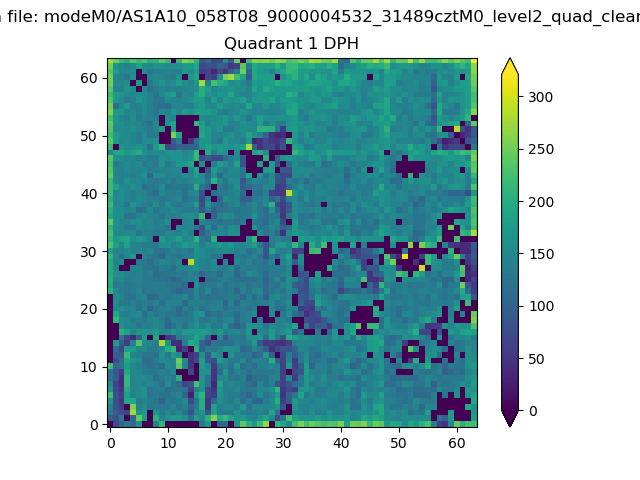 |
Quadrant B |
|---|---|---|---|
| Quadrant D | 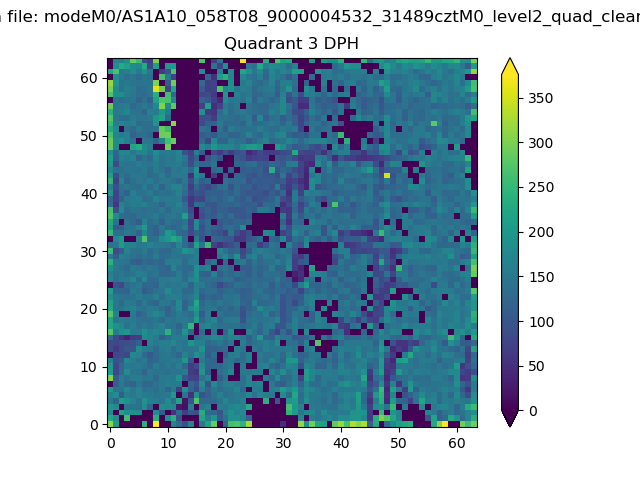 |
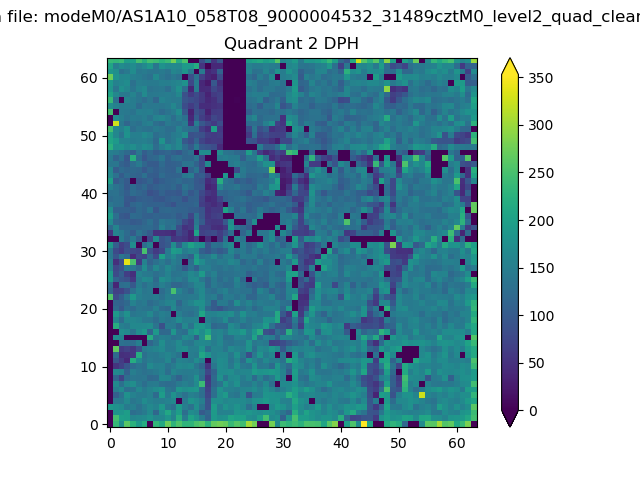 |
Quadrant C |
| Plot type | Count rate plots | Images |
|---|---|---|
| Comparison with Poisson distribution Blue bars denote a histogram of data divided into 1 sec bins. Red curve is a Poisson curve with rate = median count rate of data. |
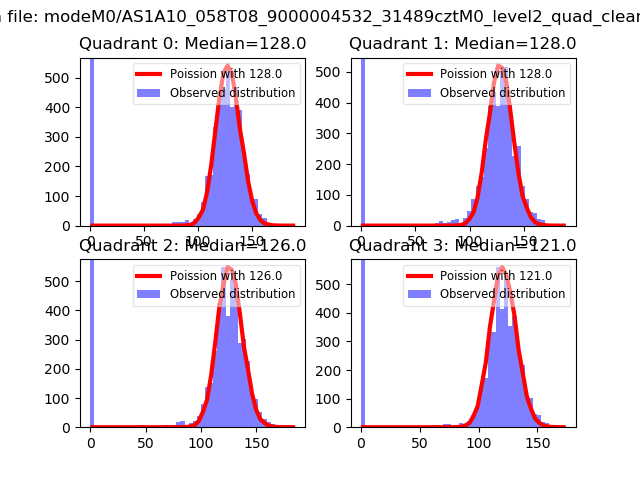 |
 |
| Quadrant-wise count rates Data is divided into 100 sec bins |
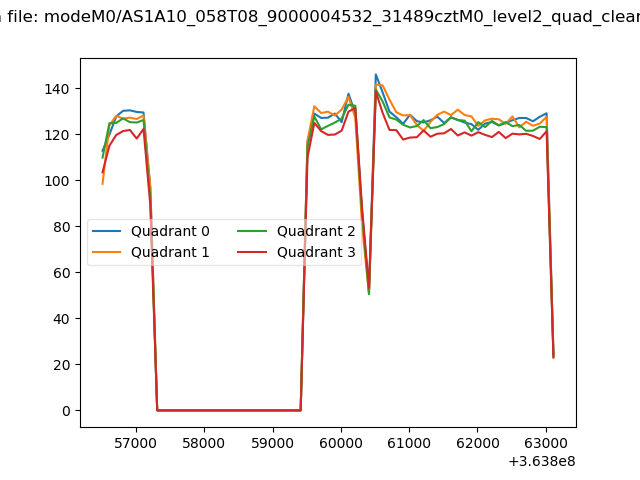 |
|
| Module-wise count rates for Quadrant A Data is divided into 100 sec bins |
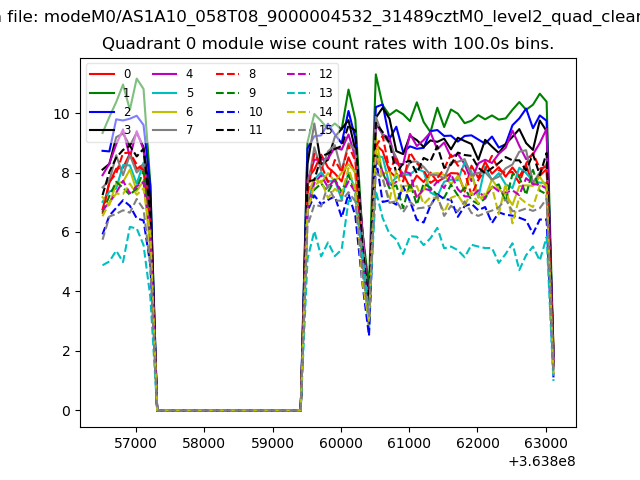 |
 |
| Module-wise count rates for Quadrant B Data is divided into 100 sec bins |
 |
 |
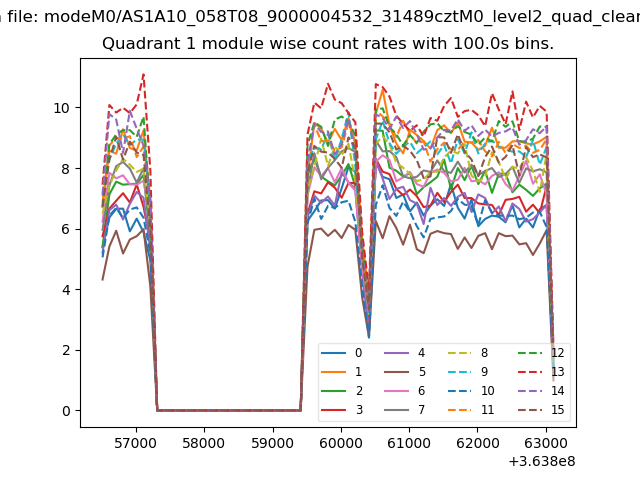
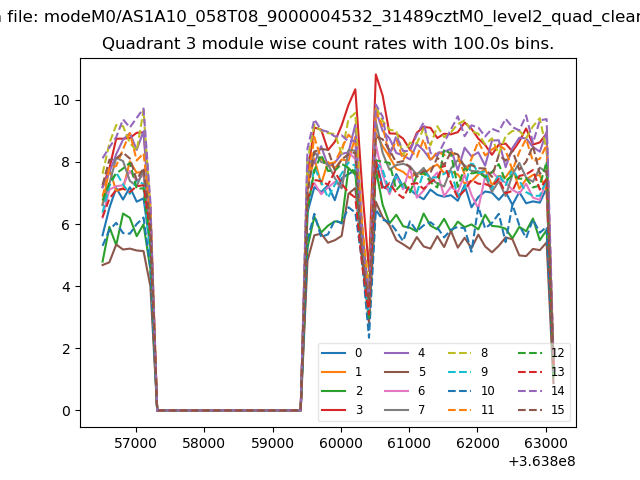
| Module-wise count rates for Quadrant C Data is divided into 100 sec bins |
 |
 |
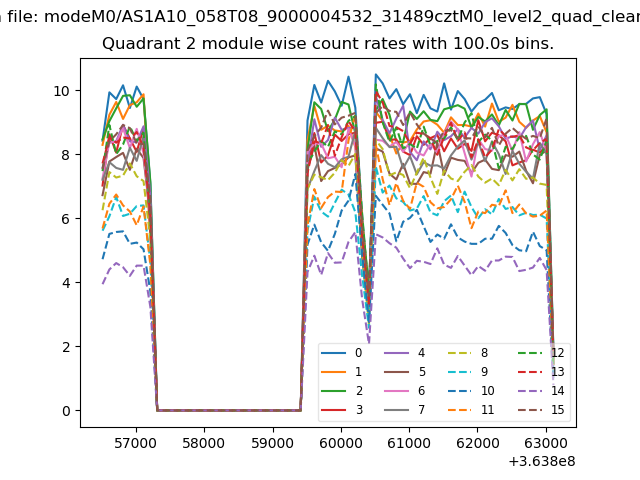
| Module-wise count rates for Quadrant D Data is divided into 100 sec bins |
 |
 |
| Parameter | Plot |
|---|---|
| CZT HV Monitor | 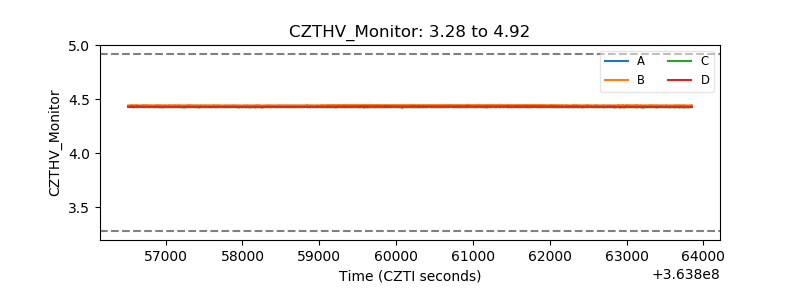 |
| D_VDD | 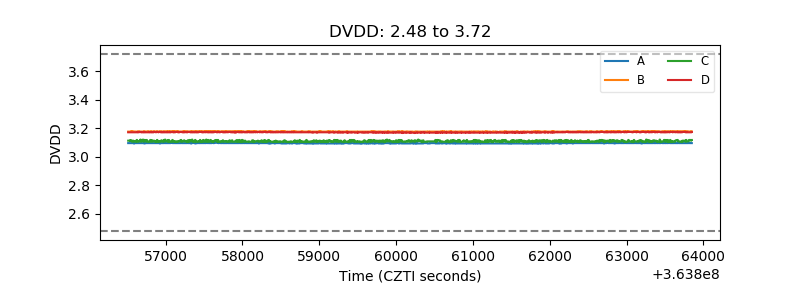 |
| Temperature 1 | 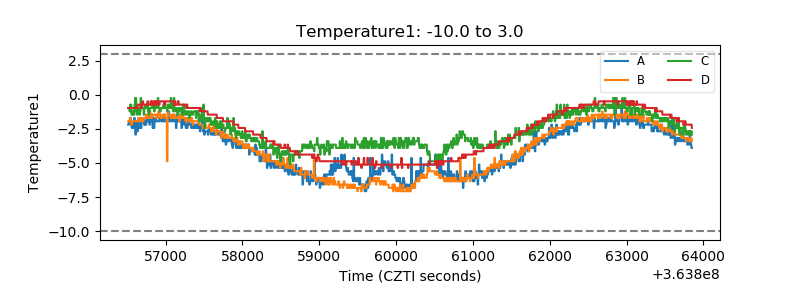 |
| Veto HV Monitor | 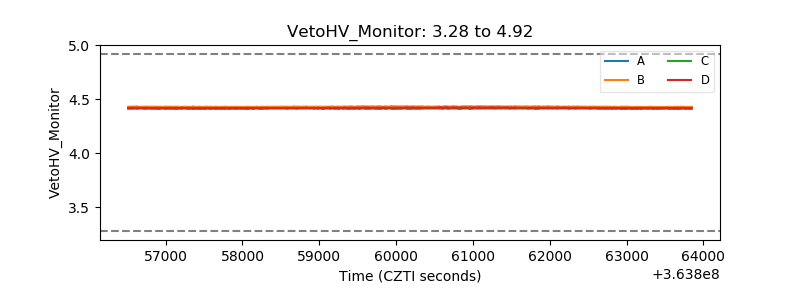 |
| Veto LLD | 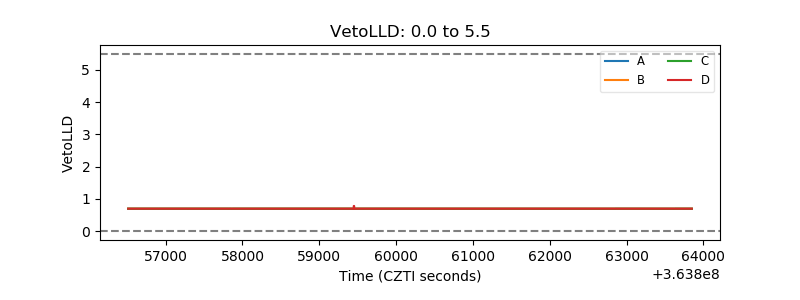 |
| Alpha Counter | 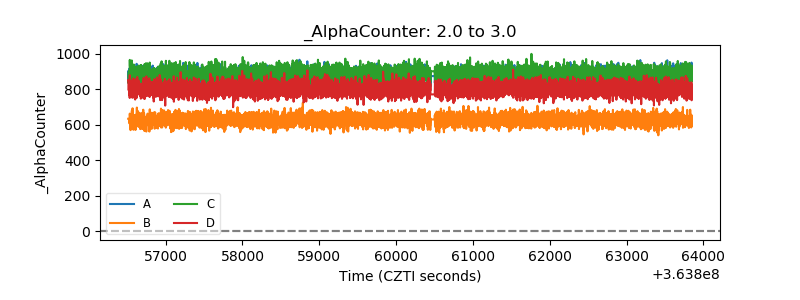 |
| _CPM_Rate | 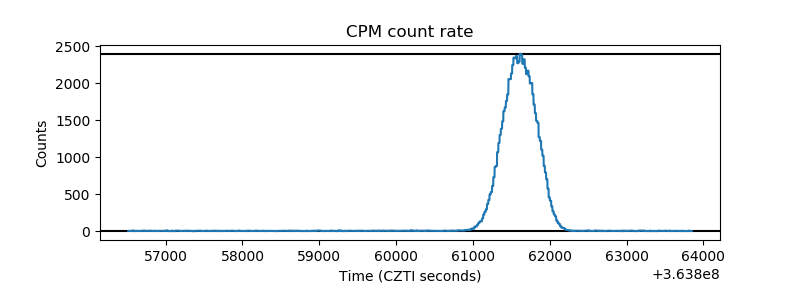 |
| CZT Counter | 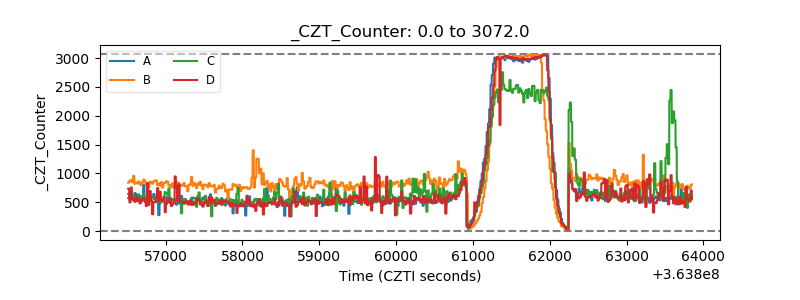 |
| +2.5 Volts monitor |  |
| +5 Volts monitor |  |
| _ROLL_ROT | 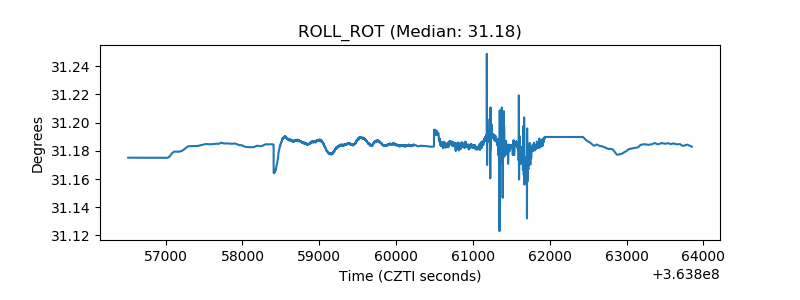 |
| _Roll_DEC | 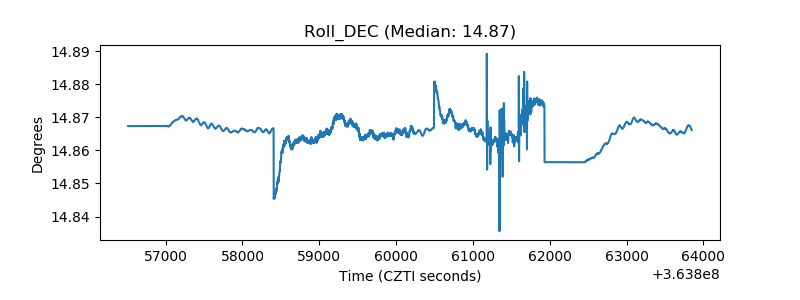 |
| _Roll_RA | 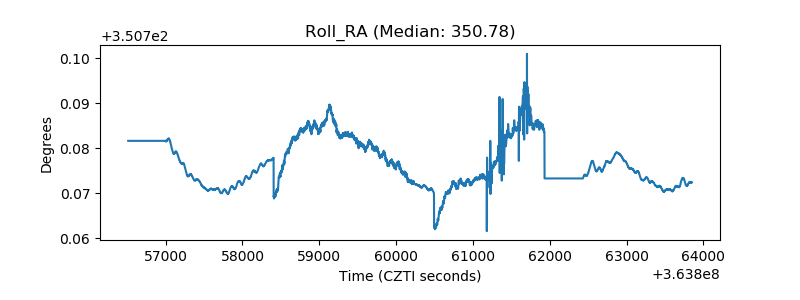 |
| Veto Counter | 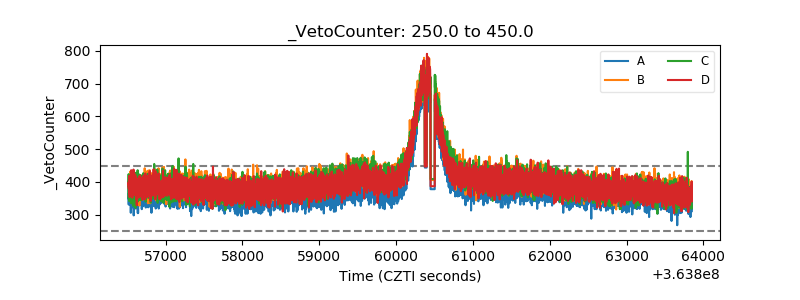 |