| Param | Original file | Final file |
|---|---|---|
| Filename | modeM0/AS1A10_053T27_9000004534cztM0_level2.fits | modeM0/AS1A10_053T27_9000004534cztM0_level2_quad_clean.evt |
| Size (bytes) | 194,454,720 | 185,693,760 |
| Size | 185.4 MB | 177.1 MB |
| Events in quadrant A | 1,221,042 | 1,132,461 |
| Events in quadrant B | 1,114,582 | 1,103,940 |
| Events in quadrant C | 1,124,988 | 1,022,360 |
| Events in quadrant D | 1,053,162 | 990,119 |
| Mode SS | |||
|---|---|---|---|
| Quadrant | BADHDUFLAG | Total packets | Discarded packets |
| A | 0 | 406 | 0 |
| B | 0 | 406 | 0 |
| C | 0 | 406 | 0 |
| D | 0 | 406 | 0 |
| Mode M9 | |||
|---|---|---|---|
| Quadrant | BADHDUFLAG | Total packets | Discarded packets |
| A | 0 | 18 | 0 |
| B | 0 | 18 | 0 |
| C | 0 | 18 | 0 |
| D | 0 | 18 | 0 |
| Mode M0 | |||
|---|---|---|---|
| Quadrant | BADHDUFLAG | Total packets | Discarded packets |
| A | 0 | 41687 | 0 |
| B | 0 | 64030 | 0 |
| C | 0 | 57408 | 0 |
| D | 0 | 48142 | 0 |
| Quadrant | Total seconds | Saturated seconds | Saturation percentage |
|---|---|---|---|
| A | 19953 | 433 | 2.170100% |
| B | 19953 | 1208 | 6.054227% |
| C | 19953 | 2038 | 10.214003% |
| D | 19953 | 455 | 2.280359% |
Noise dominated data is calculated using 1-second bins in cleaned event files. If a bin has >2000 counts, and if more than 50% of those come from <1% of pixels, then it is considered to be noise-dominated and hence unusable.
| Quadrant | # 1 sec bins | Bins with >0 counts | Bins with >2000 counts | High rate bins dominated by noise | Noise dominated (total time) | Noise dominated (detector-on time) | Marked lightcurve |
|---|---|---|---|---|---|---|---|
| A | 21693 | 19953 | 0 | 0 | 0.00% | 0.00% |  |
| B | 21693 | 19944 | 0 | 0 | 0.00% | 0.00% |  |
| C | 21693 | 19928 | 0 | 0 | 0.00% | 0.00% | 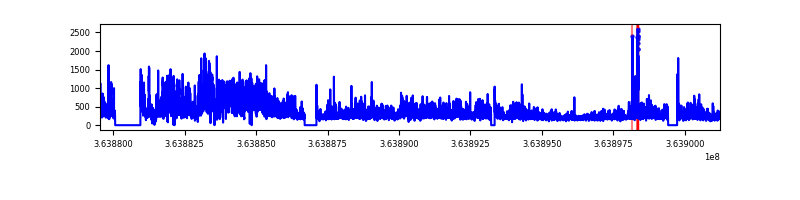 |
| D | 21693 | 19953 | 0 | 0 | 0.00% | 0.00% | 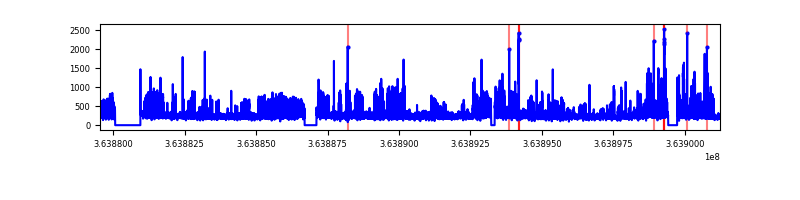 |
Top three noisy pixels from each quadrant. If the there are fewer than three noisy pixels in the level2.evt file, extra rows are filled as -1
| Pixel properties | Quadrant properties | ||||||
|---|---|---|---|---|---|---|---|
| Quadrant | DetID | PixID | Counts | Sigma | Mean | Median | Sigma |
| A | 0 | 29 | 1179 | 11.06 | 317 | 297 | 79.7 |
| A | 7 | 110 | 1003 | 8.86 | 317 | 297 | 79.7 |
| A | 9 | 19 | 960 | 8.32 | 317 | 297 | 79.7 |
| B | 2 | 9 | 873 | 9.71 | 294 | 279 | 61.2 |
| B | 3 | 17 | 757 | 7.81 | 294 | 279 | 61.2 |
| B | 3 | 80 | 757 | 7.81 | 294 | 279 | 61.2 |
| C | 1 | 80 | 872 | 7.87 | 296 | 277 | 75.5 |
| C | 12 | 241 | 863 | 7.76 | 296 | 277 | 75.5 |
| C | 1 | 81 | 839 | 7.44 | 296 | 277 | 75.5 |
| D | 4 | 246 | 795 | 6.45 | 300 | 274 | 80.8 |
| D | 10 | 189 | 742 | 5.79 | 300 | 274 | 80.8 |
| D | 4 | 160 | 737 | 5.73 | 300 | 274 | 80.8 |
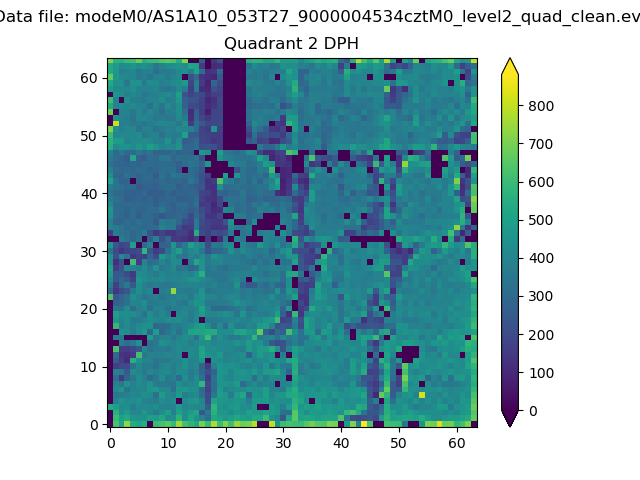
Histogram calculated using DETX and DETY for each event in the final _common_clean file
| Quadrant A | 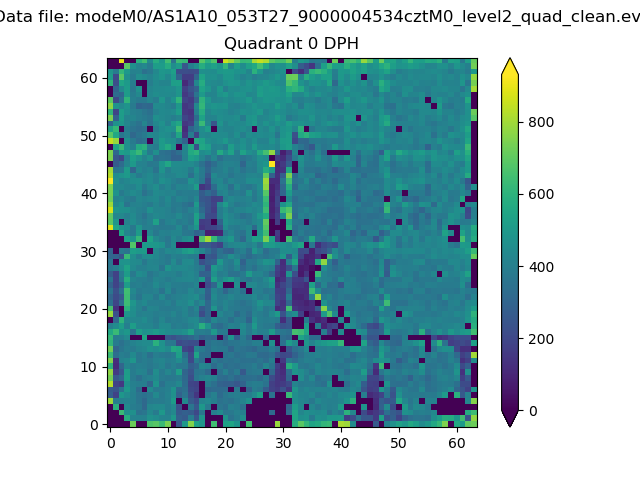 |
 |
Quadrant B |
|---|---|---|---|
| Quadrant D | 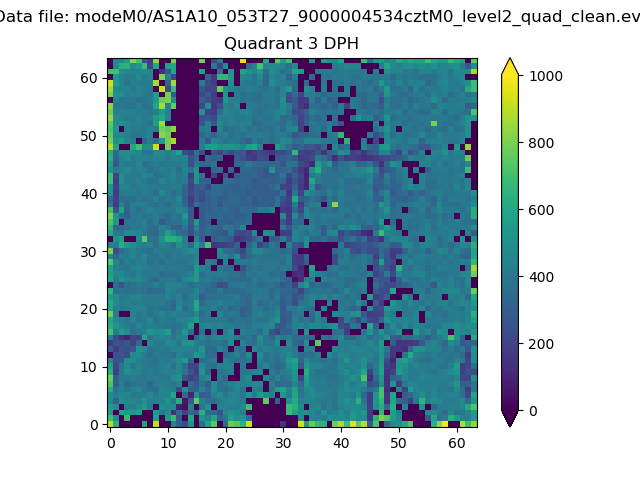 |
 |
Quadrant C |
| Plot type | Count rate plots | Images |
|---|---|---|
| Comparison with Poisson distribution Blue bars denote a histogram of data divided into 1 sec bins. Red curve is a Poisson curve with rate = median count rate of data. |
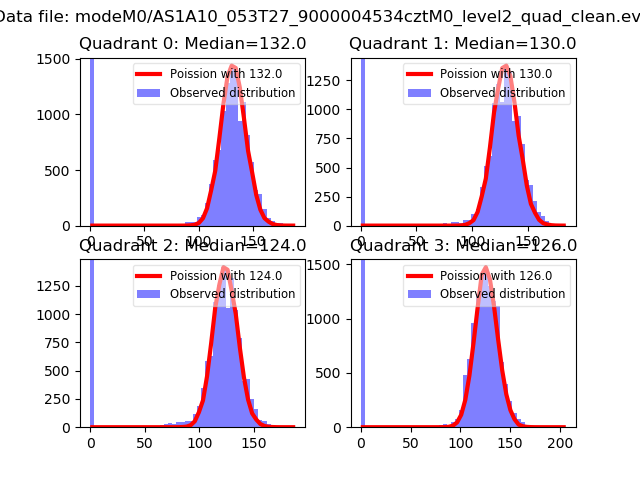 |
 |
| Quadrant-wise count rates Data is divided into 100 sec bins |
 |
|
| Module-wise count rates for Quadrant A Data is divided into 100 sec bins |
 |
 |
| Module-wise count rates for Quadrant B Data is divided into 100 sec bins |
 |
 |
| Module-wise count rates for Quadrant C Data is divided into 100 sec bins |
 |
 |
| Module-wise count rates for Quadrant D Data is divided into 100 sec bins |
 |
 |
| Parameter | Plot |
|---|---|
| CZT HV Monitor | 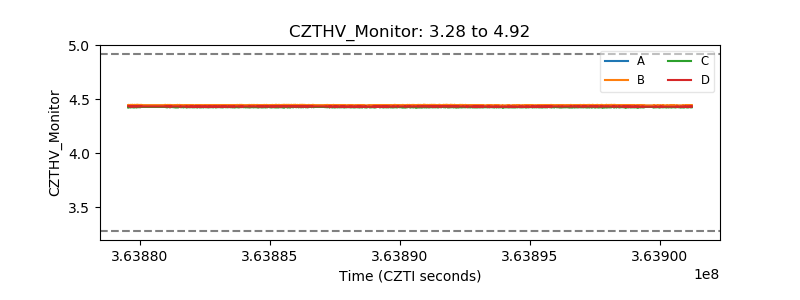 |
| D_VDD |  |
| Temperature 1 |  |
| Veto HV Monitor | 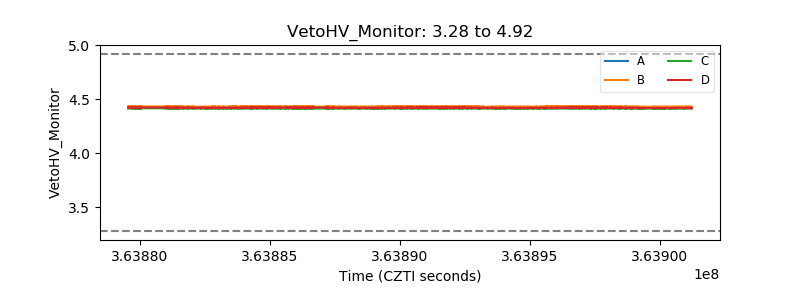 |
| Veto LLD |  |
| Alpha Counter |  |
| _CPM_Rate | 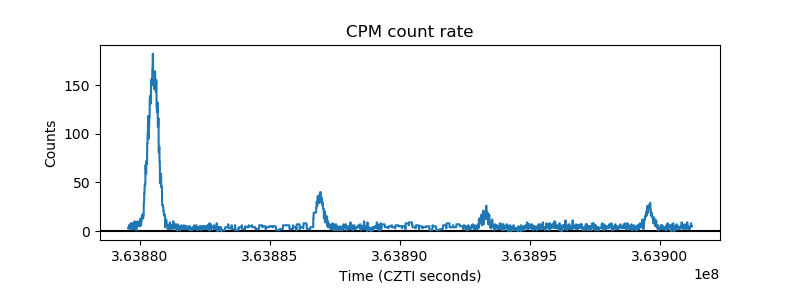 |
| CZT Counter |  |
| +2.5 Volts monitor |  |
| +5 Volts monitor |  |
| _ROLL_ROT | 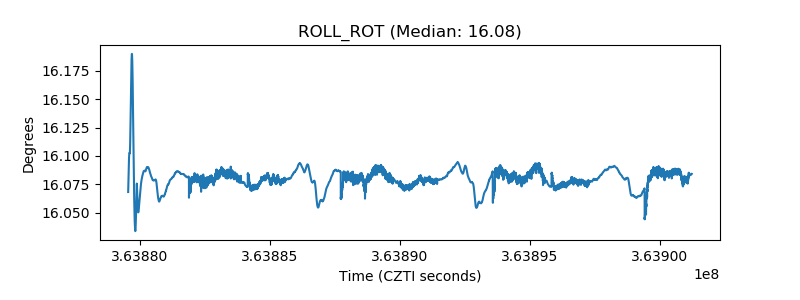 |
| _Roll_DEC |  |
| _Roll_RA |  |
| Veto Counter |  |