| Param | Original file | Final file |
|---|---|---|
| Filename | modeM0/AS1A10_053T27_9000004534_31313cztM0_level2.evt | modeM0/AS1A10_053T27_9000004534_31313cztM0_level2_quad_clean.evt |
| Size (bytes) | 706,040,640 | 76,737,600 |
| Size | 673.3 MB | 73.2 MB |
| Events in quadrant A | 3,629,883 | 474,658 |
| Events in quadrant B | 5,895,607 | 467,870 |
| Events in quadrant C | 7,099,873 | 424,943 |
| Events in quadrant D | 4,267,926 | 452,036 |
| Mode SS | |||
|---|---|---|---|
| Quadrant | BADHDUFLAG | Total packets | Discarded packets |
| A | 0 | 146 | 0 |
| B | 0 | 146 | 0 |
| C | 0 | 146 | 0 |
| D | 0 | 146 | 0 |
| Mode M9 | |||
|---|---|---|---|
| Quadrant | BADHDUFLAG | Total packets | Discarded packets |
| A | 0 | 8 | 0 |
| B | 0 | 9 | 0 |
| C | 0 | 9 | 0 |
| D | 0 | 9 | 0 |
| Mode M0 | |||
|---|---|---|---|
| Quadrant | BADHDUFLAG | Total packets | Discarded packets |
| A | 0 | 15200 | 2 |
| B | 0 | 22652 | 2 |
| C | 0 | 26106 | 2 |
| D | 0 | 17344 | 2 |
| Quadrant | Total seconds | Saturated seconds | Saturation percentage |
|---|---|---|---|
| A | 7238 | 163 | 2.252003% |
| B | 7238 | 304 | 4.200055% |
| C | 7238 | 1431 | 19.770655% |
| D | 7238 | 127 | 1.754628% |
Noise dominated data is calculated using 1-second bins in cleaned event files. If a bin has >2000 counts, and if more than 50% of those come from <1% of pixels, then it is considered to be noise-dominated and hence unusable.
| Quadrant | # 1 sec bins | Bins with >0 counts | Bins with >2000 counts | High rate bins dominated by noise | Noise dominated (total time) | Noise dominated (detector-on time) | Marked lightcurve |
|---|---|---|---|---|---|---|---|
| A | 7653 | 7239 | 0 | 0 | 0.00% | 0.00% | 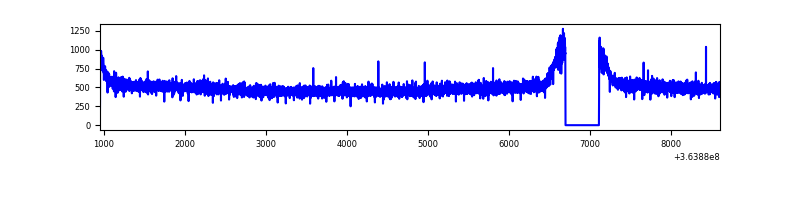 |
| B | 7653 | 7239 | 16 | 16 | 0.21% | 0.22% | 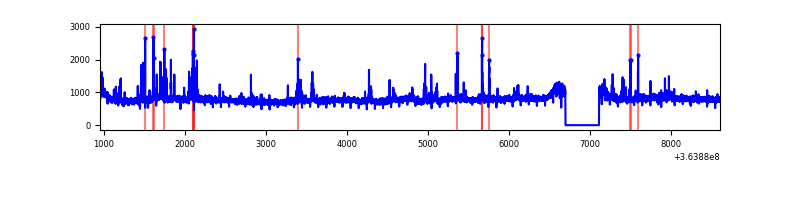 |
| C | 7653 | 7239 | 255 | 255 | 3.33% | 3.52% | 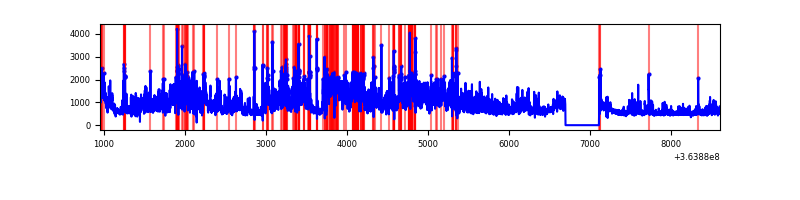 |
| D | 7653 | 7239 | 5 | 5 | 0.07% | 0.07% | 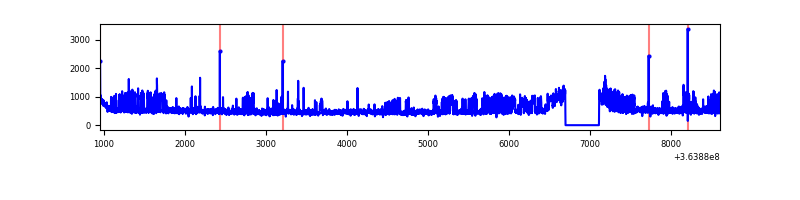 |
Top three noisy pixels from each quadrant. If the there are fewer than three noisy pixels in the level2.evt file, extra rows are filled as -1
| Pixel properties | Quadrant properties | ||||||
|---|---|---|---|---|---|---|---|
| Quadrant | DetID | PixID | Counts | Sigma | Mean | Median | Sigma |
| A | 13 | 254 | 13343 | 65.93 | 940 | 919 | 188.4 |
| A | 3 | 137 | 9542 | 45.76 | 940 | 919 | 188.4 |
| A | 0 | 226 | 7986 | 37.5 | 940 | 919 | 188.4 |
| B | 6 | 159 | 1994980 | 11206.15 | 916 | 891 | 177.9 |
| B | 4 | 80 | 197729 | 1106.17 | 916 | 891 | 177.9 |
| B | 0 | 190 | 34810 | 190.61 | 916 | 891 | 177.9 |
| C | 3 | 233 | 3290301 | 16702.48 | 837 | 842 | 196.9 |
| C | 14 | 238 | 268557 | 1359.34 | 837 | 842 | 196.9 |
| C | 14 | 254 | 195487 | 988.33 | 837 | 842 | 196.9 |
| D | 8 | 195 | 737477 | 3368.49 | 915 | 895 | 218.7 |
| D | 2 | 234 | 32814 | 145.97 | 915 | 895 | 218.7 |
| D | 2 | 250 | 21381 | 93.69 | 915 | 895 | 218.7 |
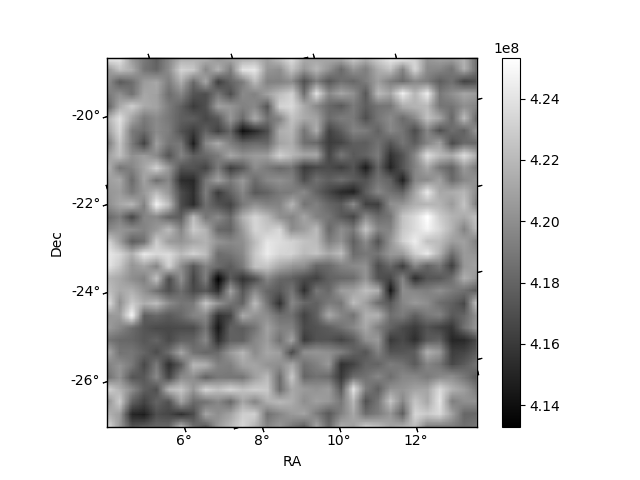
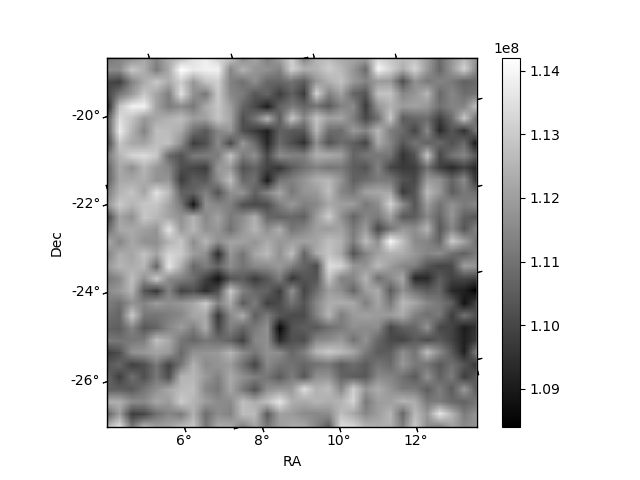
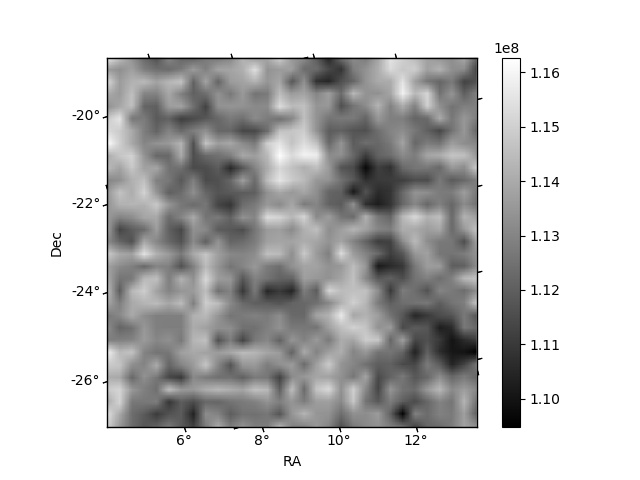
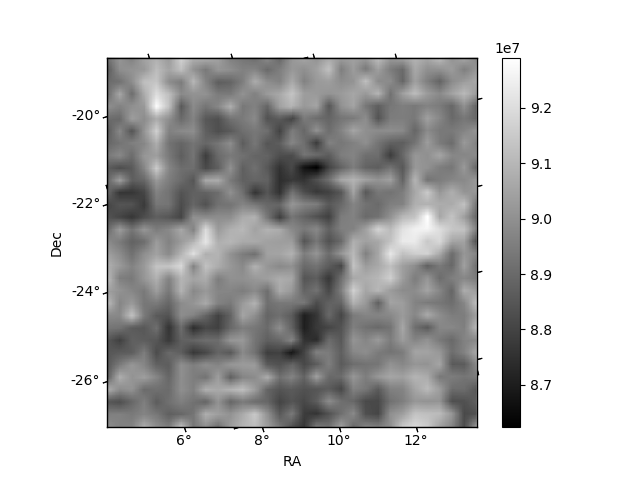
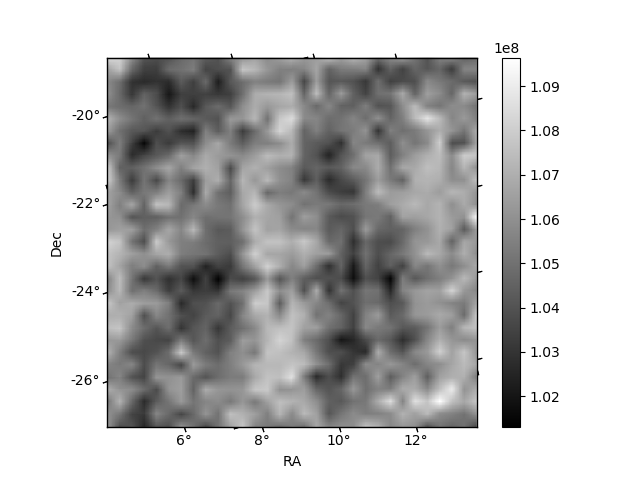
Histogram calculated using DETX and DETY for each event in the final _common_clean file
| Quadrant A | 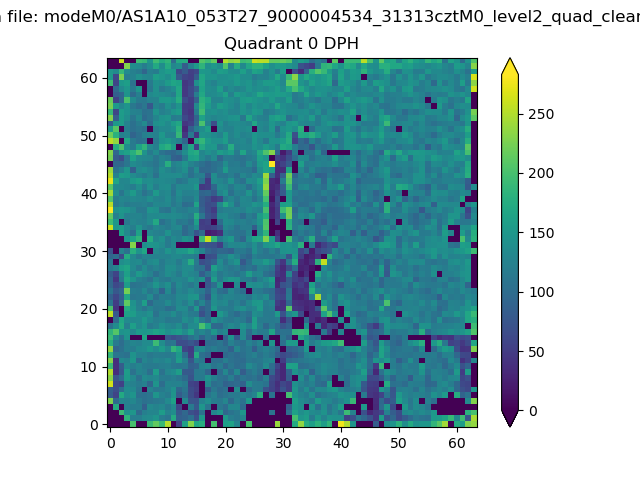 |
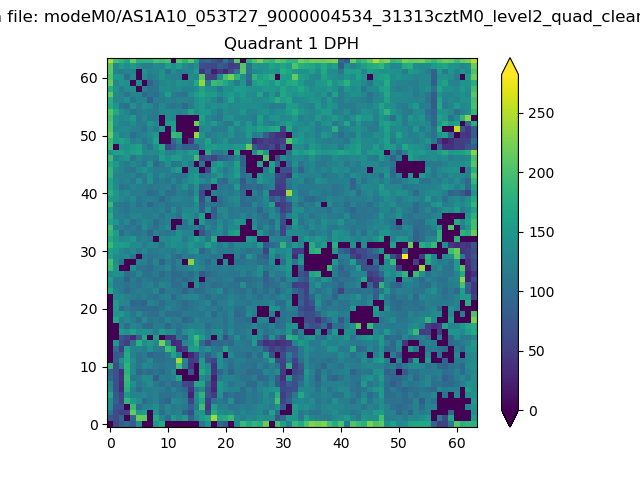 |
Quadrant B |
|---|---|---|---|
| Quadrant D |  |
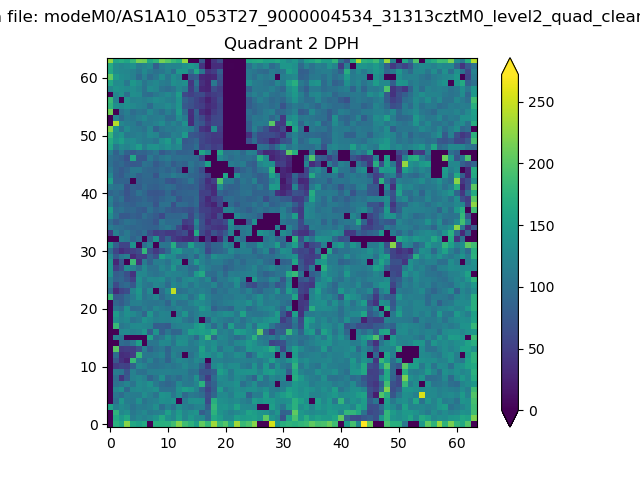 |
Quadrant C |
| Plot type | Count rate plots | Images |
|---|---|---|
| Comparison with Poisson distribution Blue bars denote a histogram of data divided into 1 sec bins. Red curve is a Poisson curve with rate = median count rate of data. |
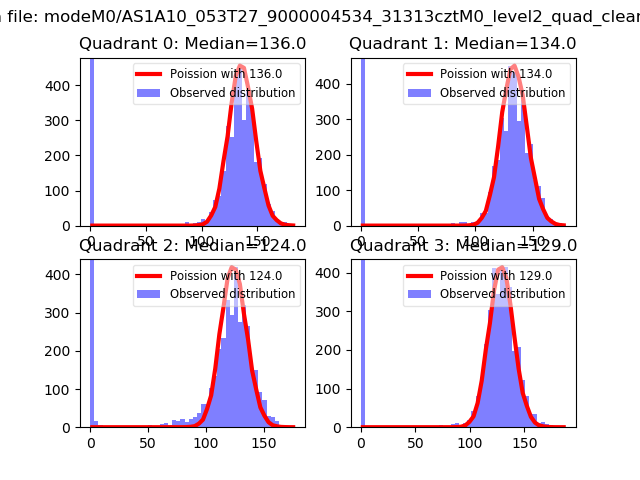 |
 |
| Quadrant-wise count rates Data is divided into 100 sec bins |
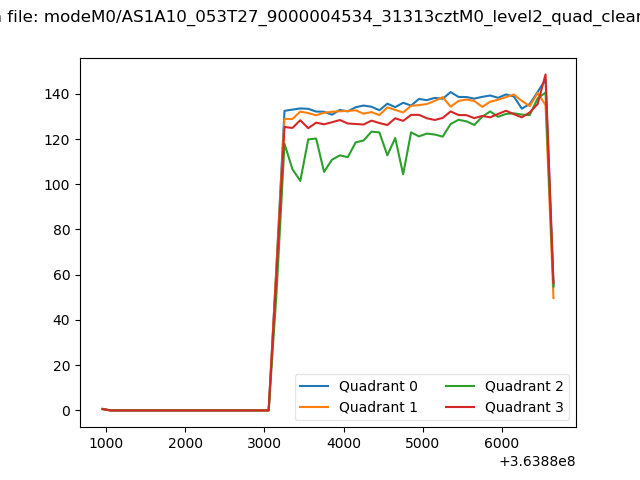 |
|
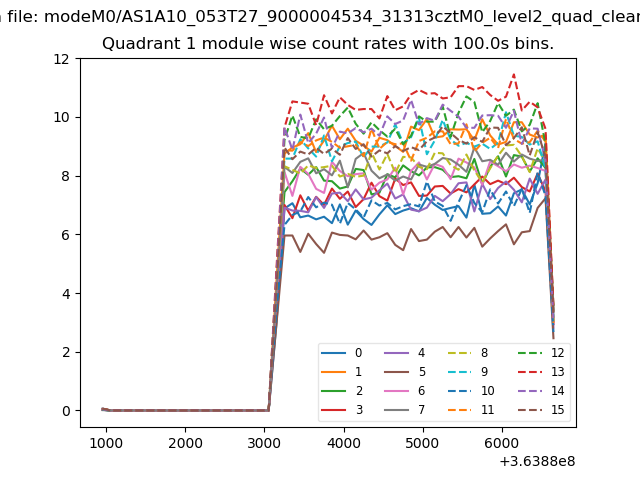
| Module-wise count rates for Quadrant A Data is divided into 100 sec bins |
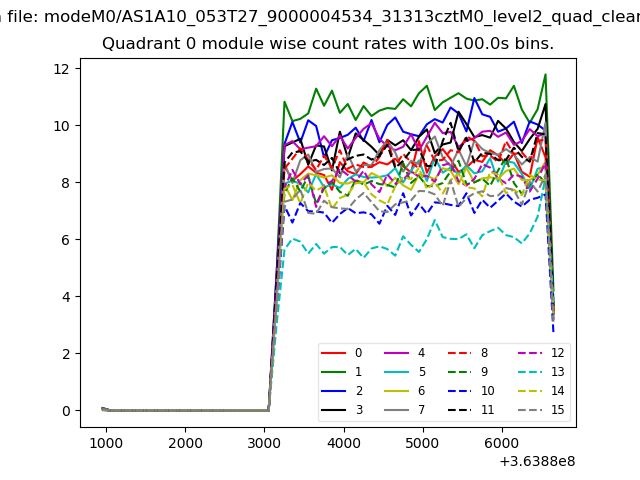 |
 |
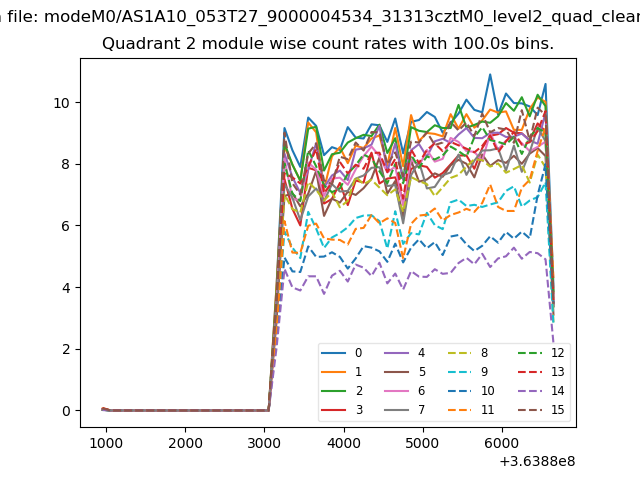
| Module-wise count rates for Quadrant B Data is divided into 100 sec bins |
 |
 |
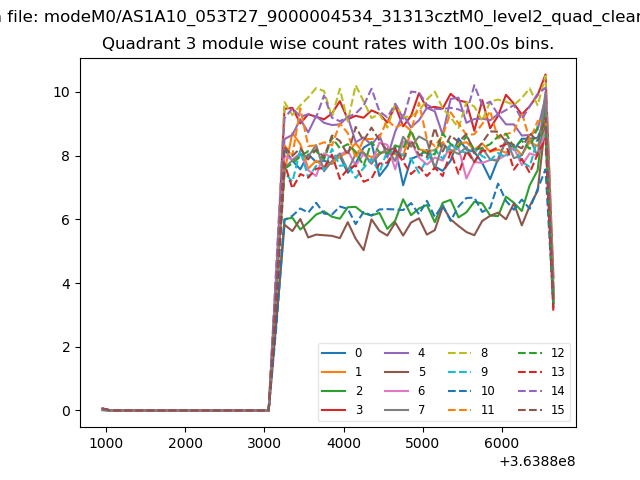
| Module-wise count rates for Quadrant C Data is divided into 100 sec bins |
 |
 |
| Module-wise count rates for Quadrant D Data is divided into 100 sec bins |
 |
 |
| Parameter | Plot |
|---|---|
| CZT HV Monitor | 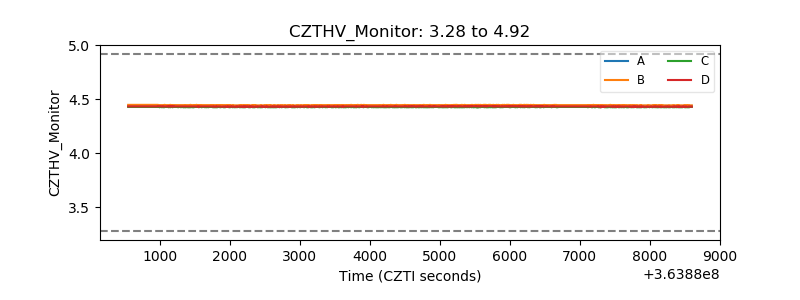 |
| D_VDD | 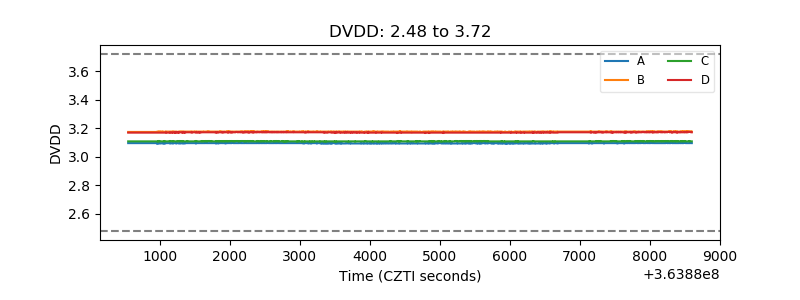 |
| Temperature 1 | 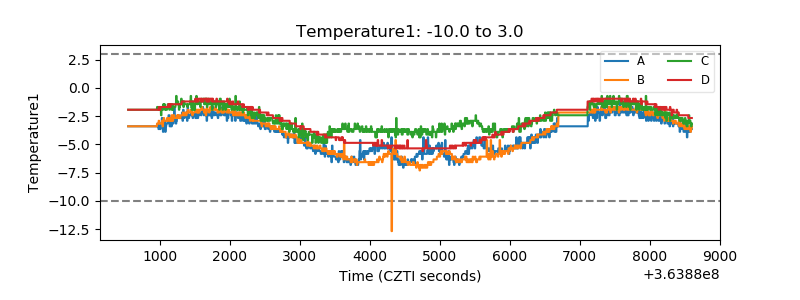 |
| Veto HV Monitor | 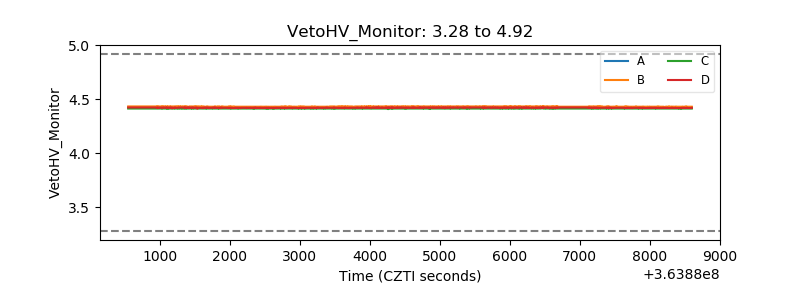 |
| Veto LLD |  |
| Alpha Counter | 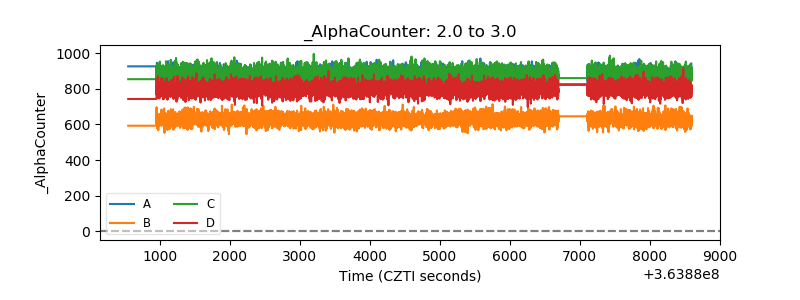 |
| _CPM_Rate | 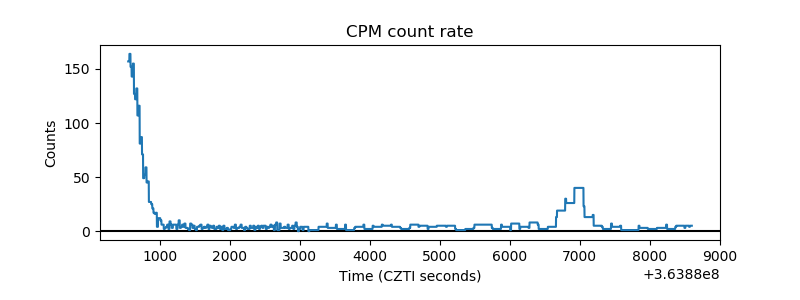 |
| CZT Counter | 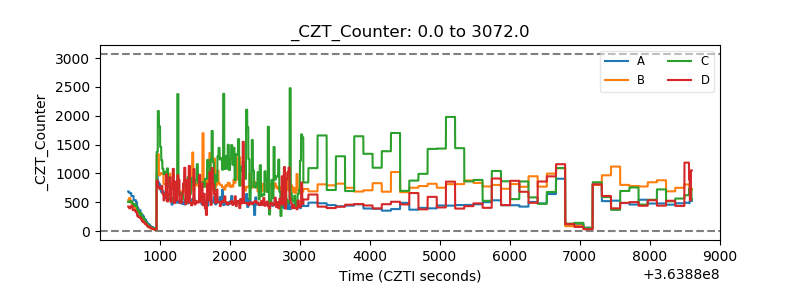 |
| +2.5 Volts monitor |  |
| +5 Volts monitor | 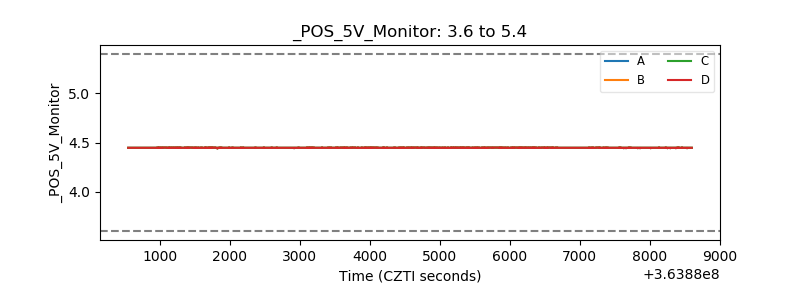 |
| _ROLL_ROT | 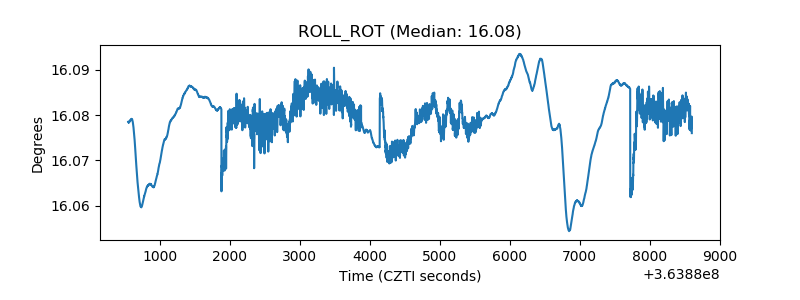 |
| _Roll_DEC | 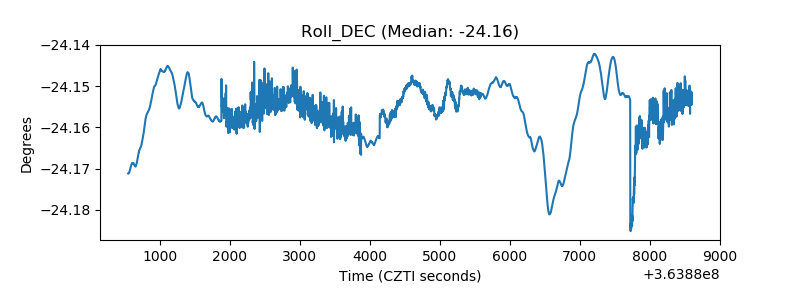 |
| _Roll_RA | 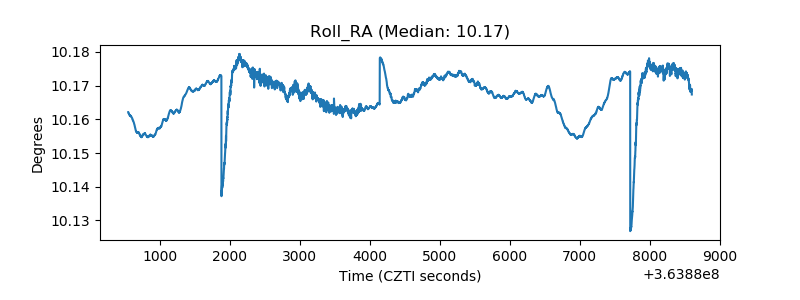 |
| Veto Counter | 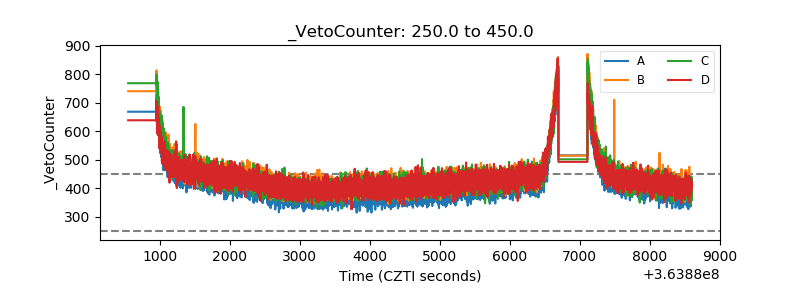 |