| Param | Original file | Final file |
|---|---|---|
| Filename | modeM0/AS1A10_053T27_9000004534_31314cztM0_level2.evt | modeM0/AS1A10_053T27_9000004534_31314cztM0_level2_quad_clean.evt |
| Size (bytes) | 640,442,880 | 79,280,640 |
| Size | 610.8 MB | 75.6 MB |
| Events in quadrant A | 3,662,514 | 485,214 |
| Events in quadrant B | 6,067,639 | 477,540 |
| Events in quadrant C | 4,735,400 | 456,549 |
| Events in quadrant D | 4,423,770 | 460,495 |
| Mode SS | |||
|---|---|---|---|
| Quadrant | BADHDUFLAG | Total packets | Discarded packets |
| A | 0 | 150 | 0 |
| B | 0 | 150 | 0 |
| C | 0 | 150 | 0 |
| D | 0 | 150 | 0 |
| Mode M9 | |||
|---|---|---|---|
| Quadrant | BADHDUFLAG | Total packets | Discarded packets |
| A | 0 | 2 | 0 |
| B | 0 | 2 | 0 |
| C | 0 | 2 | 0 |
| D | 0 | 2 | 0 |
| Mode M0 | |||
|---|---|---|---|
| Quadrant | BADHDUFLAG | Total packets | Discarded packets |
| A | 0 | 15549 | 0 |
| B | 0 | 23288 | 0 |
| C | 0 | 18965 | 0 |
| D | 0 | 17971 | 0 |
| Quadrant | Total seconds | Saturated seconds | Saturation percentage |
|---|---|---|---|
| A | 7491 | 141 | 1.882259% |
| B | 7490 | 298 | 3.978638% |
| C | 7490 | 317 | 4.232310% |
| D | 7490 | 154 | 2.056075% |
Noise dominated data is calculated using 1-second bins in cleaned event files. If a bin has >2000 counts, and if more than 50% of those come from <1% of pixels, then it is considered to be noise-dominated and hence unusable.
| Quadrant | # 1 sec bins | Bins with >0 counts | Bins with >2000 counts | High rate bins dominated by noise | Noise dominated (total time) | Noise dominated (detector-on time) | Marked lightcurve |
|---|---|---|---|---|---|---|---|
| A | 7616 | 7492 | 0 | 0 | 0.00% | 0.00% | 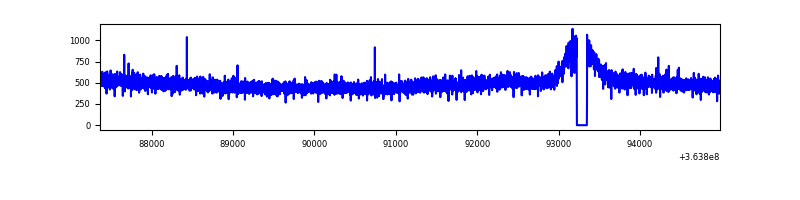 |
| B | 7615 | 7491 | 11 | 11 | 0.14% | 0.15% | 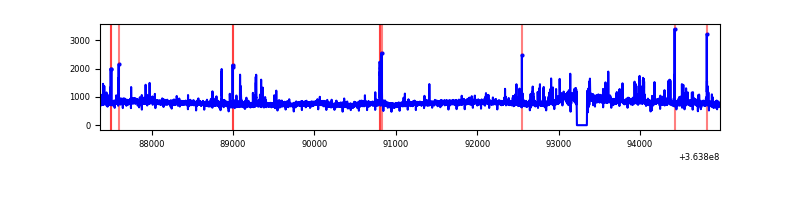 |
| C | 7615 | 7491 | 3 | 3 | 0.04% | 0.04% | 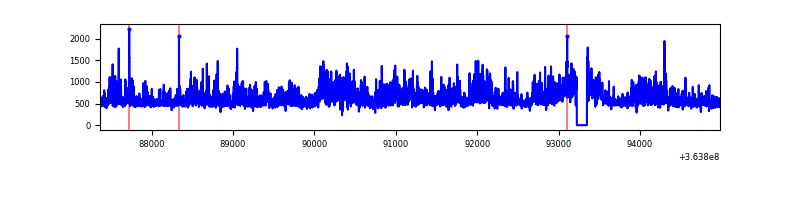 |
| D | 7615 | 7491 | 11 | 11 | 0.14% | 0.15% |  |
Top three noisy pixels from each quadrant. If the there are fewer than three noisy pixels in the level2.evt file, extra rows are filled as -1
| Pixel properties | Quadrant properties | ||||||
|---|---|---|---|---|---|---|---|
| Quadrant | DetID | PixID | Counts | Sigma | Mean | Median | Sigma |
| A | 13 | 254 | 13602 | 65.84 | 948 | 925 | 192.5 |
| A | 3 | 137 | 9843 | 46.32 | 948 | 925 | 192.5 |
| A | 0 | 226 | 7980 | 36.64 | 948 | 925 | 192.5 |
| B | 6 | 159 | 2138056 | 11830.64 | 927 | 901 | 180.6 |
| B | 4 | 80 | 184565 | 1016.71 | 927 | 901 | 180.6 |
| B | 0 | 230 | 35335 | 190.62 | 927 | 901 | 180.6 |
| C | 3 | 233 | 965072 | 4578.64 | 892 | 896 | 210.6 |
| C | 14 | 238 | 182107 | 860.52 | 892 | 896 | 210.6 |
| C | 14 | 254 | 57354 | 268.1 | 892 | 896 | 210.6 |
| D | 8 | 195 | 871445 | 3949.71 | 920 | 894 | 220.4 |
| D | 2 | 234 | 36976 | 163.7 | 920 | 894 | 220.4 |
| D | 2 | 250 | 35433 | 156.7 | 920 | 894 | 220.4 |
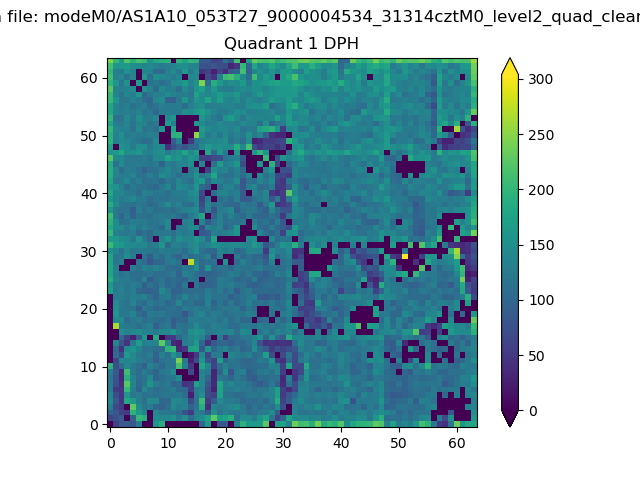
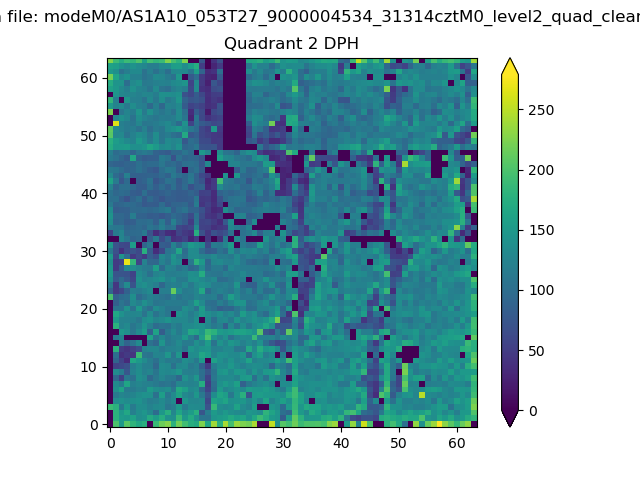
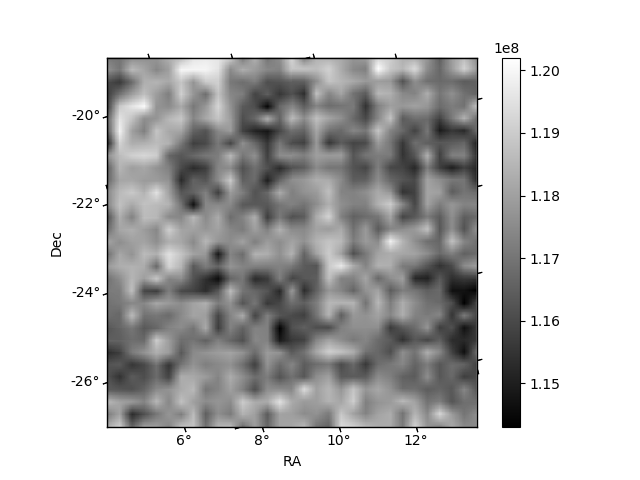
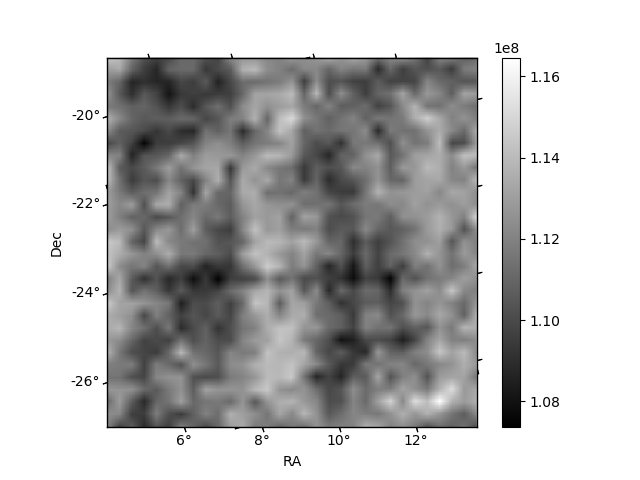
Histogram calculated using DETX and DETY for each event in the final _common_clean file
| Quadrant A | 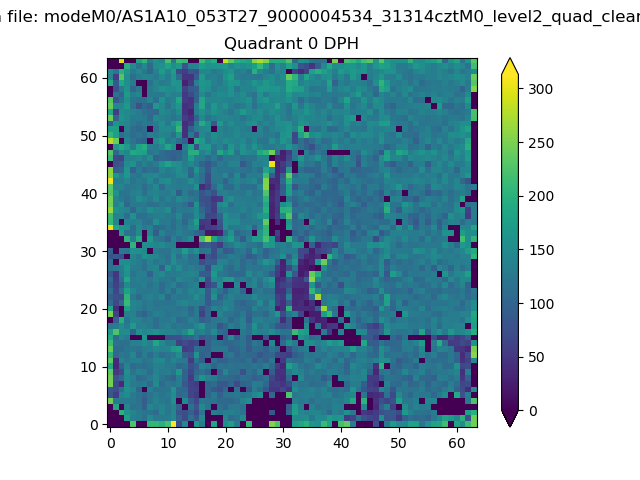 |
 |
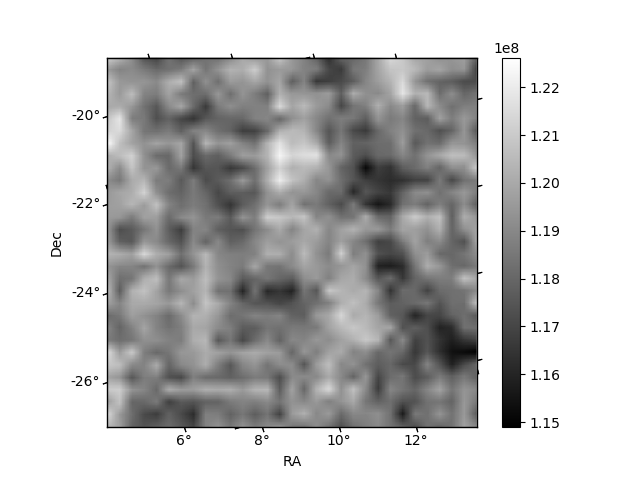
Quadrant B |
|---|---|---|---|
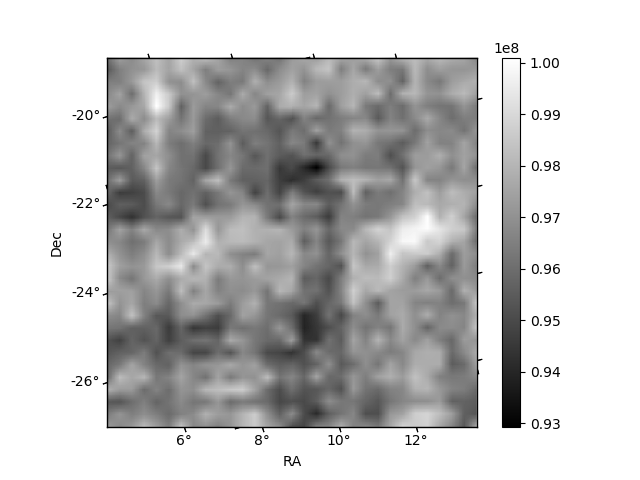
| Quadrant D | 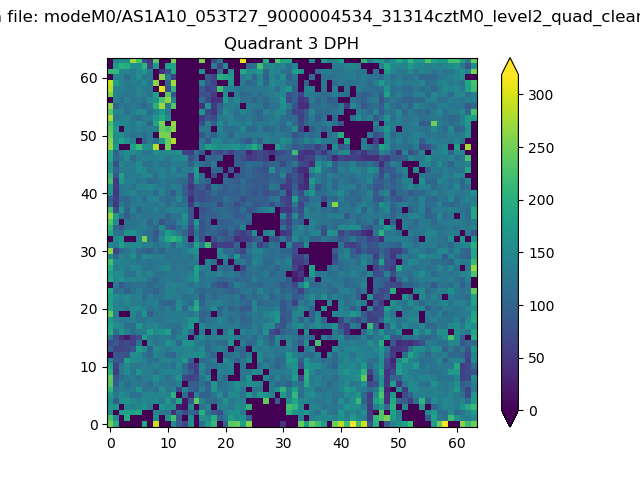 |
 |
Quadrant C |
| Plot type | Count rate plots | Images |
|---|---|---|
| Comparison with Poisson distribution Blue bars denote a histogram of data divided into 1 sec bins. Red curve is a Poisson curve with rate = median count rate of data. |
 |
 |
| Quadrant-wise count rates Data is divided into 100 sec bins |
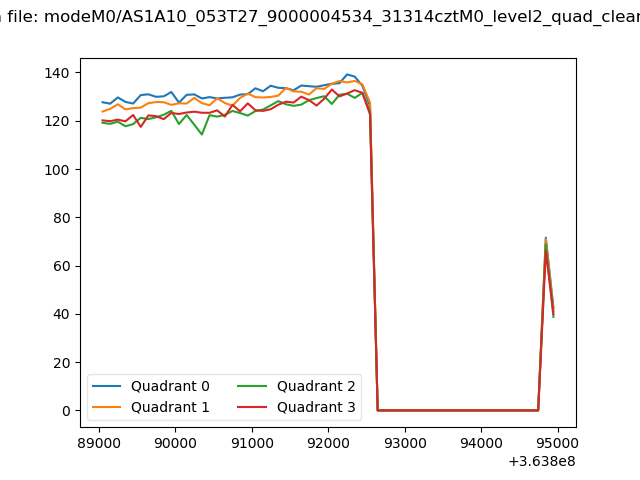 |
|
| Module-wise count rates for Quadrant A Data is divided into 100 sec bins |
 |
 |
| Module-wise count rates for Quadrant B Data is divided into 100 sec bins |
 |
 |
| Module-wise count rates for Quadrant C Data is divided into 100 sec bins |
 |
 |
| Module-wise count rates for Quadrant D Data is divided into 100 sec bins |
 |
 |
| Parameter | Plot |
|---|---|
| CZT HV Monitor |  |
| D_VDD |  |
| Temperature 1 | 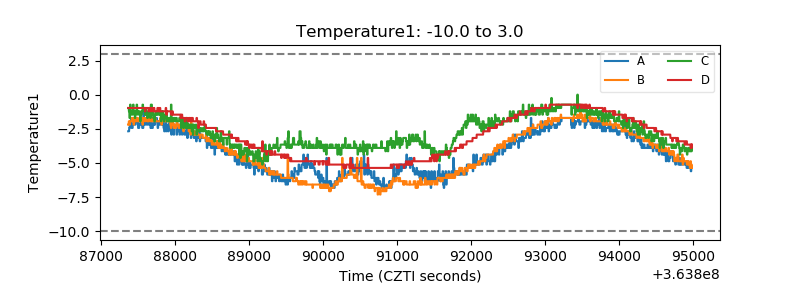 |
| Veto HV Monitor | 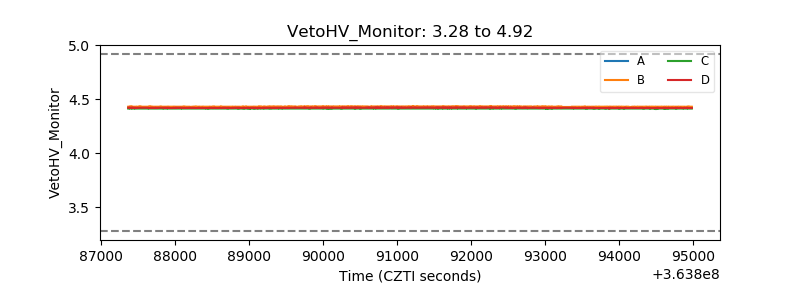 |
| Veto LLD |  |
| Alpha Counter | 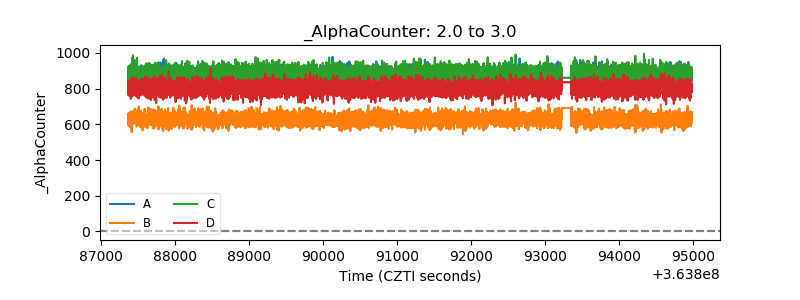 |
| _CPM_Rate | 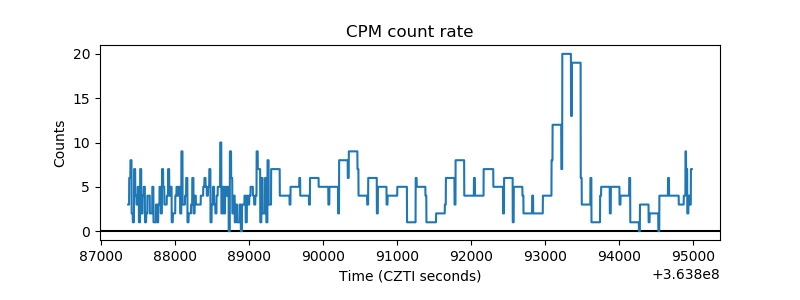 |
| CZT Counter | 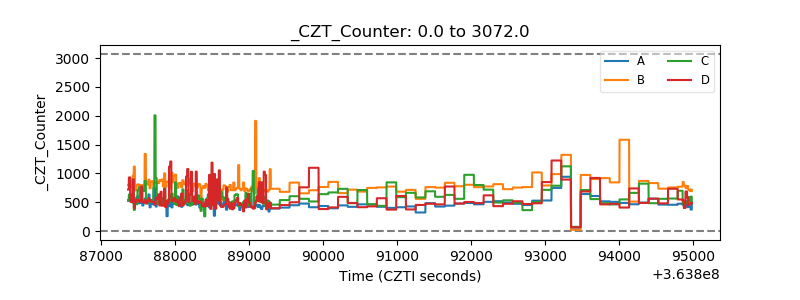 |
| +2.5 Volts monitor |  |
| +5 Volts monitor | 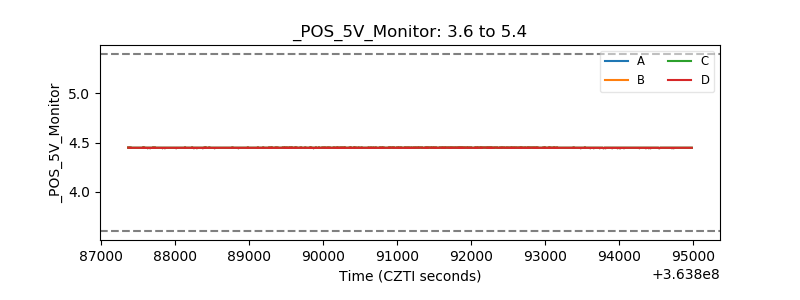 |
| _ROLL_ROT |  |
| _Roll_DEC | 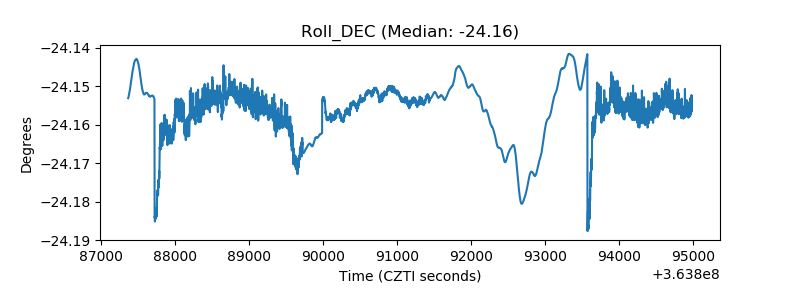 |
| _Roll_RA | 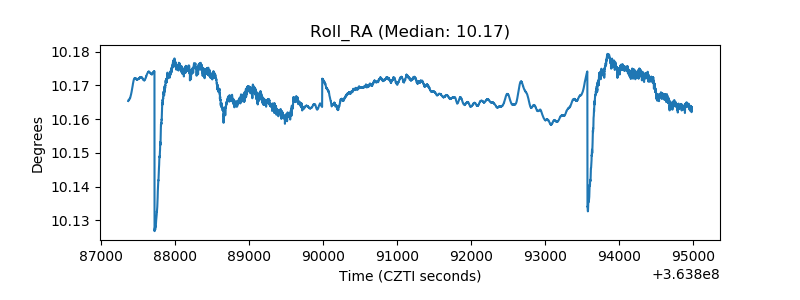 |
| Veto Counter |  |