| Param | Original file | Final file |
|---|---|---|
| Filename | modeM0/AS1A10_053T30_9000004536cztM0_level2.fits | modeM0/AS1A10_053T30_9000004536cztM0_level2_quad_clean.evt |
| Size (bytes) | 405,365,760 | 260,493,120 |
| Size | 386.6 MB | 248.4 MB |
| Events in quadrant A | 2,575,278 | 1,358,373 |
| Events in quadrant B | 2,343,366 | 1,322,064 |
| Events in quadrant C | 2,425,250 | 1,284,772 |
| Events in quadrant D | 2,207,964 | 1,197,148 |
| Mode M0 | |||
|---|---|---|---|
| Quadrant | BADHDUFLAG | Total packets | Discarded packets |
| A | 0 | 82863 | 0 |
| B | 0 | 131302 | 0 |
| C | 0 | 94796 | 0 |
| D | 0 | 92558 | 0 |
| Mode SS | |||
|---|---|---|---|
| Quadrant | BADHDUFLAG | Total packets | Discarded packets |
| A | 0 | 808 | 0 |
| B | 0 | 808 | 0 |
| C | 0 | 808 | 0 |
| D | 0 | 808 | 0 |
| Mode M9 | |||
|---|---|---|---|
| Quadrant | BADHDUFLAG | Total packets | Discarded packets |
| A | 0 | 68 | 0 |
| B | 0 | 68 | 0 |
| C | 0 | 68 | 0 |
| D | 0 | 68 | 0 |
| Quadrant | Total seconds | Saturated seconds | Saturation percentage |
|---|---|---|---|
| A | 39678 | 185 | 0.466253% |
| B | 39678 | 1680 | 4.234084% |
| C | 39678 | 1162 | 2.928575% |
| D | 39678 | 236 | 0.594788% |
Noise dominated data is calculated using 1-second bins in cleaned event files. If a bin has >2000 counts, and if more than 50% of those come from <1% of pixels, then it is considered to be noise-dominated and hence unusable.
| Quadrant | # 1 sec bins | Bins with >0 counts | Bins with >2000 counts | High rate bins dominated by noise | Noise dominated (total time) | Noise dominated (detector-on time) | Marked lightcurve |
|---|---|---|---|---|---|---|---|
| A | 46473 | 39678 | 0 | 0 | 0.00% | 0.00% |  |
| B | 46473 | 39674 | 0 | 0 | 0.00% | 0.00% |  |
| C | 46473 | 39675 | 0 | 0 | 0.00% | 0.00% | 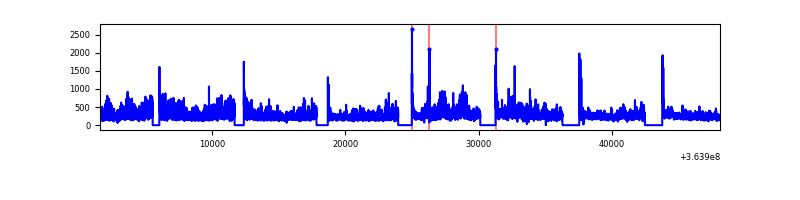 |
| D | 46473 | 39676 | 0 | 0 | 0.00% | 0.00% |  |
Top three noisy pixels from each quadrant. If the there are fewer than three noisy pixels in the level2.evt file, extra rows are filled as -1
| Pixel properties | Quadrant properties | ||||||
|---|---|---|---|---|---|---|---|
| Quadrant | DetID | PixID | Counts | Sigma | Mean | Median | Sigma |
| A | 0 | 29 | 2457 | 11.21 | 670 | 630 | 162.9 |
| A | 7 | 110 | 1951 | 8.11 | 670 | 630 | 162.9 |
| A | 9 | 19 | 1938 | 8.03 | 670 | 630 | 162.9 |
| B | 2 | 9 | 1866 | 10.29 | 619 | 594 | 123.6 |
| B | 5 | 225 | 1605 | 8.18 | 619 | 594 | 123.6 |
| B | 3 | 17 | 1554 | 7.77 | 619 | 594 | 123.6 |
| C | 1 | 81 | 1953 | 8.26 | 641 | 601 | 163.8 |
| C | 1 | 80 | 1867 | 7.73 | 641 | 601 | 163.8 |
| C | 12 | 241 | 1671 | 6.53 | 641 | 601 | 163.8 |
| D | 7 | 3 | 1574 | 5.98 | 630 | 577 | 166.7 |
| D | 6 | 231 | 1574 | 5.98 | 630 | 577 | 166.7 |
| D | 3 | 14 | 1558 | 5.89 | 630 | 577 | 166.7 |
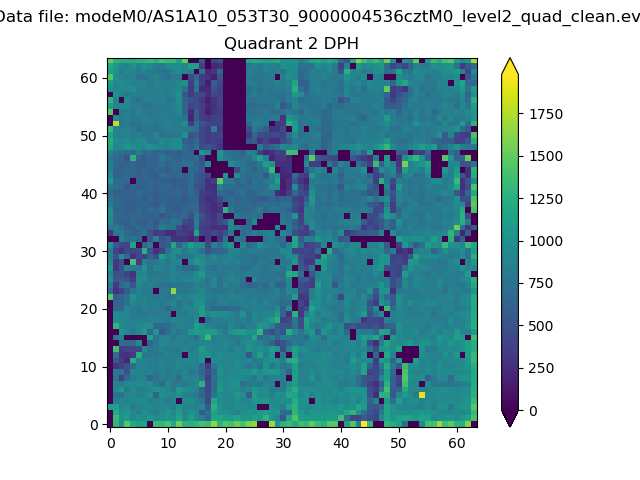
Histogram calculated using DETX and DETY for each event in the final _common_clean file
| Quadrant A |  |
 |
Quadrant B |
|---|---|---|---|
| Quadrant D |  |
 |
Quadrant C |
| Plot type | Count rate plots | Images |
|---|---|---|
| Comparison with Poisson distribution Blue bars denote a histogram of data divided into 1 sec bins. Red curve is a Poisson curve with rate = median count rate of data. |
 |
 |
| Quadrant-wise count rates Data is divided into 100 sec bins |
 |
|
| Module-wise count rates for Quadrant A Data is divided into 100 sec bins |
 |
 |
| Module-wise count rates for Quadrant B Data is divided into 100 sec bins |
 |
 |
| Module-wise count rates for Quadrant C Data is divided into 100 sec bins |
 |
 |
| Module-wise count rates for Quadrant D Data is divided into 100 sec bins |
 |
 |
| Parameter | Plot |
|---|---|
| CZT HV Monitor |  |
| D_VDD |  |
| Temperature 1 | 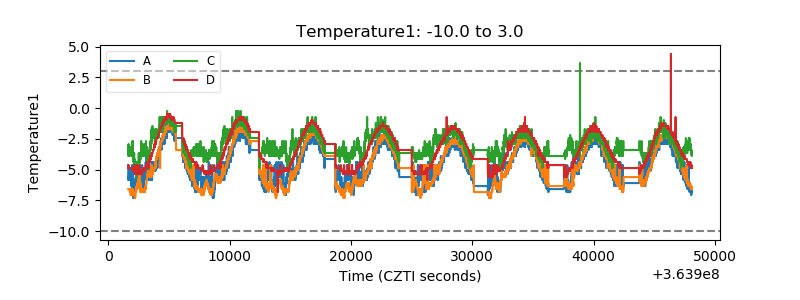 |
| Veto HV Monitor |  |
| Veto LLD |  |
| Alpha Counter | 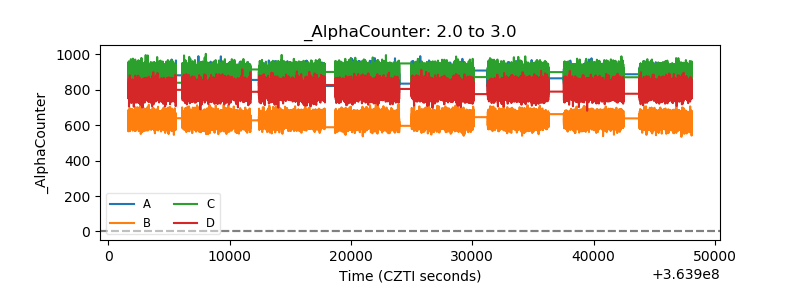 |
| _CPM_Rate |  |
| CZT Counter |  |
| +2.5 Volts monitor | 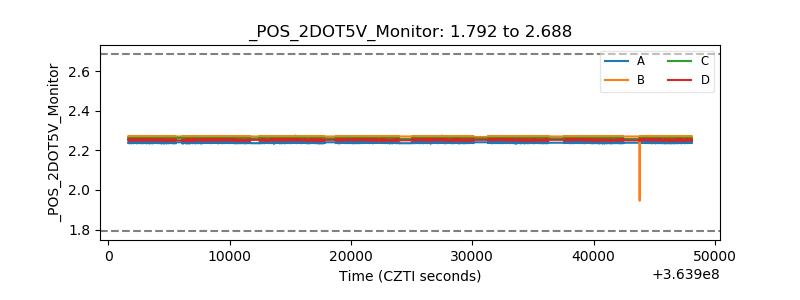 |
| +5 Volts monitor |  |
| _ROLL_ROT | 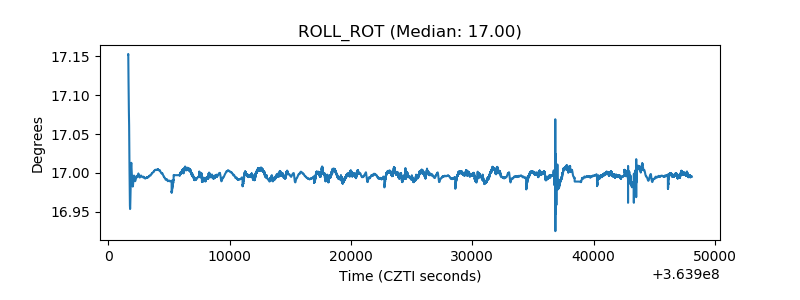 |
| _Roll_DEC |  |
| _Roll_RA | 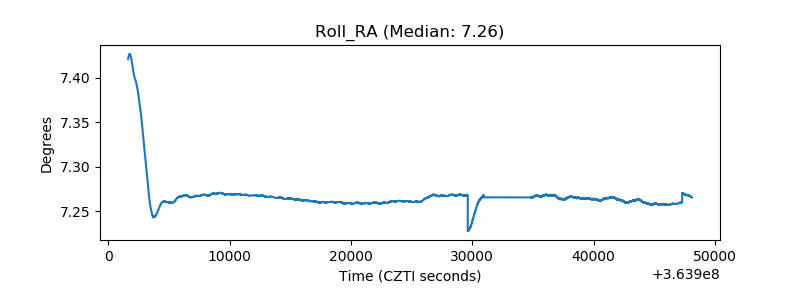 |
| Veto Counter |  |