| Param | Original file | Final file |
|---|---|---|
| Filename | modeM0/AS1A10_053T30_9000004536_31318cztM0_level2.evt | modeM0/AS1A10_053T30_9000004536_31318cztM0_level2_quad_clean.evt |
| Size (bytes) | 1,135,126,080 | 189,138,240 |
| Size | 1.1 GB | 180.4 MB |
| Events in quadrant A | 6,376,386 | 1,226,410 |
| Events in quadrant B | 11,764,087 | 1,206,283 |
| Events in quadrant C | 8,172,754 | 1,178,424 |
| Events in quadrant D | 7,133,685 | 1,164,856 |
| Mode M0 | |||
|---|---|---|---|
| Quadrant | BADHDUFLAG | Total packets | Discarded packets |
| A | 0 | 28077 | 2 |
| B | 0 | 44853 | 2 |
| C | 0 | 33335 | 2 |
| D | 0 | 30589 | 2 |
| Mode SS | |||
|---|---|---|---|
| Quadrant | BADHDUFLAG | Total packets | Discarded packets |
| A | 0 | 280 | 0 |
| B | 0 | 280 | 0 |
| C | 0 | 280 | 0 |
| D | 0 | 280 | 0 |
| Mode M9 | |||
|---|---|---|---|
| Quadrant | BADHDUFLAG | Total packets | Discarded packets |
| A | 0 | 12 | 0 |
| B | 0 | 12 | 0 |
| C | 0 | 12 | 0 |
| D | 0 | 12 | 0 |
| Quadrant | Total seconds | Saturated seconds | Saturation percentage |
|---|---|---|---|
| A | 13793 | 44 | 0.319002% |
| B | 13793 | 364 | 2.639020% |
| C | 13793 | 339 | 2.457768% |
| D | 13793 | 76 | 0.551004% |
Noise dominated data is calculated using 1-second bins in cleaned event files. If a bin has >2000 counts, and if more than 50% of those come from <1% of pixels, then it is considered to be noise-dominated and hence unusable.
| Quadrant | # 1 sec bins | Bins with >0 counts | Bins with >2000 counts | High rate bins dominated by noise | Noise dominated (total time) | Noise dominated (detector-on time) | Marked lightcurve |
|---|---|---|---|---|---|---|---|
| A | 14998 | 13795 | 6 | 6 | 0.04% | 0.04% | 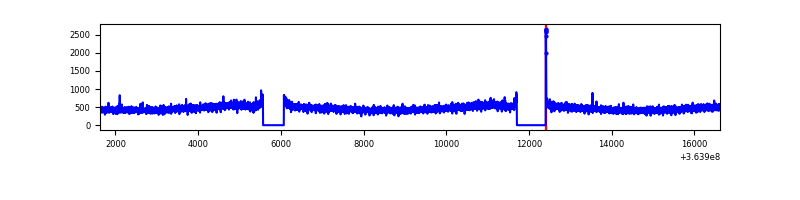 |
| B | 14998 | 13795 | 96 | 96 | 0.64% | 0.70% | 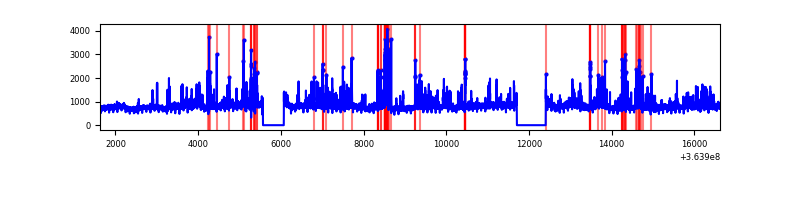 |
| C | 14998 | 13795 | 7 | 7 | 0.05% | 0.05% | 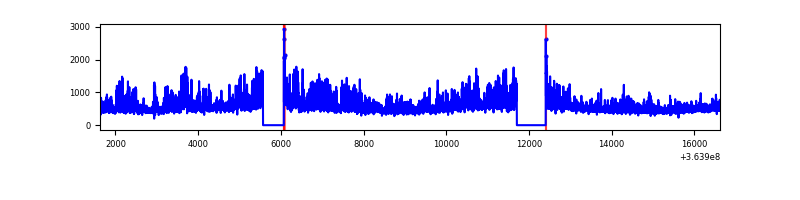 |
| D | 14998 | 13795 | 38 | 38 | 0.25% | 0.28% | 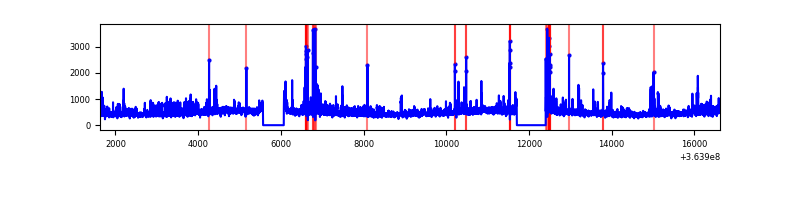 |
Top three noisy pixels from each quadrant. If the there are fewer than three noisy pixels in the level2.evt file, extra rows are filled as -1
| Pixel properties | Quadrant properties | ||||||
|---|---|---|---|---|---|---|---|
| Quadrant | DetID | PixID | Counts | Sigma | Mean | Median | Sigma |
| A | 13 | 254 | 25325 | 71.73 | 1647 | 1608 | 330.7 |
| A | 8 | 192 | 21848 | 61.21 | 1647 | 1608 | 330.7 |
| A | 3 | 137 | 17004 | 46.56 | 1647 | 1608 | 330.7 |
| B | 6 | 159 | 3918520 | 12543.33 | 1616 | 1572 | 312.3 |
| B | 4 | 80 | 1013873 | 3241.71 | 1616 | 1572 | 312.3 |
| B | 0 | 190 | 279951 | 891.46 | 1616 | 1572 | 312.3 |
| C | 3 | 233 | 1645270 | 4442.87 | 1578 | 1590 | 370.0 |
| C | 14 | 238 | 274922 | 738.82 | 1578 | 1590 | 370.0 |
| C | 2 | 114 | 31754 | 81.53 | 1578 | 1590 | 370.0 |
| D | 8 | 195 | 778515 | 2038.06 | 1603 | 1561 | 381.2 |
| D | 13 | 249 | 138417 | 358.99 | 1603 | 1561 | 381.2 |
| D | 2 | 250 | 83755 | 215.61 | 1603 | 1561 | 381.2 |
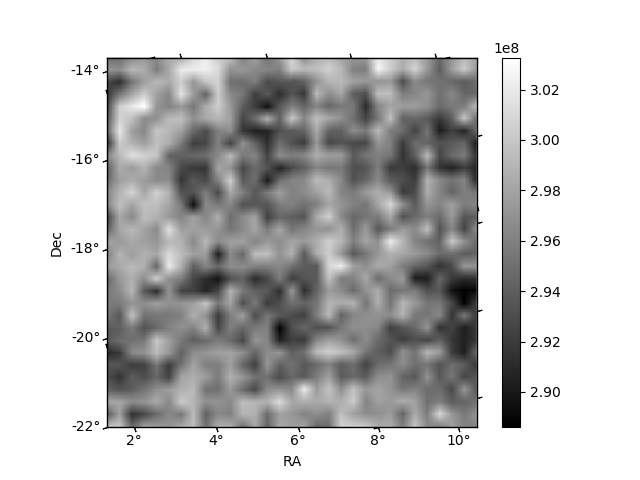
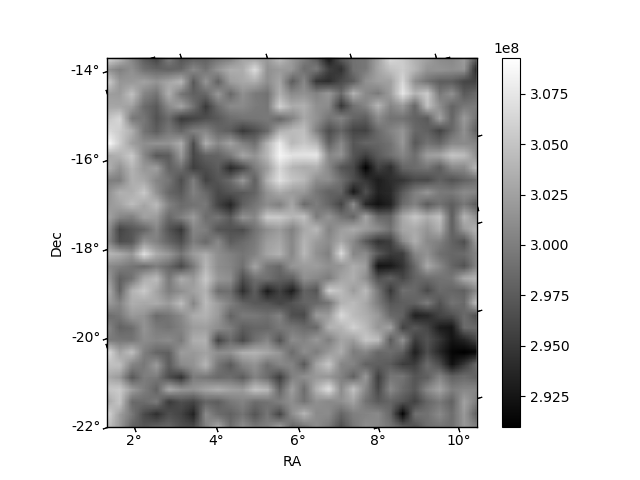
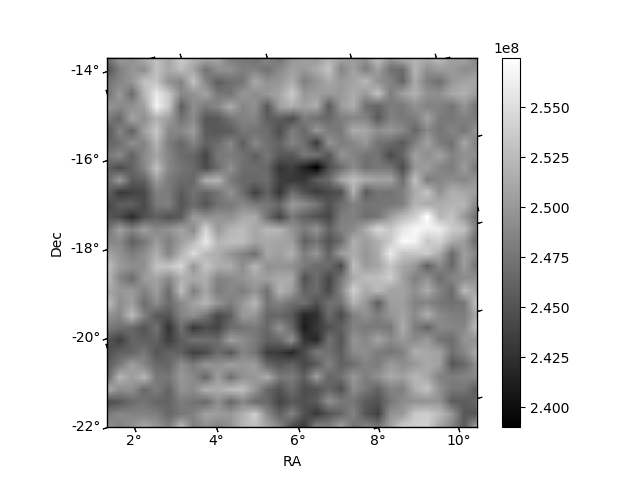
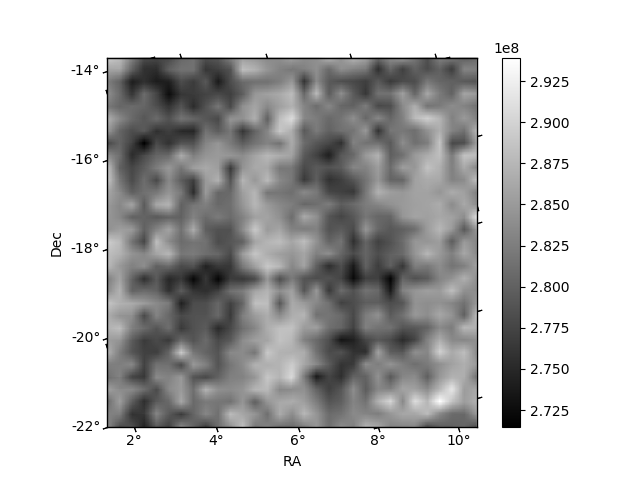
Histogram calculated using DETX and DETY for each event in the final _common_clean file
| Quadrant A | 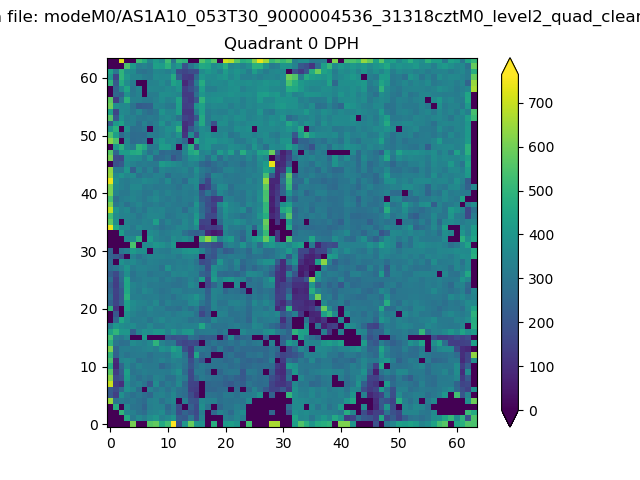 |
 |
Quadrant B |
|---|---|---|---|
| Quadrant D | 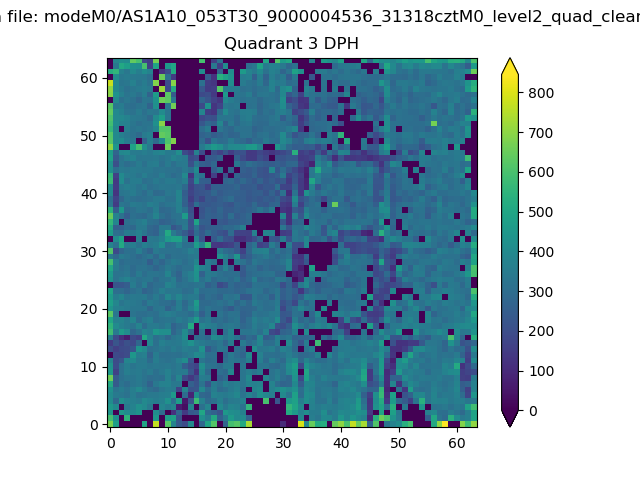 |
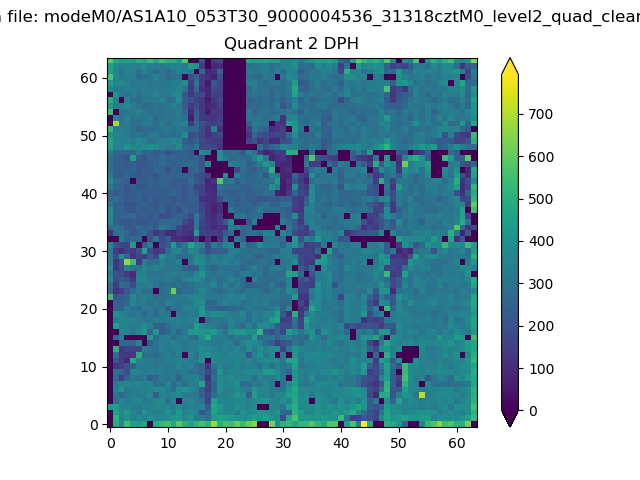 |
Quadrant C |
| Plot type | Count rate plots | Images |
|---|---|---|
| Comparison with Poisson distribution Blue bars denote a histogram of data divided into 1 sec bins. Red curve is a Poisson curve with rate = median count rate of data. |
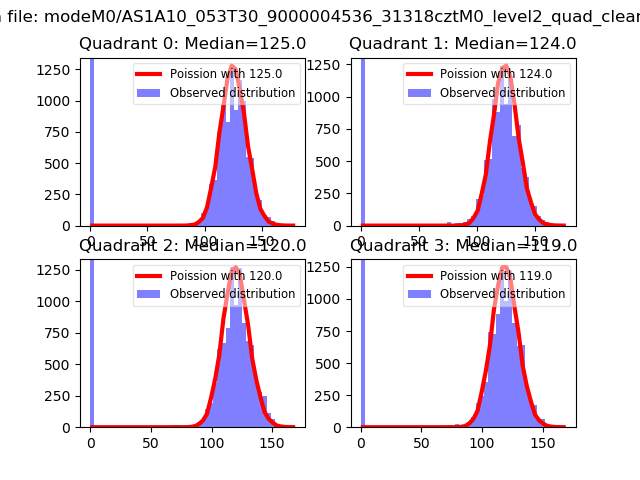 |
 |
| Quadrant-wise count rates Data is divided into 100 sec bins |
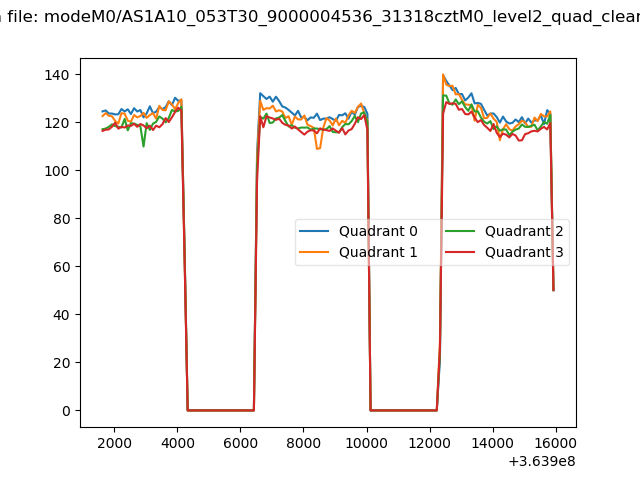 |
|
| Module-wise count rates for Quadrant A Data is divided into 100 sec bins |
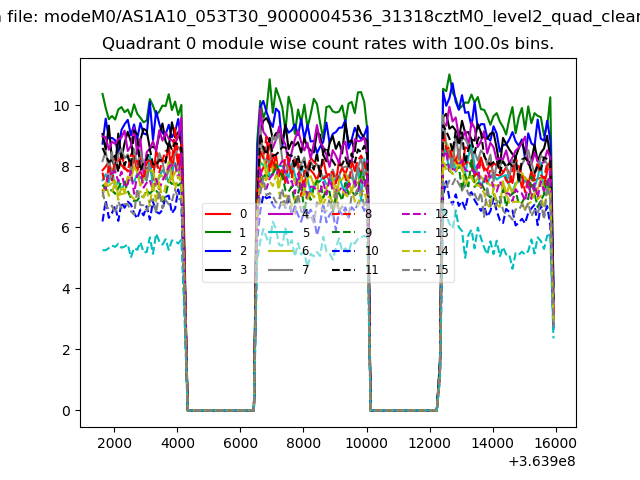 |
 |
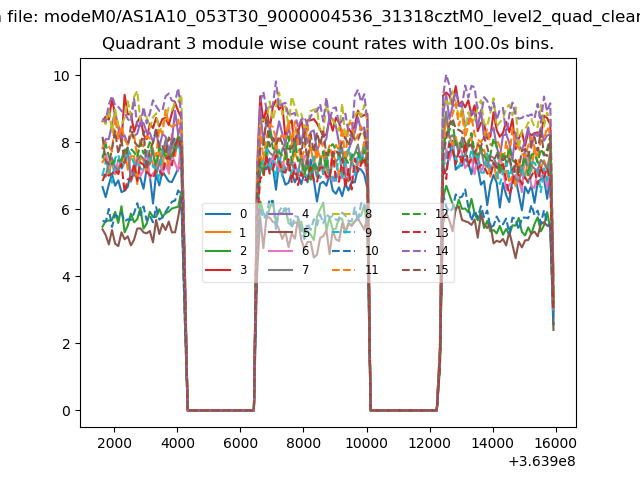
| Module-wise count rates for Quadrant B Data is divided into 100 sec bins |
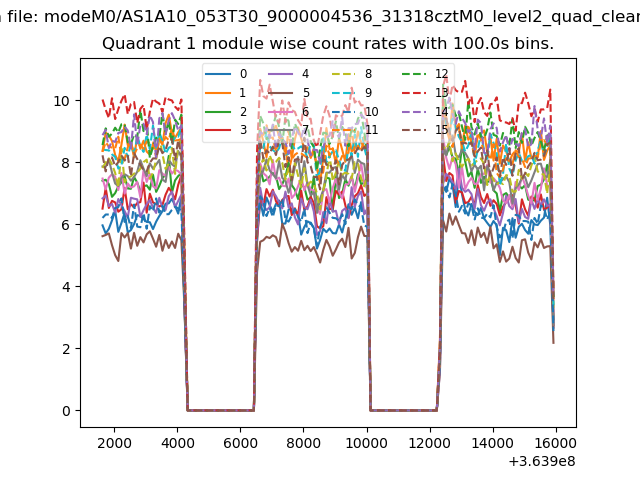 |
 |
| Module-wise count rates for Quadrant C Data is divided into 100 sec bins |
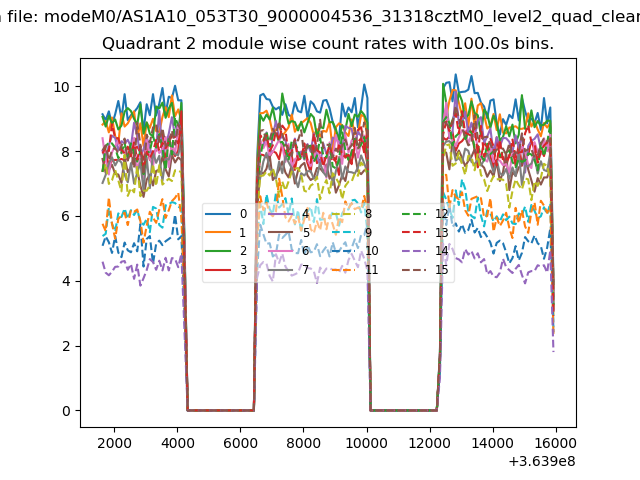 |
 |
| Module-wise count rates for Quadrant D Data is divided into 100 sec bins |
 |
 |
| Parameter | Plot |
|---|---|
| CZT HV Monitor | 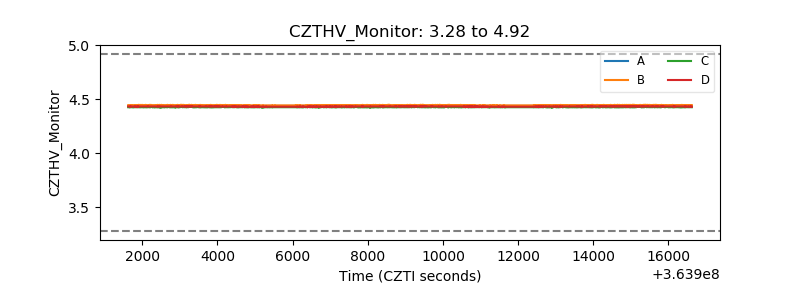 |
| D_VDD | 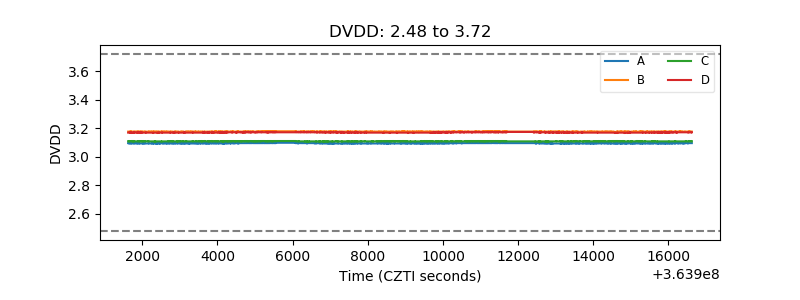 |
| Temperature 1 | 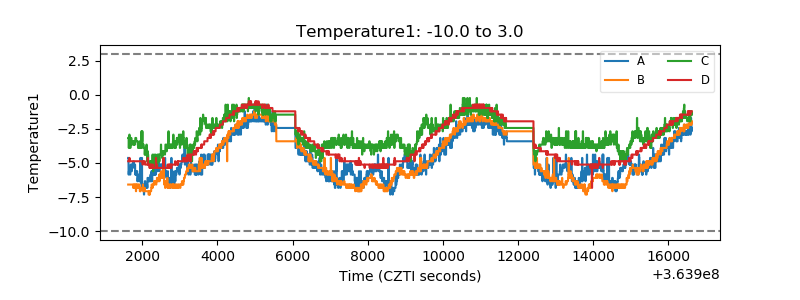 |
| Veto HV Monitor | 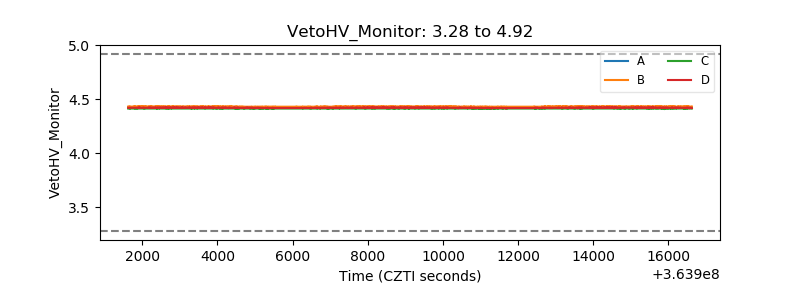 |
| Veto LLD | 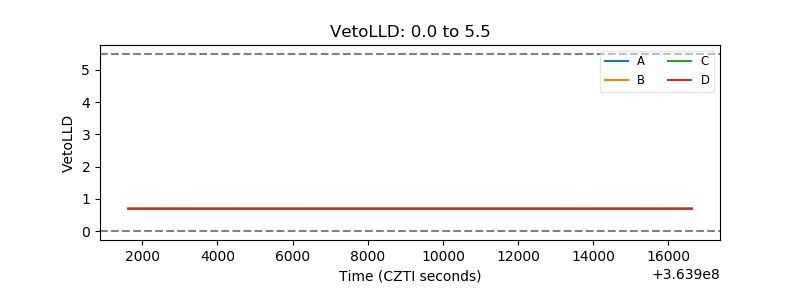 |
| Alpha Counter | 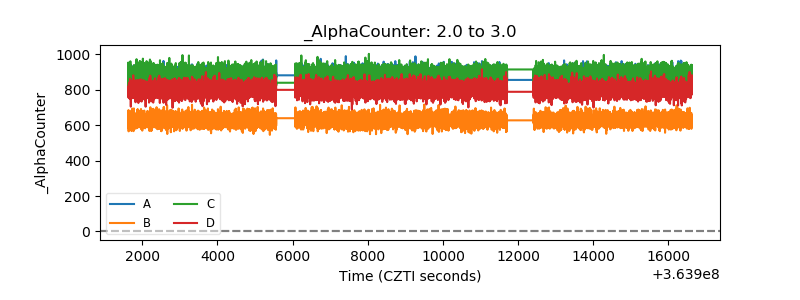 |
| _CPM_Rate | 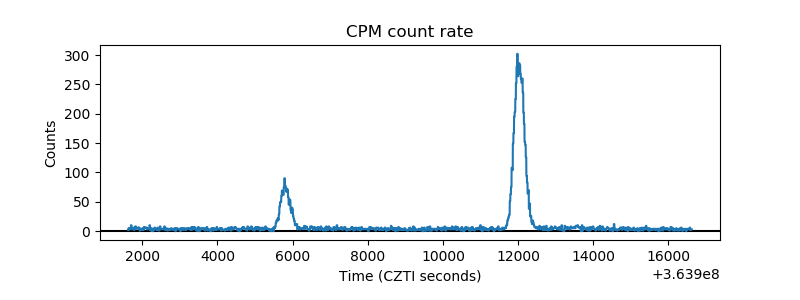 |
| CZT Counter | 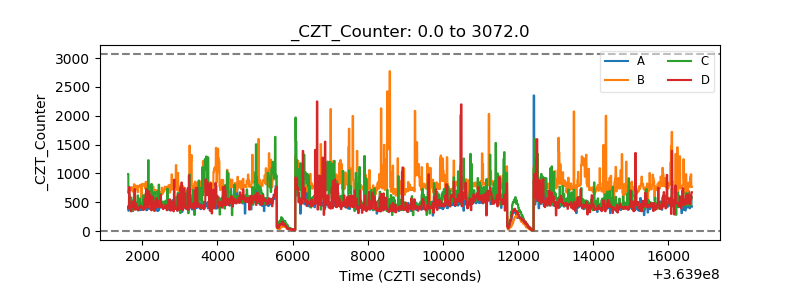 |
| +2.5 Volts monitor |  |
| +5 Volts monitor | 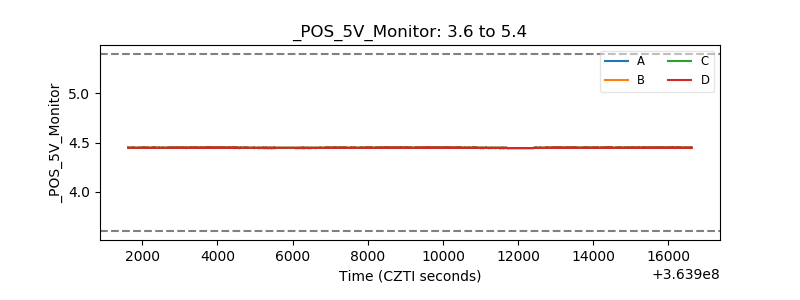 |
| _ROLL_ROT | 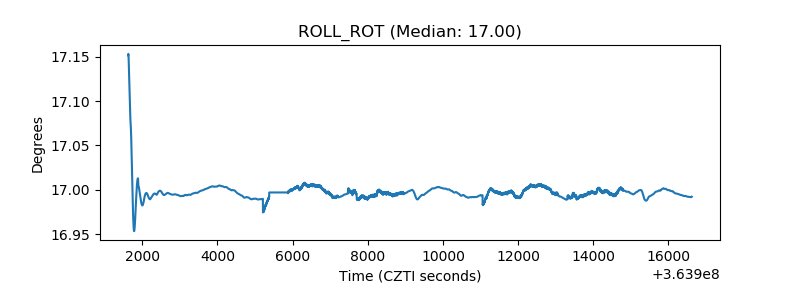 |
| _Roll_DEC | 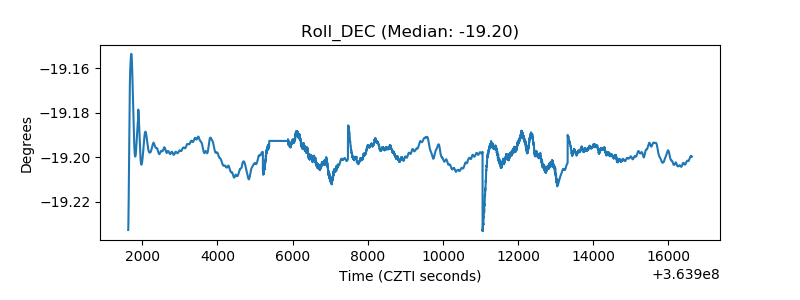 |
| _Roll_RA |  |
| Veto Counter | 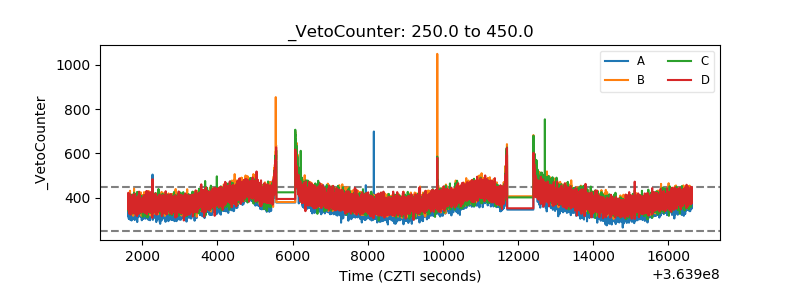 |