| Param | Original file | Final file |
|---|---|---|
| Filename | modeM0/AS1A10_053T30_9000004536_31319cztM0_level2.evt | modeM0/AS1A10_053T30_9000004536_31319cztM0_level2_quad_clean.evt |
| Size (bytes) | 783,040,320 | 103,688,640 |
| Size | 746.8 MB | 98.9 MB |
| Events in quadrant A | 4,317,435 | 644,336 |
| Events in quadrant B | 8,772,121 | 634,774 |
| Events in quadrant C | 4,864,316 | 627,173 |
| Events in quadrant D | 5,161,988 | 618,553 |
| Mode M0 | |||
|---|---|---|---|
| Quadrant | BADHDUFLAG | Total packets | Discarded packets |
| A | 0 | 18247 | 2 |
| B | 0 | 32198 | 4 |
| C | 0 | 19981 | 2 |
| D | 0 | 21086 | 2 |
| Mode SS | |||
|---|---|---|---|
| Quadrant | BADHDUFLAG | Total packets | Discarded packets |
| A | 0 | 182 | 0 |
| B | 0 | 182 | 0 |
| C | 0 | 182 | 0 |
| D | 0 | 182 | 0 |
| Mode M9 | |||
|---|---|---|---|
| Quadrant | BADHDUFLAG | Total packets | Discarded packets |
| A | 0 | 18 | 0 |
| B | 0 | 18 | 0 |
| C | 0 | 18 | 0 |
| D | 0 | 18 | 0 |
| Quadrant | Total seconds | Saturated seconds | Saturation percentage |
|---|---|---|---|
| A | 8859 | 36 | 0.406366% |
| B | 8859 | 888 | 10.023705% |
| C | 8859 | 197 | 2.223727% |
| D | 8859 | 58 | 0.654701% |
Noise dominated data is calculated using 1-second bins in cleaned event files. If a bin has >2000 counts, and if more than 50% of those come from <1% of pixels, then it is considered to be noise-dominated and hence unusable.
| Quadrant | # 1 sec bins | Bins with >0 counts | Bins with >2000 counts | High rate bins dominated by noise | Noise dominated (total time) | Noise dominated (detector-on time) | Marked lightcurve |
|---|---|---|---|---|---|---|---|
| A | 10729 | 8861 | 5 | 5 | 0.05% | 0.06% | 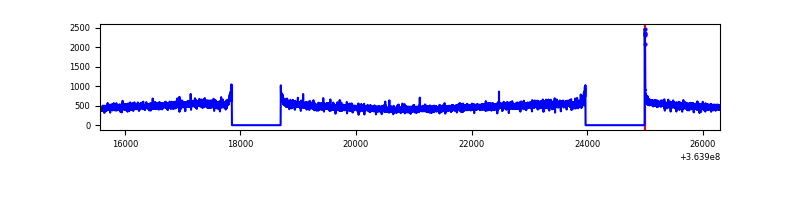 |
| B | 10729 | 8861 | 358 | 358 | 3.34% | 4.04% | 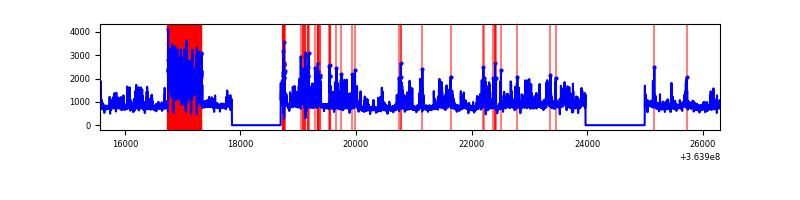 |
| C | 10729 | 8861 | 5 | 5 | 0.05% | 0.06% | 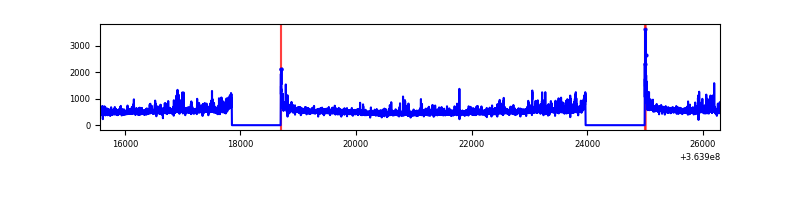 |
| D | 10729 | 8861 | 14 | 14 | 0.13% | 0.16% | 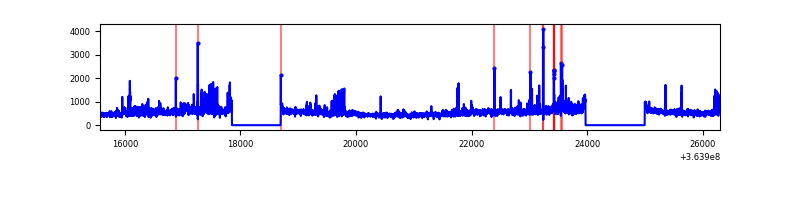 |
Top three noisy pixels from each quadrant. If the there are fewer than three noisy pixels in the level2.evt file, extra rows are filled as -1
| Pixel properties | Quadrant properties | ||||||
|---|---|---|---|---|---|---|---|
| Quadrant | DetID | PixID | Counts | Sigma | Mean | Median | Sigma |
| A | 13 | 254 | 15260 | 63.53 | 1115 | 1088 | 223.1 |
| A | 8 | 192 | 14599 | 60.57 | 1115 | 1088 | 223.1 |
| A | 3 | 137 | 11554 | 46.92 | 1115 | 1088 | 223.1 |
| B | 6 | 159 | 2344380 | 11348.15 | 1064 | 1036 | 206.5 |
| B | 4 | 80 | 1896448 | 9178.94 | 1064 | 1036 | 206.5 |
| B | 0 | 230 | 192329 | 926.38 | 1064 | 1036 | 206.5 |
| C | 3 | 233 | 394582 | 1566.88 | 1069 | 1076 | 251.1 |
| C | 14 | 238 | 187477 | 742.22 | 1069 | 1076 | 251.1 |
| C | 0 | 10 | 47639 | 185.41 | 1069 | 1076 | 251.1 |
| D | 8 | 195 | 770436 | 2944.81 | 1083 | 1053 | 261.3 |
| D | 12 | 79 | 163692 | 622.5 | 1083 | 1053 | 261.3 |
| D | 2 | 250 | 67101 | 252.8 | 1083 | 1053 | 261.3 |
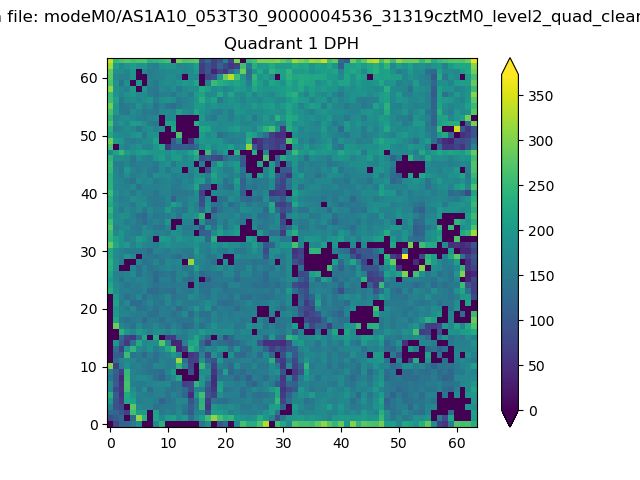
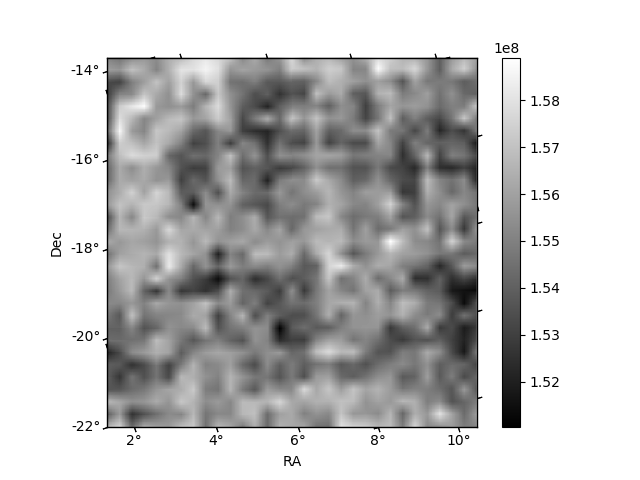
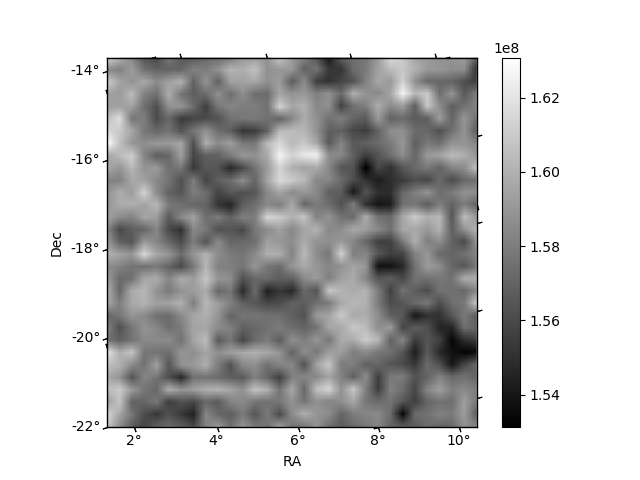
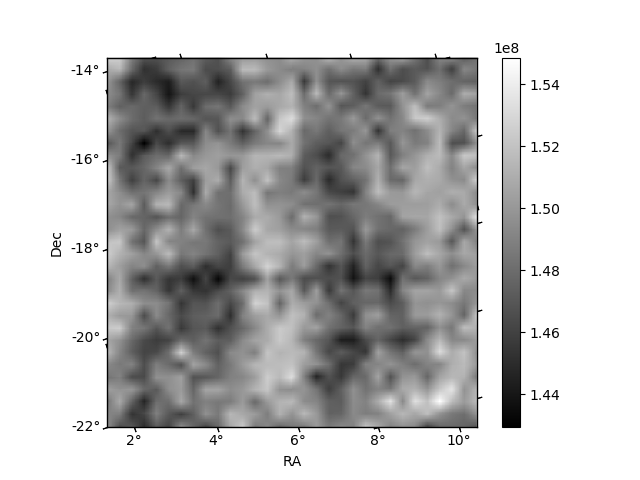
Histogram calculated using DETX and DETY for each event in the final _common_clean file
| Quadrant A |  |
 |
Quadrant B |
|---|---|---|---|
| Quadrant D | 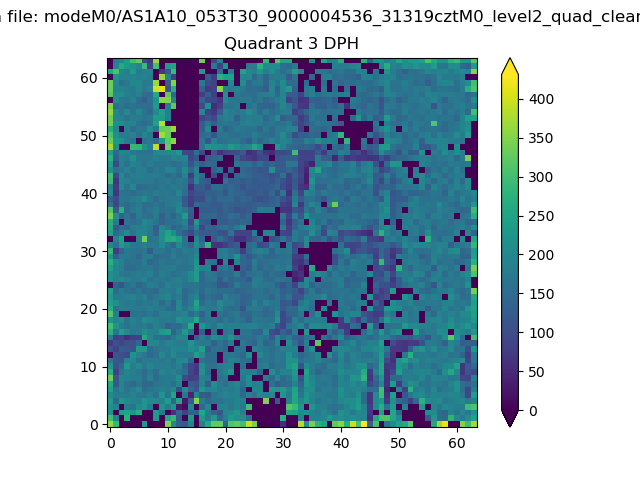 |
 |
Quadrant C |
| Plot type | Count rate plots | Images |
|---|---|---|
| Comparison with Poisson distribution Blue bars denote a histogram of data divided into 1 sec bins. Red curve is a Poisson curve with rate = median count rate of data. |
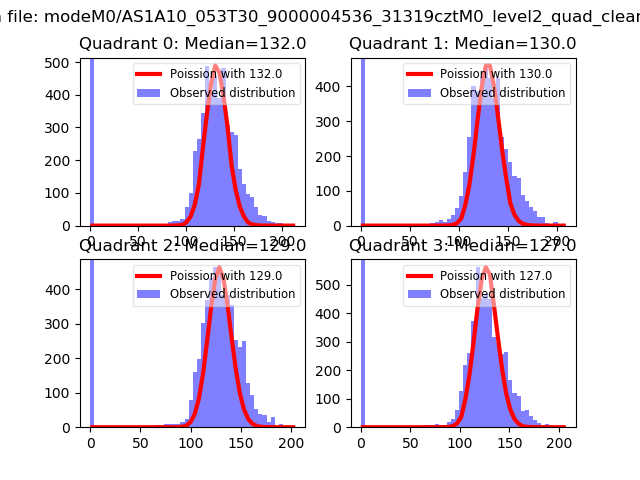 |
 |
| Quadrant-wise count rates Data is divided into 100 sec bins |
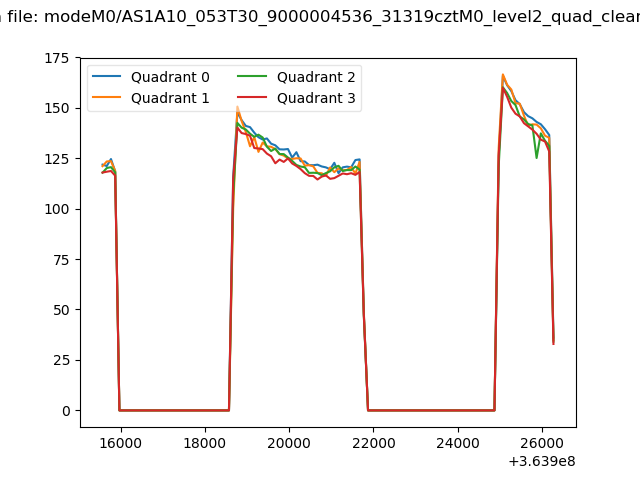 |
|
| Module-wise count rates for Quadrant A Data is divided into 100 sec bins |
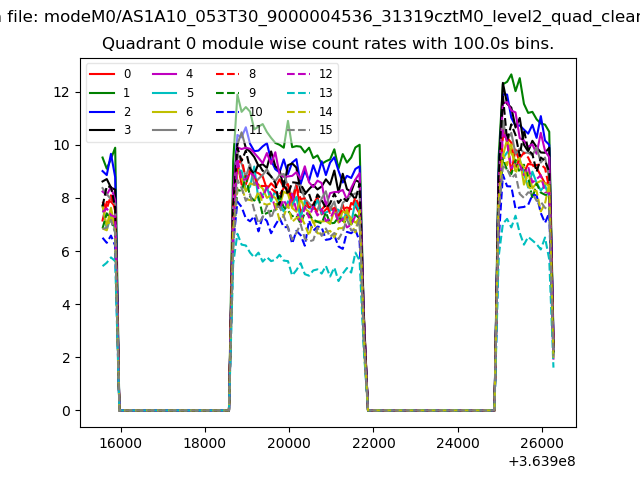 |
 |
| Module-wise count rates for Quadrant B Data is divided into 100 sec bins |
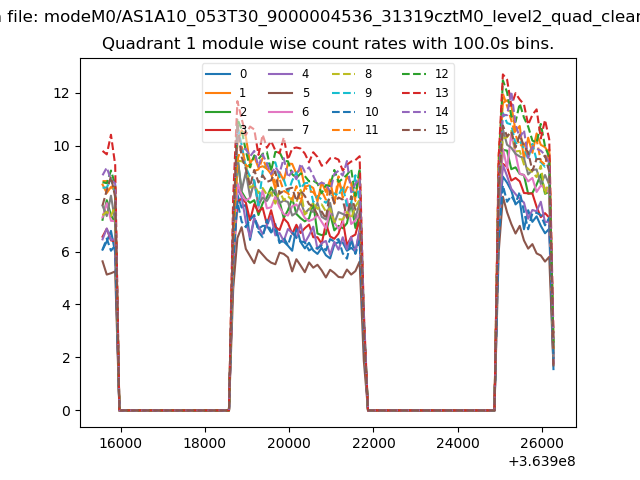 |
 |
| Module-wise count rates for Quadrant C Data is divided into 100 sec bins |
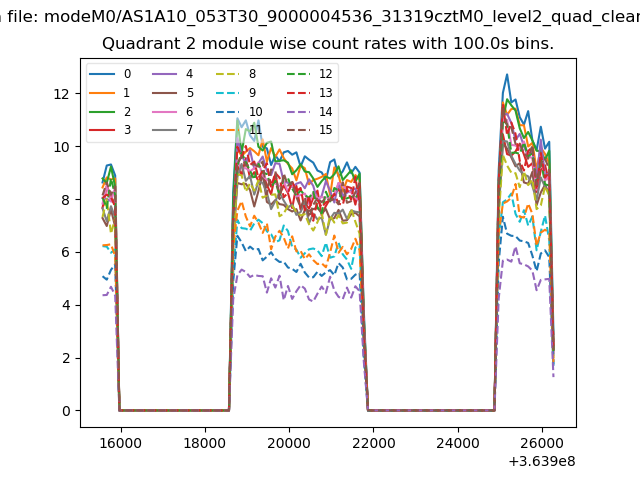 |
 |
| Module-wise count rates for Quadrant D Data is divided into 100 sec bins |
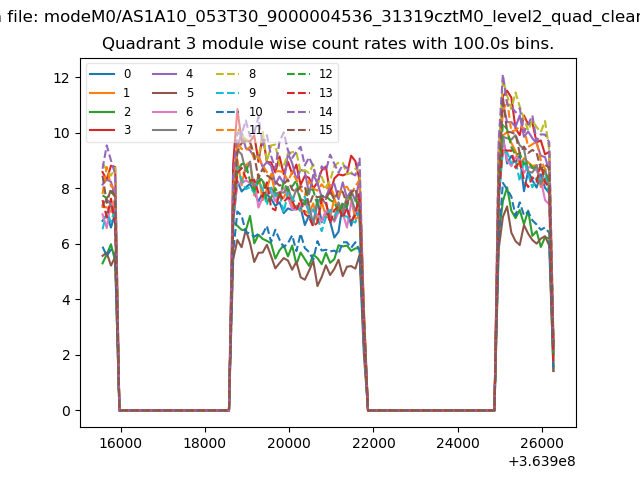 |
 |
| Parameter | Plot |
|---|---|
| CZT HV Monitor | 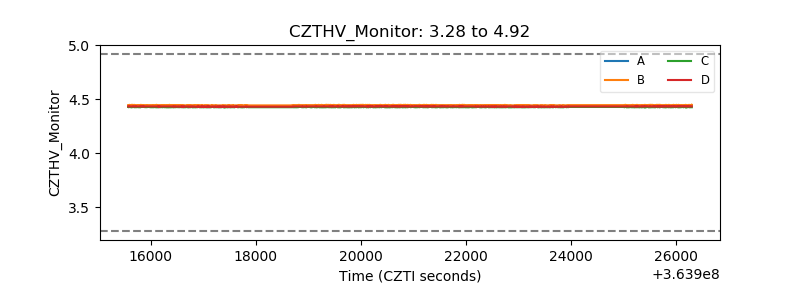 |
| D_VDD | 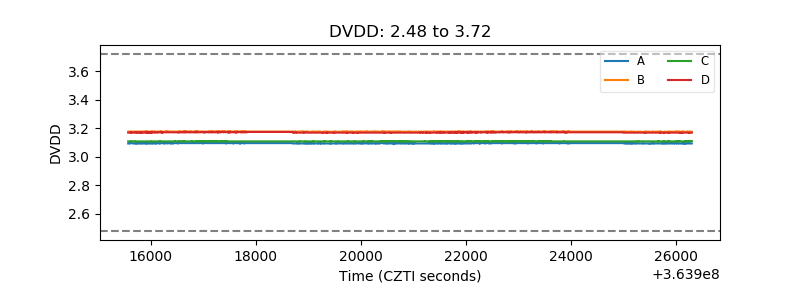 |
| Temperature 1 | 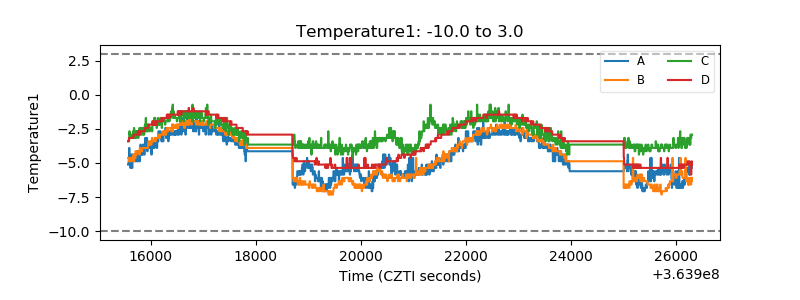 |
| Veto HV Monitor | 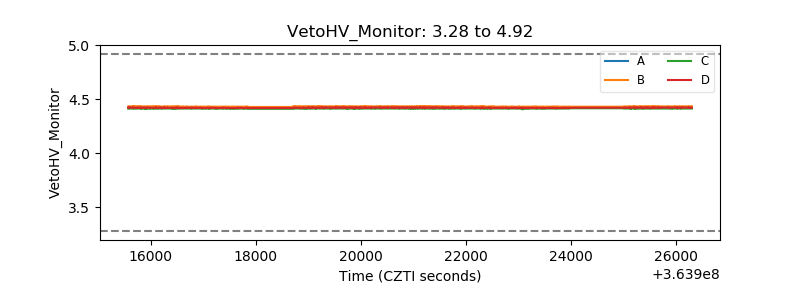 |
| Veto LLD | 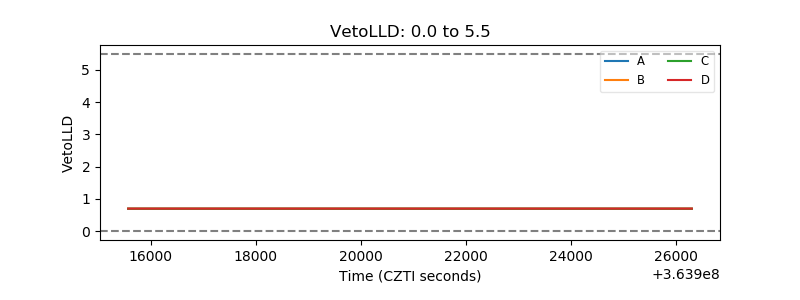 |
| Alpha Counter | 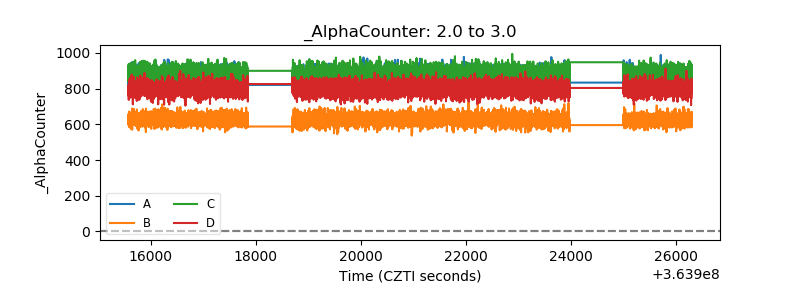 |
| _CPM_Rate | 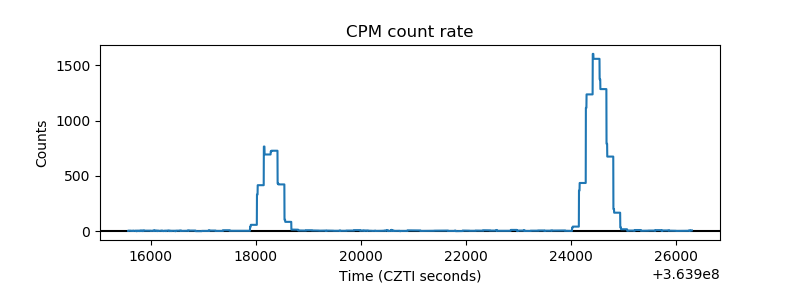 |
| CZT Counter | 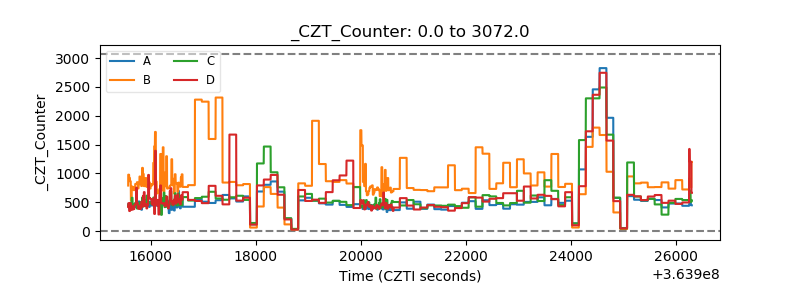 |
| +2.5 Volts monitor |  |
| +5 Volts monitor |  |
| _ROLL_ROT | 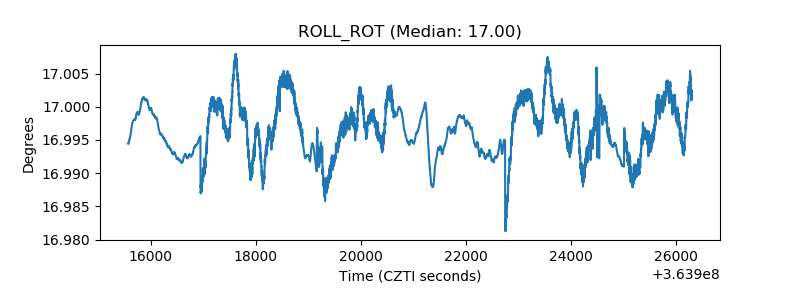 |
| _Roll_DEC | 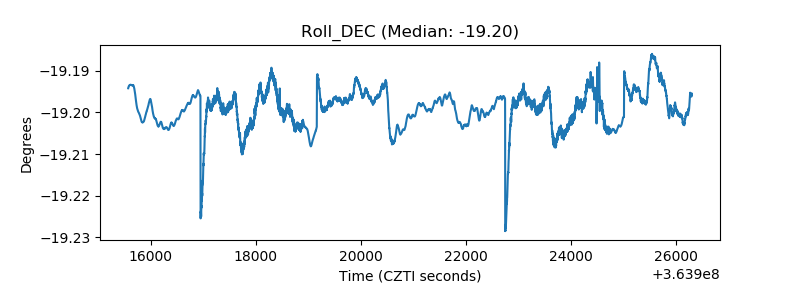 |
| _Roll_RA |  |
| Veto Counter | 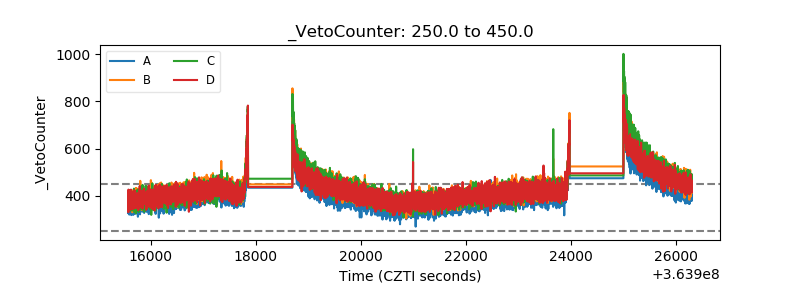 |