| Param | Original file | Final file |
|---|---|---|
| Filename | modeM0/AS1A10_053T30_9000004536_31323cztM0_level2.evt | modeM0/AS1A10_053T30_9000004536_31323cztM0_level2_quad_clean.evt |
| Size (bytes) | 1,358,570,880 | 209,738,880 |
| Size | 1.3 GB | 200.0 MB |
| Events in quadrant A | 8,163,892 | 1,362,277 |
| Events in quadrant B | 13,196,541 | 1,342,823 |
| Events in quadrant C | 9,605,584 | 1,278,603 |
| Events in quadrant D | 9,129,559 | 1,294,157 |
| Mode M0 | |||
|---|---|---|---|
| Quadrant | BADHDUFLAG | Total packets | Discarded packets |
| A | 0 | 33545 | 2 |
| B | 0 | 50054 | 2 |
| C | 0 | 38510 | 2 |
| D | 0 | 36933 | 2 |
| Mode SS | |||
|---|---|---|---|
| Quadrant | BADHDUFLAG | Total packets | Discarded packets |
| A | 0 | 316 | 0 |
| B | 0 | 316 | 0 |
| C | 0 | 316 | 0 |
| D | 0 | 316 | 0 |
| Mode M9 | |||
|---|---|---|---|
| Quadrant | BADHDUFLAG | Total packets | Discarded packets |
| A | 0 | 38 | 0 |
| B | 0 | 38 | 0 |
| C | 0 | 38 | 0 |
| D | 0 | 38 | 0 |
| Quadrant | Total seconds | Saturated seconds | Saturation percentage |
|---|---|---|---|
| A | 15579 | 102 | 0.654728% |
| B | 15580 | 409 | 2.625160% |
| C | 15580 | 619 | 3.973042% |
| D | 15580 | 89 | 0.571245% |
Noise dominated data is calculated using 1-second bins in cleaned event files. If a bin has >2000 counts, and if more than 50% of those come from <1% of pixels, then it is considered to be noise-dominated and hence unusable.
| Quadrant | # 1 sec bins | Bins with >0 counts | Bins with >2000 counts | High rate bins dominated by noise | Noise dominated (total time) | Noise dominated (detector-on time) | Marked lightcurve |
|---|---|---|---|---|---|---|---|
| A | 19299 | 15582 | 0 | 0 | 0.00% | 0.00% | 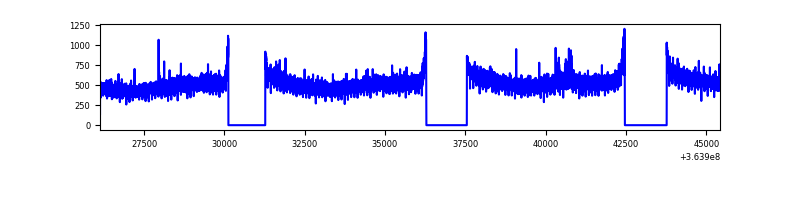 |
| B | 19300 | 15583 | 47 | 47 | 0.24% | 0.30% | 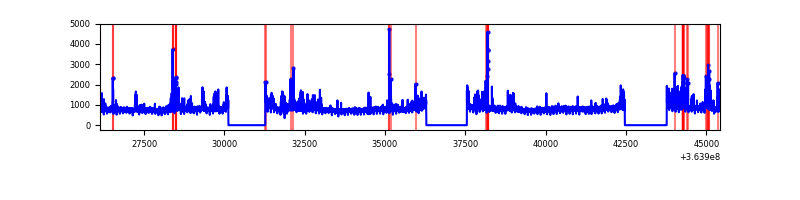 |
| C | 19300 | 15583 | 38 | 38 | 0.20% | 0.24% | 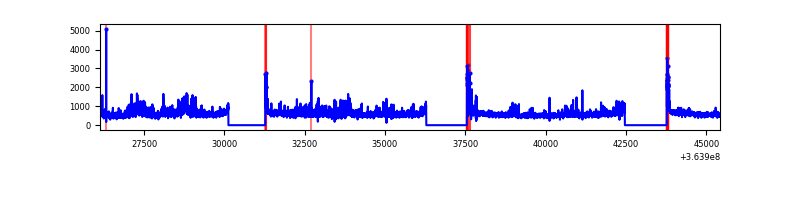 |
| D | 19300 | 15583 | 17 | 17 | 0.09% | 0.11% | 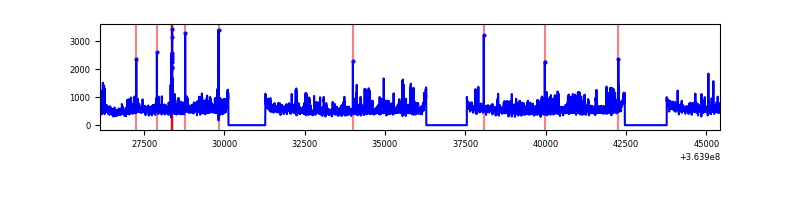 |
Top three noisy pixels from each quadrant. If the there are fewer than three noisy pixels in the level2.evt file, extra rows are filled as -1
| Pixel properties | Quadrant properties | ||||||
|---|---|---|---|---|---|---|---|
| Quadrant | DetID | PixID | Counts | Sigma | Mean | Median | Sigma |
| A | 5 | 16 | 57636 | 133.9 | 2103 | 2070 | 415.0 |
| A | 13 | 254 | 28900 | 64.65 | 2103 | 2070 | 415.0 |
| A | 3 | 137 | 19852 | 42.85 | 2103 | 2070 | 415.0 |
| B | 6 | 159 | 4132852 | 10858.77 | 2038 | 1993 | 380.4 |
| B | 4 | 80 | 534576 | 1400.0 | 2038 | 1993 | 380.4 |
| B | 0 | 190 | 241486 | 629.55 | 2038 | 1993 | 380.4 |
| C | 3 | 233 | 1134343 | 2505.44 | 1962 | 1982 | 452.0 |
| C | 14 | 238 | 423438 | 932.5 | 1962 | 1982 | 452.0 |
| C | 0 | 10 | 172714 | 377.76 | 1962 | 1982 | 452.0 |
| D | 8 | 195 | 1065325 | 2204.67 | 2039 | 1988 | 482.3 |
| D | 12 | 79 | 253644 | 521.77 | 2039 | 1988 | 482.3 |
| D | 2 | 250 | 89315 | 181.06 | 2039 | 1988 | 482.3 |
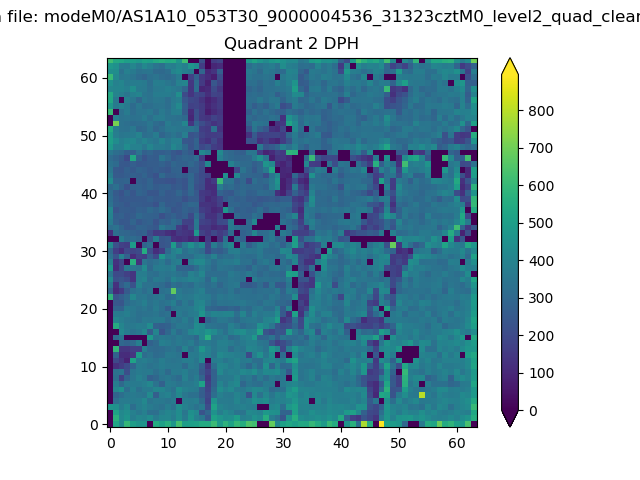
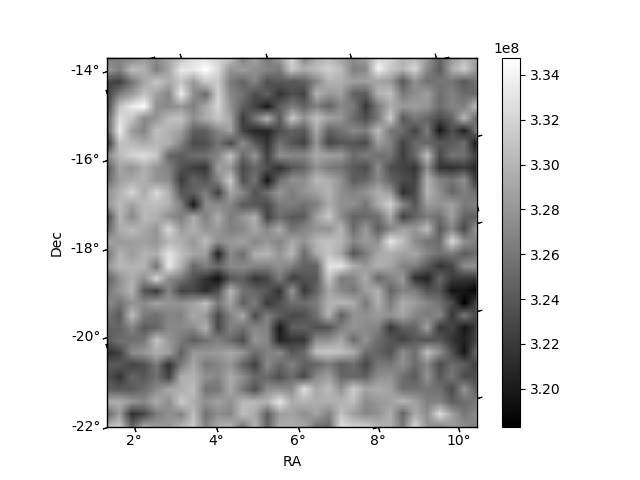
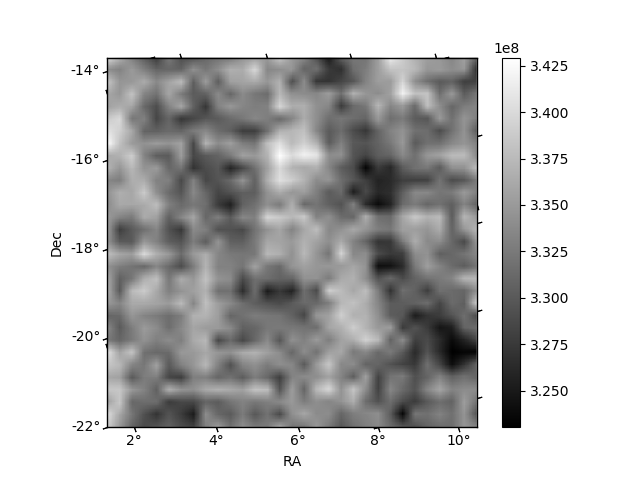
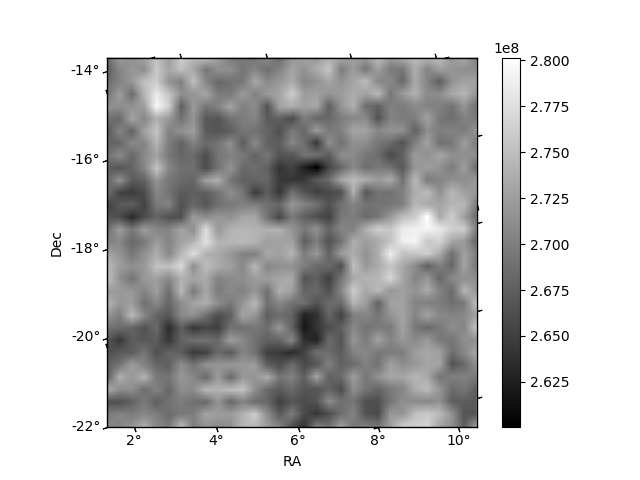
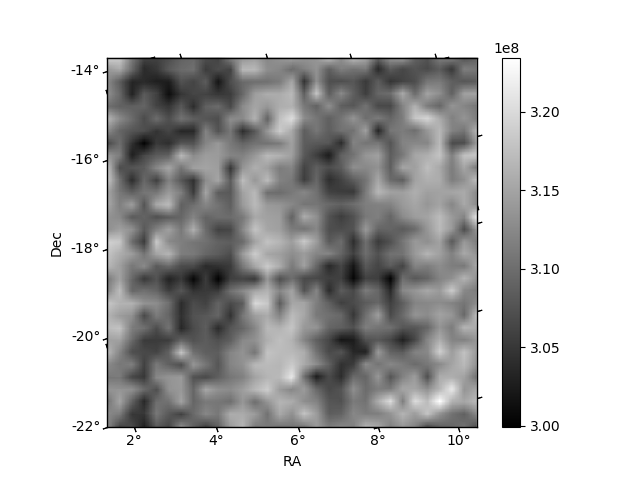
Histogram calculated using DETX and DETY for each event in the final _common_clean file
| Quadrant A | 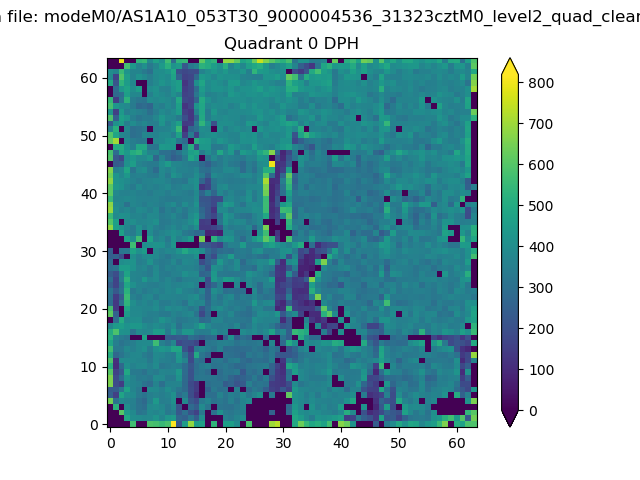 |
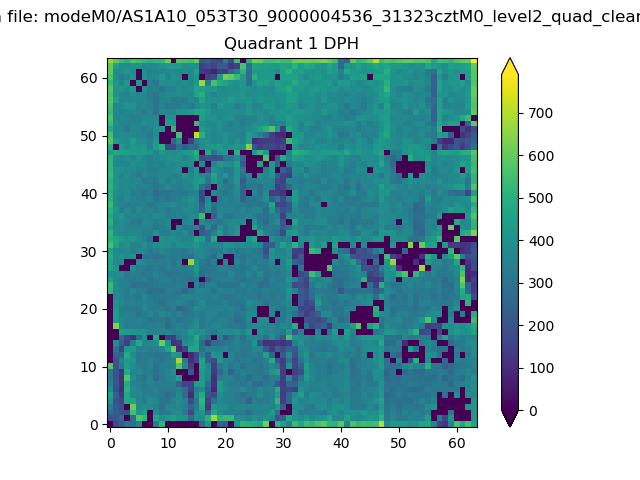 |
Quadrant B |
|---|---|---|---|
| Quadrant D | 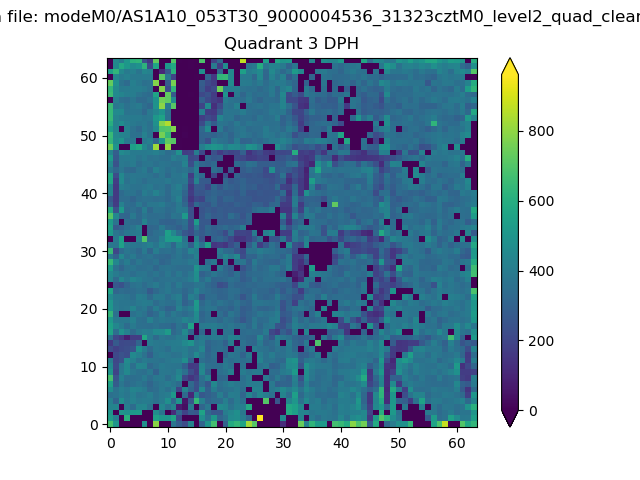 |
 |
Quadrant C |
| Plot type | Count rate plots | Images |
|---|---|---|
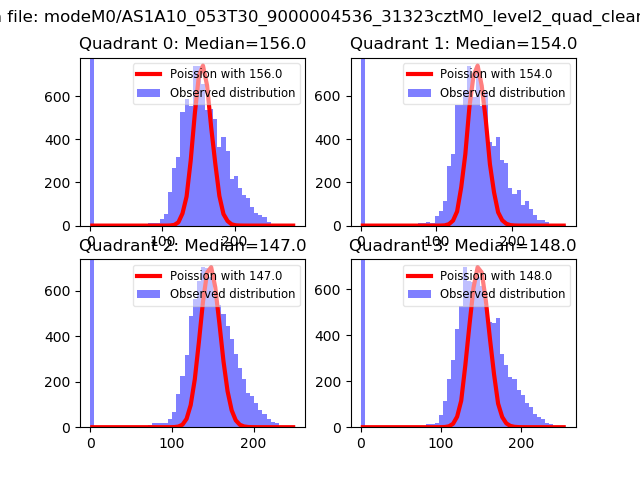
| Comparison with Poisson distribution Blue bars denote a histogram of data divided into 1 sec bins. Red curve is a Poisson curve with rate = median count rate of data. |
 |
 |
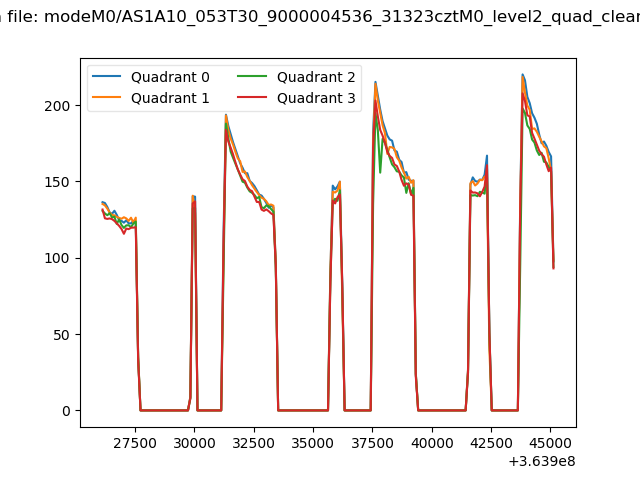
| Quadrant-wise count rates Data is divided into 100 sec bins |
 |
|
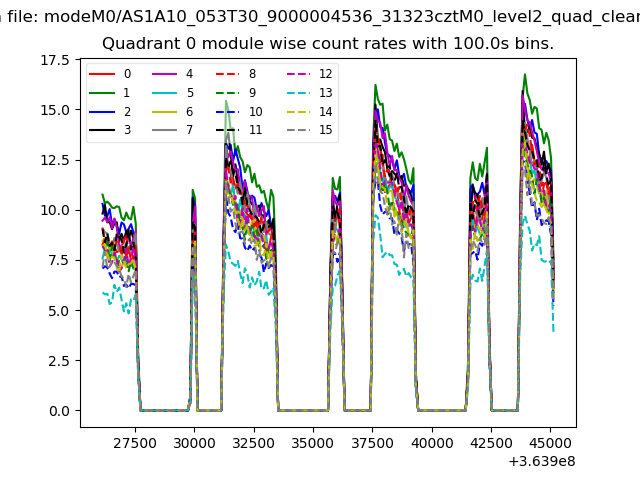
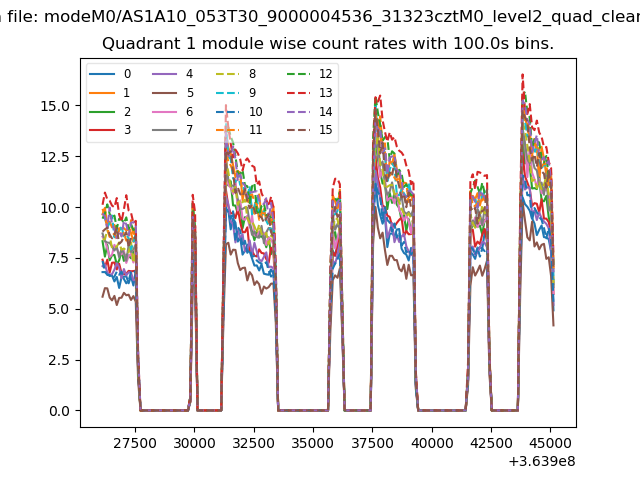
| Module-wise count rates for Quadrant A Data is divided into 100 sec bins |
 |
 |
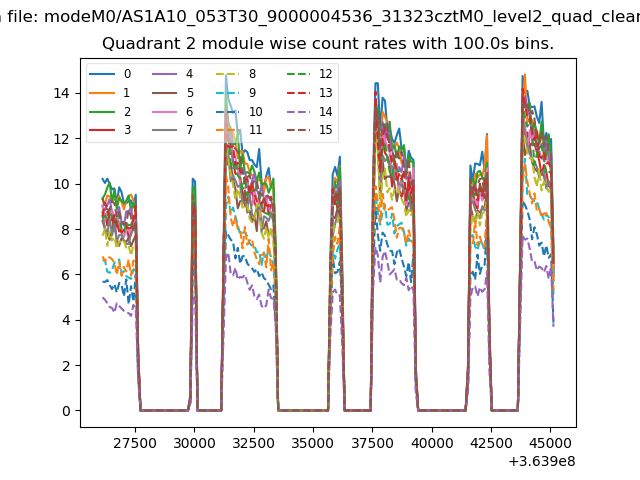
| Module-wise count rates for Quadrant B Data is divided into 100 sec bins |
 |
 |
| Module-wise count rates for Quadrant C Data is divided into 100 sec bins |
 |
 |
| Module-wise count rates for Quadrant D Data is divided into 100 sec bins |
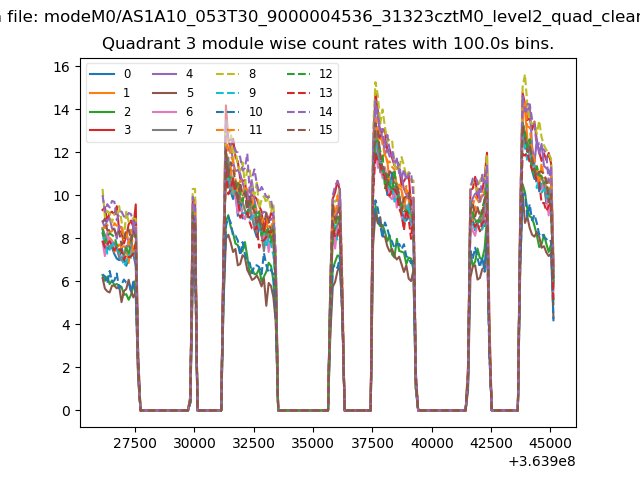 |
 |
| Parameter | Plot |
|---|---|
| CZT HV Monitor | 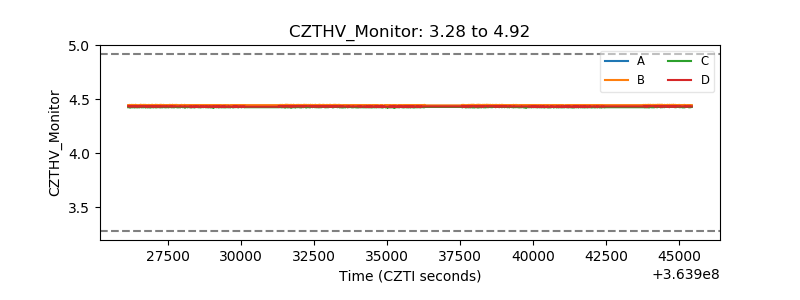 |
| D_VDD | 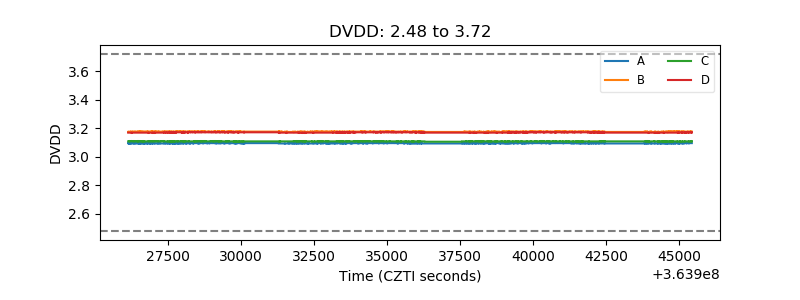 |
| Temperature 1 | 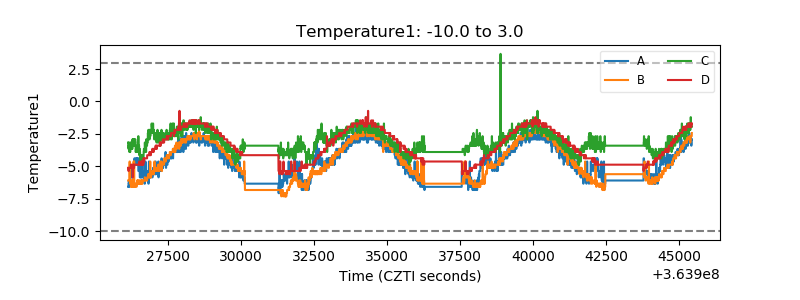 |
| Veto HV Monitor | 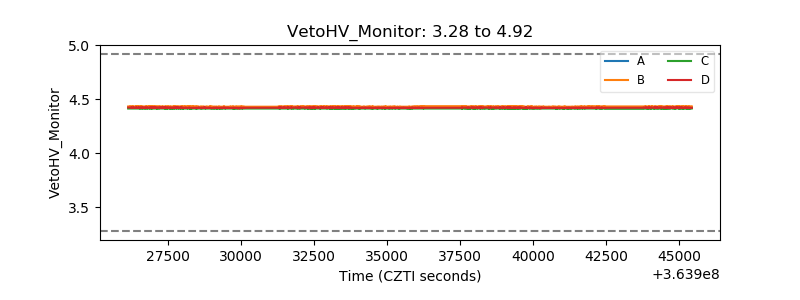 |
| Veto LLD | 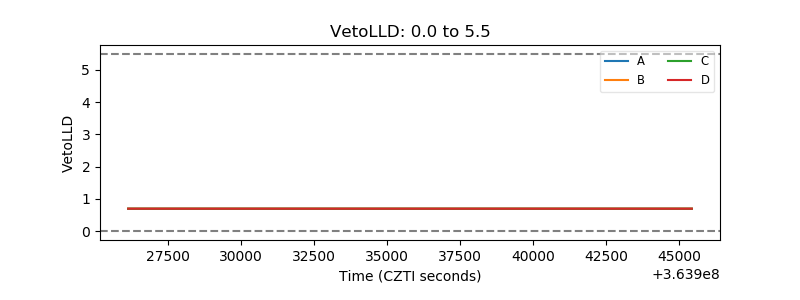 |
| Alpha Counter | 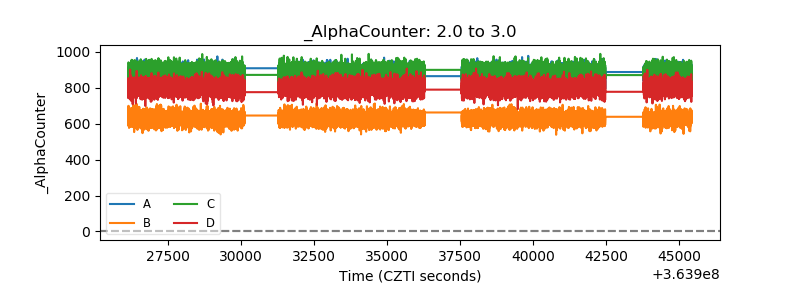 |
| _CPM_Rate | 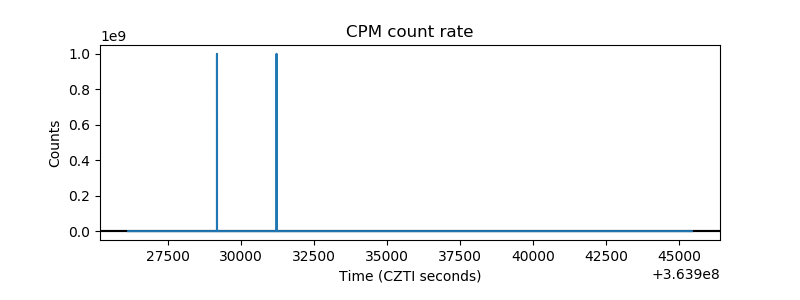 |
| CZT Counter | 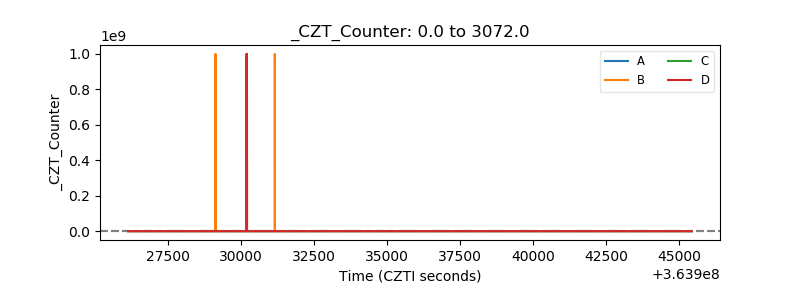 |
| +2.5 Volts monitor |  |
| +5 Volts monitor |  |
| _ROLL_ROT | 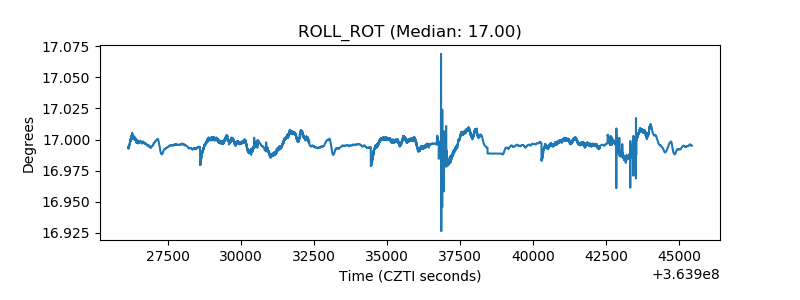 |
| _Roll_DEC | 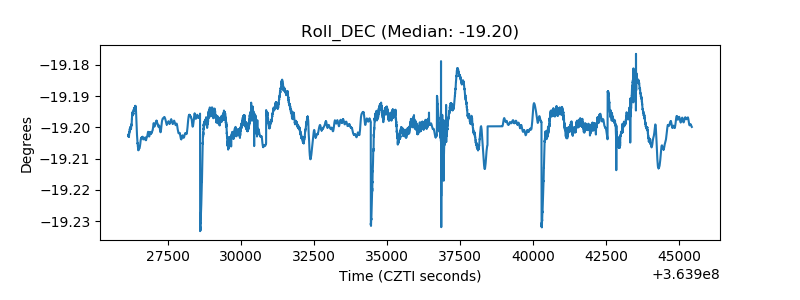 |
| _Roll_RA | 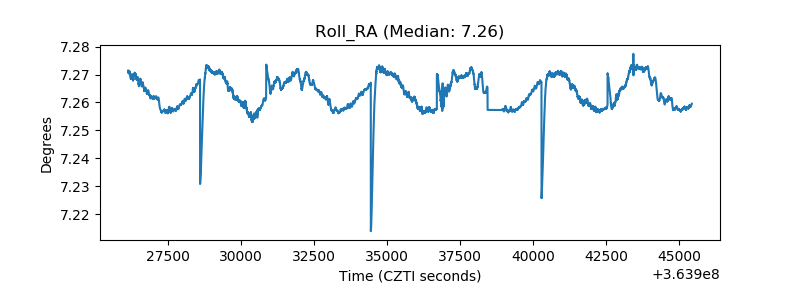 |
| Veto Counter |  |