| Param | Original file | Final file |
|---|---|---|
| Filename | modeM0/AS1A10_053T30_9000004536_31324cztM0_level2.evt | modeM0/AS1A10_053T30_9000004536_31324cztM0_level2_quad_clean.evt |
| Size (bytes) | 356,402,880 | 48,260,160 |
| Size | 339.9 MB | 46.0 MB |
| Events in quadrant A | 2,170,444 | 306,038 |
| Events in quadrant B | 3,564,552 | 298,436 |
| Events in quadrant C | 2,233,541 | 284,237 |
| Events in quadrant D | 2,550,322 | 287,124 |
| Mode M0 | |||
|---|---|---|---|
| Quadrant | BADHDUFLAG | Total packets | Discarded packets |
| A | 0 | 8606 | 0 |
| B | 0 | 13233 | 0 |
| C | 0 | 8933 | 0 |
| D | 0 | 10138 | 0 |
| Mode SS | |||
|---|---|---|---|
| Quadrant | BADHDUFLAG | Total packets | Discarded packets |
| A | 0 | 80 | 0 |
| B | 0 | 80 | 0 |
| C | 0 | 80 | 0 |
| D | 0 | 80 | 0 |
| Quadrant | Total seconds | Saturated seconds | Saturation percentage |
|---|---|---|---|
| A | 4046 | 3 | 0.074147% |
| B | 4047 | 81 | 2.001483% |
| C | 4047 | 25 | 0.617742% |
| D | 4047 | 13 | 0.321226% |
Noise dominated data is calculated using 1-second bins in cleaned event files. If a bin has >2000 counts, and if more than 50% of those come from <1% of pixels, then it is considered to be noise-dominated and hence unusable.
| Quadrant | # 1 sec bins | Bins with >0 counts | Bins with >2000 counts | High rate bins dominated by noise | Noise dominated (total time) | Noise dominated (detector-on time) | Marked lightcurve |
|---|---|---|---|---|---|---|---|
| A | 4046 | 4046 | 0 | 0 | 0.00% | 0.00% | 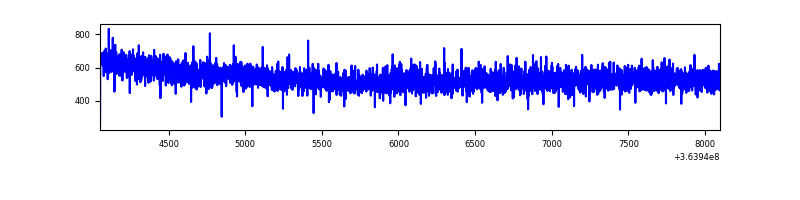 |
| B | 4047 | 4047 | 35 | 35 | 0.86% | 0.86% | 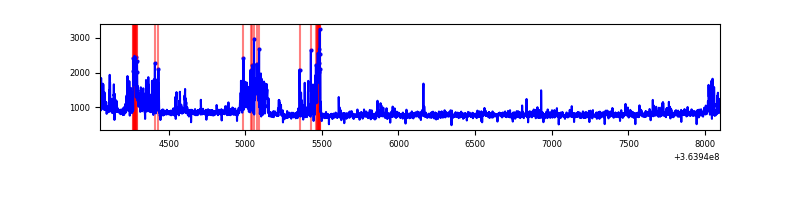 |
| C | 4047 | 4047 | 0 | 0 | 0.00% | 0.00% | 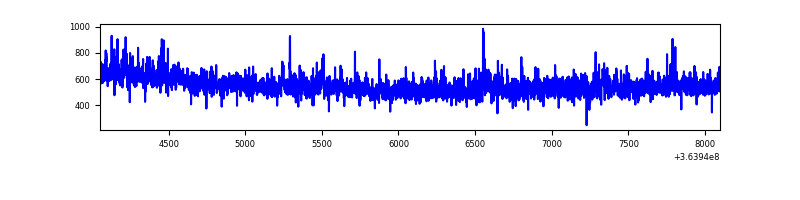 |
| D | 4047 | 4047 | 4 | 4 | 0.10% | 0.10% | 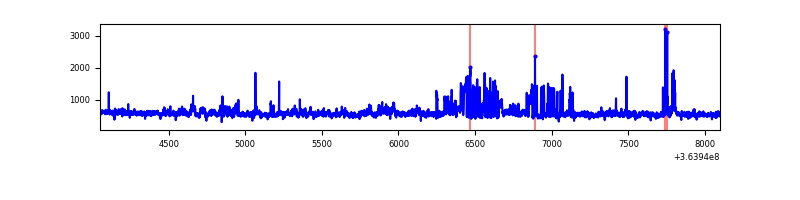 |
Top three noisy pixels from each quadrant. If the there are fewer than three noisy pixels in the level2.evt file, extra rows are filled as -1
| Pixel properties | Quadrant properties | ||||||
|---|---|---|---|---|---|---|---|
| Quadrant | DetID | PixID | Counts | Sigma | Mean | Median | Sigma |
| A | 13 | 254 | 7768 | 64.09 | 562 | 554 | 112.6 |
| A | 3 | 137 | 5104 | 40.42 | 562 | 554 | 112.6 |
| A | 0 | 226 | 4707 | 36.9 | 562 | 554 | 112.6 |
| B | 6 | 159 | 1079316 | 10532.65 | 540 | 527 | 102.4 |
| B | 4 | 80 | 164257 | 1598.56 | 540 | 527 | 102.4 |
| B | 0 | 190 | 79828 | 774.25 | 540 | 527 | 102.4 |
| C | 3 | 233 | 93878 | 770.77 | 521 | 526 | 121.1 |
| C | 14 | 238 | 90324 | 741.42 | 521 | 526 | 121.1 |
| C | 2 | 114 | 8987 | 69.86 | 521 | 526 | 121.1 |
| D | 8 | 195 | 454354 | 3547.03 | 539 | 527 | 127.9 |
| D | 2 | 250 | 45878 | 354.46 | 539 | 527 | 127.9 |
| D | 2 | 234 | 16291 | 123.21 | 539 | 527 | 127.9 |
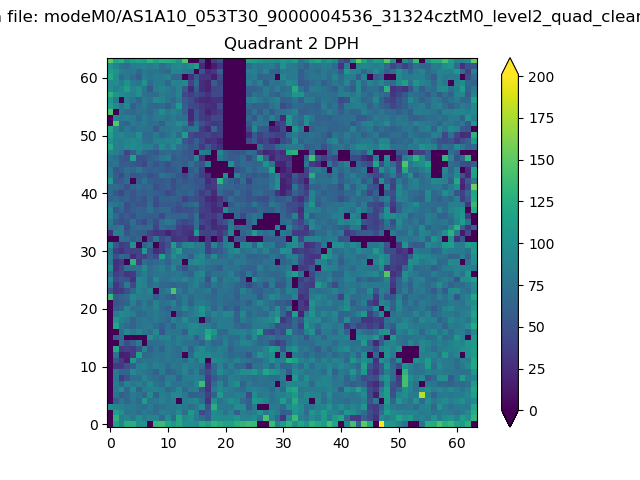
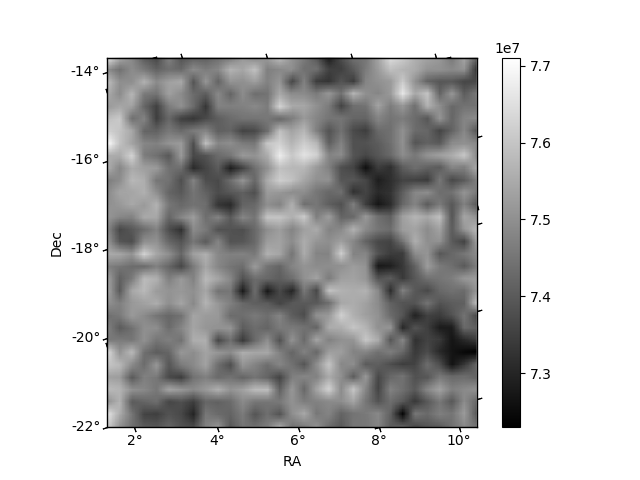
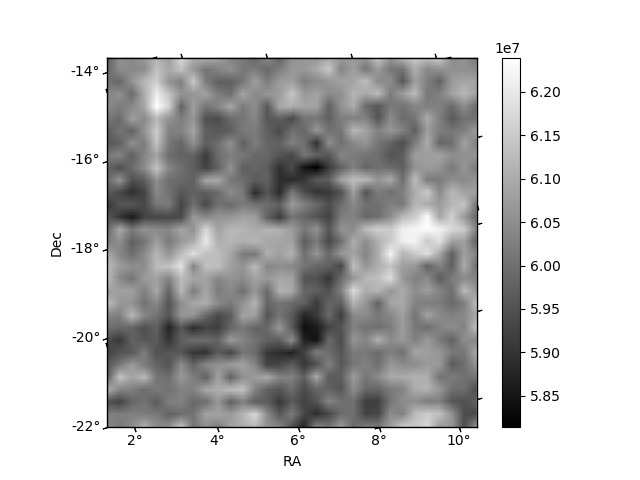
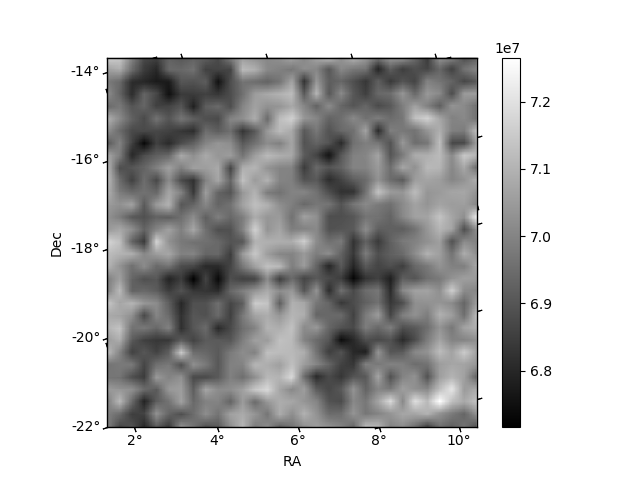
Histogram calculated using DETX and DETY for each event in the final _common_clean file
| Quadrant A | 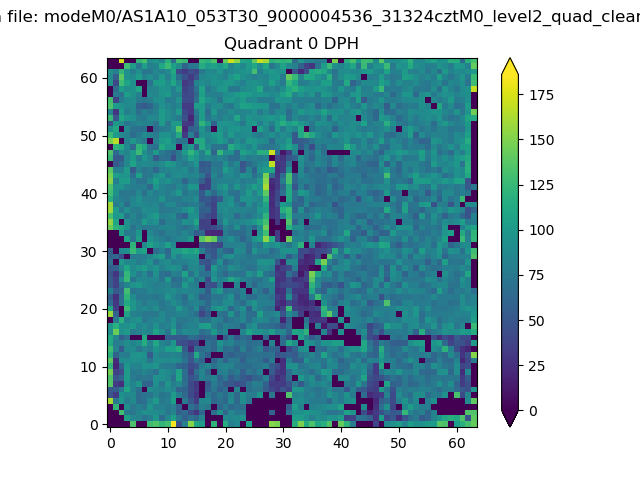 |
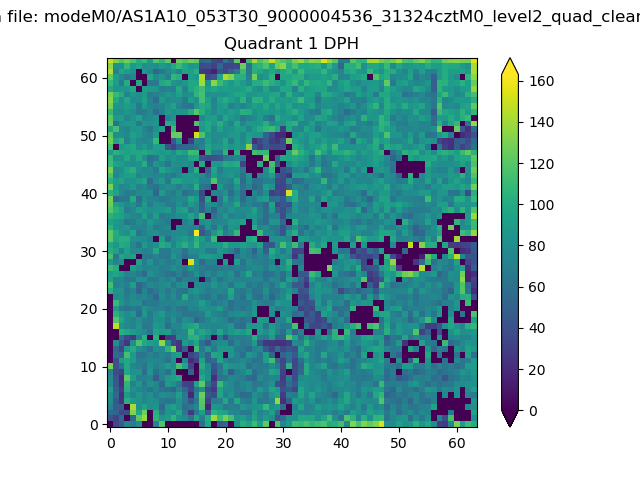 |
Quadrant B |
|---|---|---|---|
| Quadrant D | 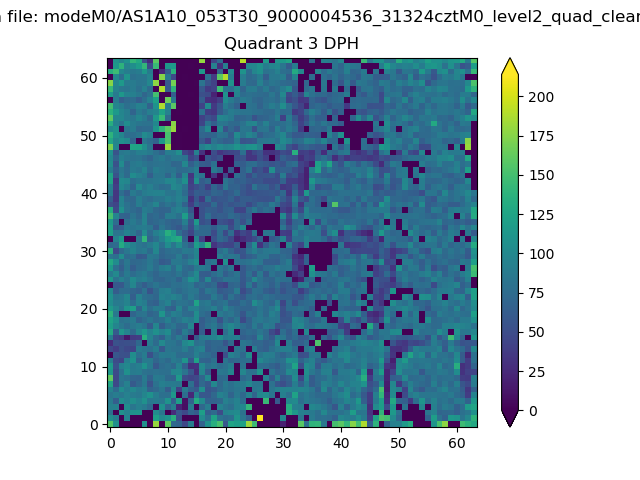 |
 |
Quadrant C |
| Plot type | Count rate plots | Images |
|---|---|---|
| Comparison with Poisson distribution Blue bars denote a histogram of data divided into 1 sec bins. Red curve is a Poisson curve with rate = median count rate of data. |
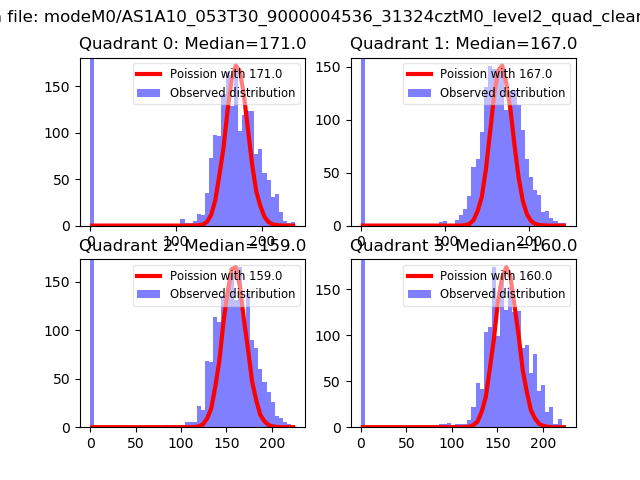 |
 |
| Quadrant-wise count rates Data is divided into 100 sec bins |
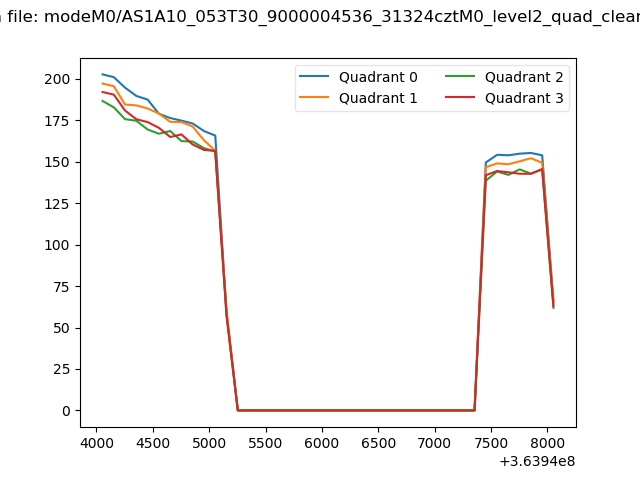 |
|
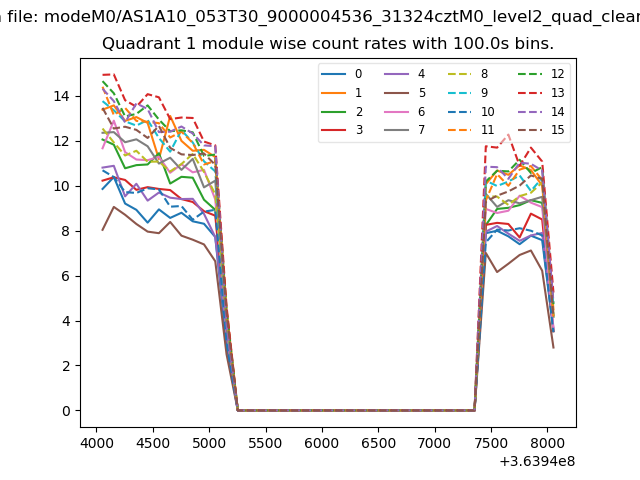
| Module-wise count rates for Quadrant A Data is divided into 100 sec bins |
 |
 |
| Module-wise count rates for Quadrant B Data is divided into 100 sec bins |
 |
 |
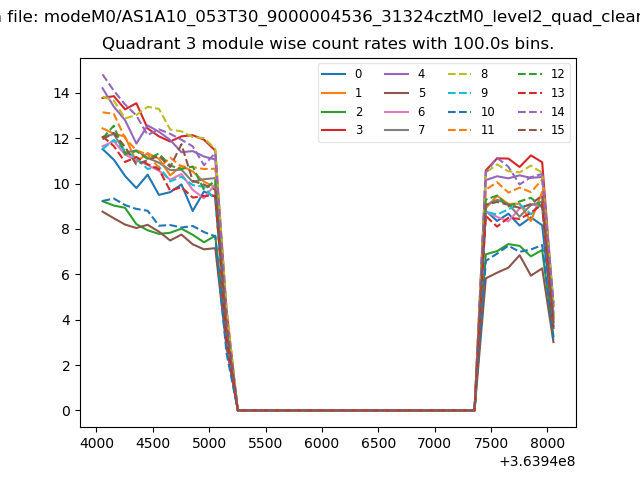
| Module-wise count rates for Quadrant C Data is divided into 100 sec bins |
 |
 |
| Module-wise count rates for Quadrant D Data is divided into 100 sec bins |
 |
 |
| Parameter | Plot |
|---|---|
| CZT HV Monitor | 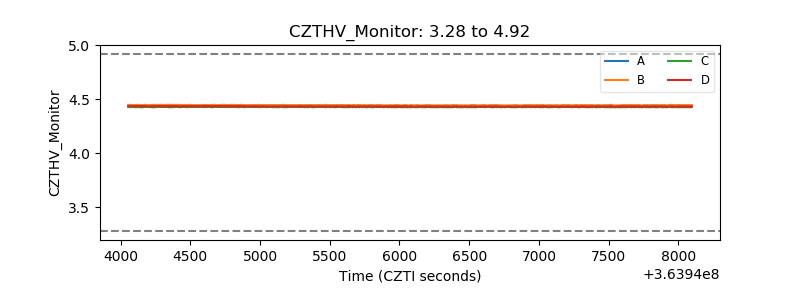 |
| D_VDD |  |
| Temperature 1 | 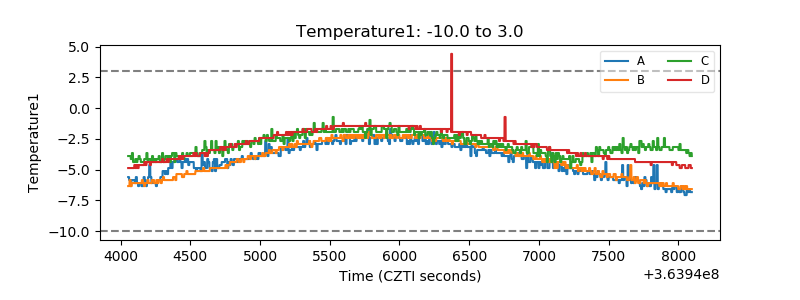 |
| Veto HV Monitor | 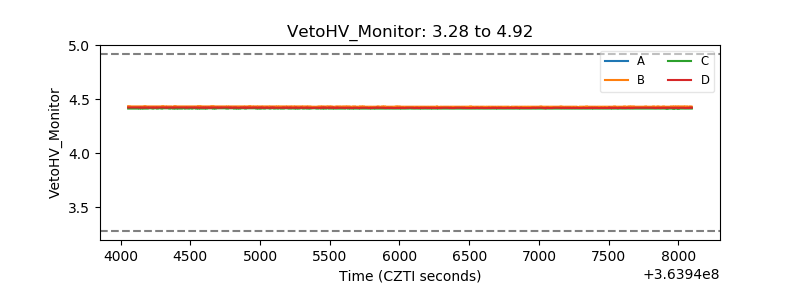 |
| Veto LLD |  |
| Alpha Counter | 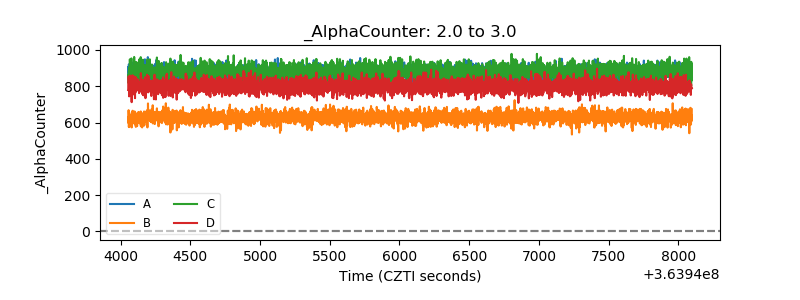 |
| _CPM_Rate | 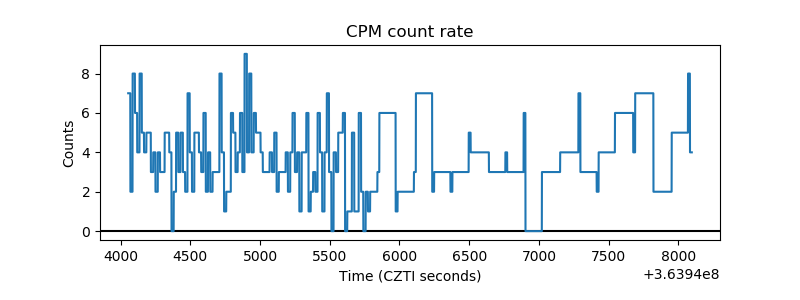 |
| CZT Counter | 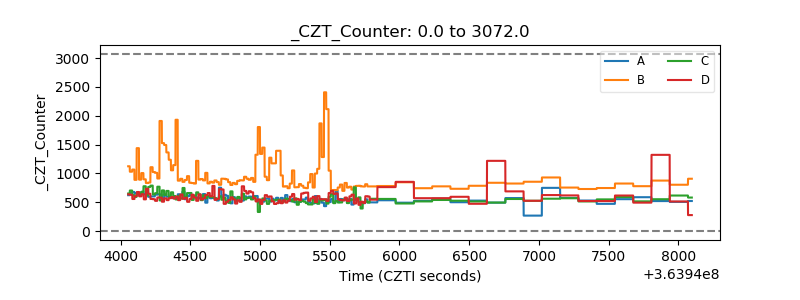 |
| +2.5 Volts monitor |  |
| +5 Volts monitor |  |
| _ROLL_ROT |  |
| _Roll_DEC | 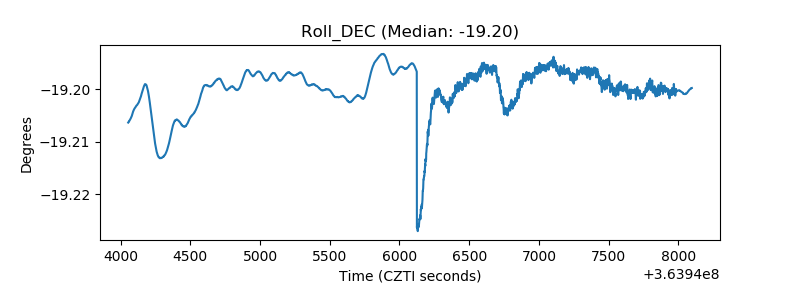 |
| _Roll_RA | 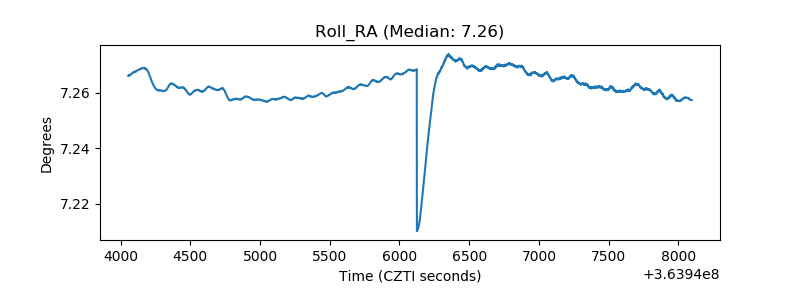 |
| Veto Counter | 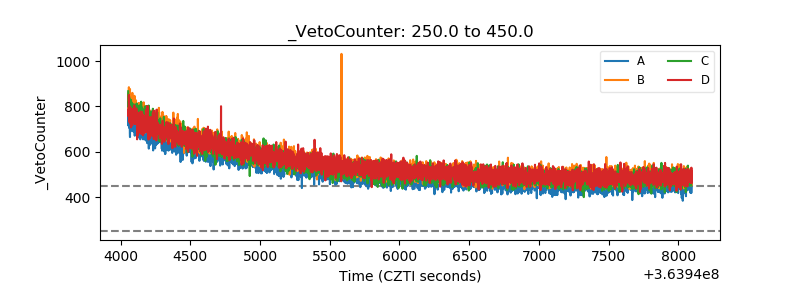 |