| Param | Original file | Final file |
|---|---|---|
| Filename | modeM0/AS1A10_053T30_9000004536_31498cztM0_level2.evt | modeM0/AS1A10_053T30_9000004536_31498cztM0_level2_quad_clean.evt |
| Size (bytes) | 187,519,680 | 27,748,800 |
| Size | 178.8 MB | 26.5 MB |
| Events in quadrant A | 1,480,569 | 175,424 |
| Events in quadrant B | 1,610,250 | 180,416 |
| Events in quadrant C | 1,217,186 | 173,528 |
| Events in quadrant D | 1,238,547 | 170,151 |
| Mode M0 | |||
|---|---|---|---|
| Quadrant | BADHDUFLAG | Total packets | Discarded packets |
| A | 0 | 6839 | 1218 |
| B | 0 | 7128 | 1129 |
| C | 0 | 5564 | 806 |
| D | 0 | 5771 | 860 |
| Mode SS | |||
|---|---|---|---|
| Quadrant | BADHDUFLAG | Total packets | Discarded packets |
| A | 0 | 46 | 8 |
| B | 0 | 48 | 10 |
| C | 0 | 49 | 9 |
| D | 0 | 46 | 8 |
| Mode M9 | |||
|---|---|---|---|
| Quadrant | BADHDUFLAG | Total packets | Discarded packets |
| A | 0 | 11 | 3 |
| B | 0 | 12 | 4 |
| C | 0 | 11 | 3 |
| D | 0 | 12 | 4 |
| Quadrant | Total seconds | Saturated seconds | Saturation percentage |
|---|---|---|---|
| A | 1919 | 89 | 4.637832% |
| B | 1919 | 35 | 1.823867% |
| C | 1923 | 102 | 5.304212% |
| D | 1933 | 22 | 1.138127% |
Noise dominated data is calculated using 1-second bins in cleaned event files. If a bin has >2000 counts, and if more than 50% of those come from <1% of pixels, then it is considered to be noise-dominated and hence unusable.
| Quadrant | # 1 sec bins | Bins with >0 counts | Bins with >2000 counts | High rate bins dominated by noise | Noise dominated (total time) | Noise dominated (detector-on time) | Marked lightcurve |
|---|---|---|---|---|---|---|---|
| A | 3593 | 1948 | 62 | 62 | 1.73% | 3.18% | 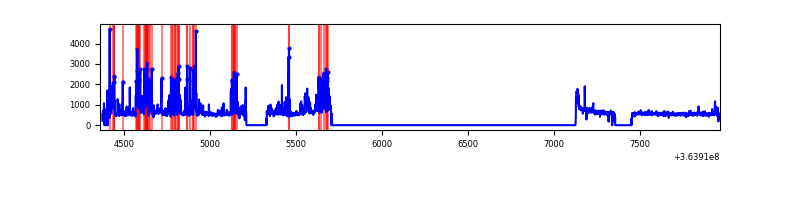 |
| B | 3607 | 1945 | 3 | 3 | 0.08% | 0.15% | 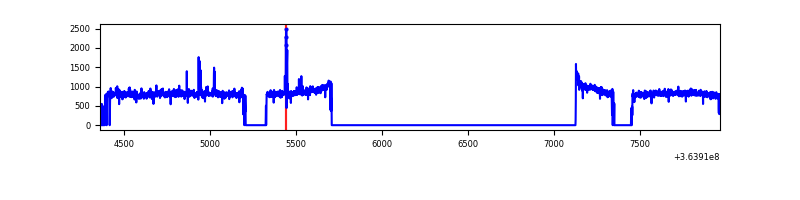 |
| C | 3609 | 1950 | 45 | 45 | 1.25% | 2.31% | 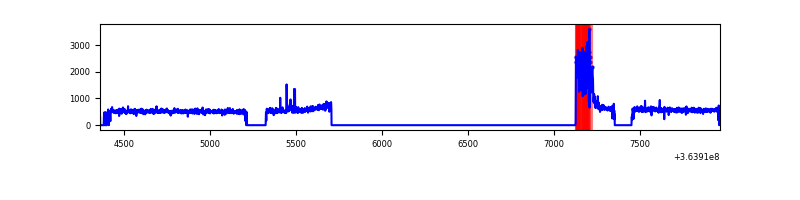 |
| D | 3606 | 1955 | 16 | 16 | 0.44% | 0.82% | 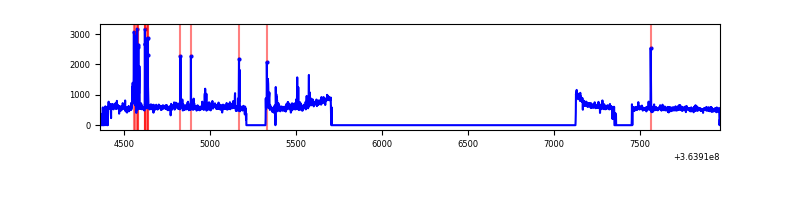 |
Top three noisy pixels from each quadrant. If the there are fewer than three noisy pixels in the level2.evt file, extra rows are filled as -1
| Pixel properties | Quadrant properties | ||||||
|---|---|---|---|---|---|---|---|
| Quadrant | DetID | PixID | Counts | Sigma | Mean | Median | Sigma |
| A | 0 | 13 | 442835 | 8010.15 | 269 | 265 | 55.3 |
| A | 13 | 254 | 3400 | 56.74 | 269 | 265 | 55.3 |
| A | 3 | 137 | 2475 | 40.0 | 269 | 265 | 55.3 |
| B | 6 | 159 | 504690 | 9598.99 | 270 | 265 | 52.5 |
| B | 4 | 80 | 18587 | 348.66 | 270 | 265 | 52.5 |
| B | 15 | 201 | 13808 | 257.72 | 270 | 265 | 52.5 |
| C | 0 | 10 | 175435 | 2887.89 | 254 | 255 | 60.7 |
| C | 14 | 238 | 42138 | 690.45 | 254 | 255 | 60.7 |
| C | 2 | 114 | 4403 | 68.38 | 254 | 255 | 60.7 |
| D | 8 | 195 | 112469 | 1735.82 | 265 | 257 | 64.6 |
| D | 12 | 233 | 76582 | 1180.68 | 265 | 257 | 64.6 |
| D | 2 | 250 | 21215 | 324.2 | 265 | 257 | 64.6 |
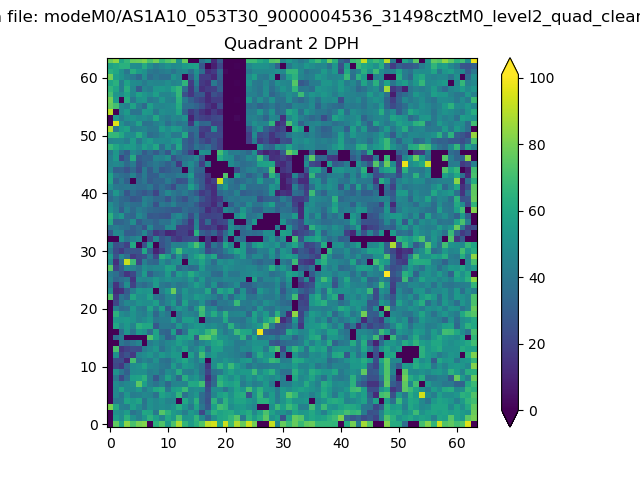
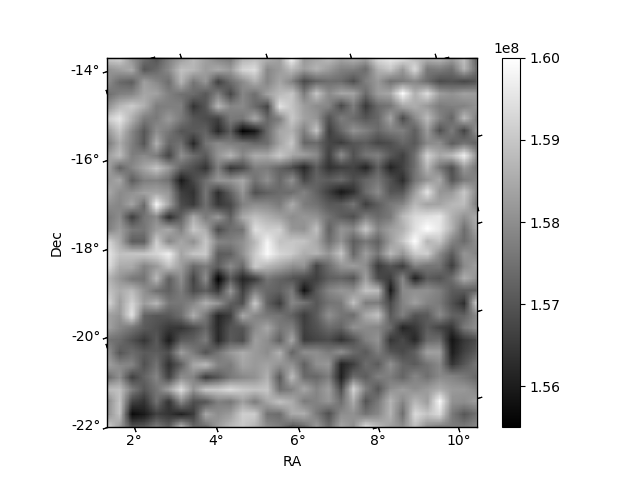
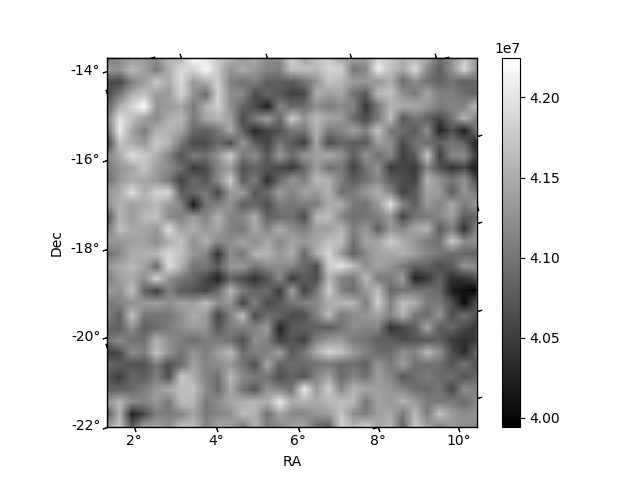
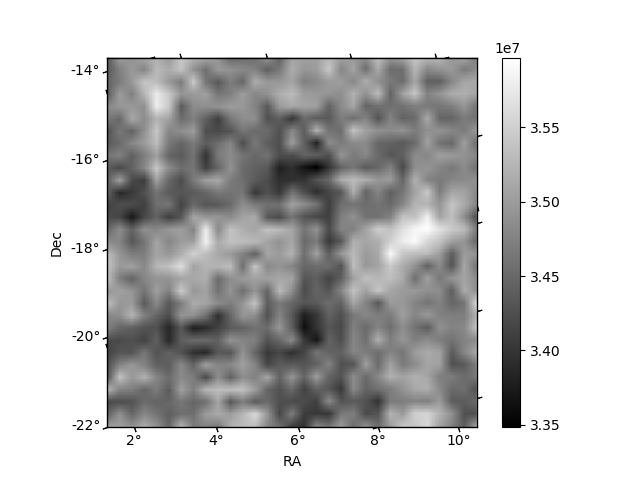
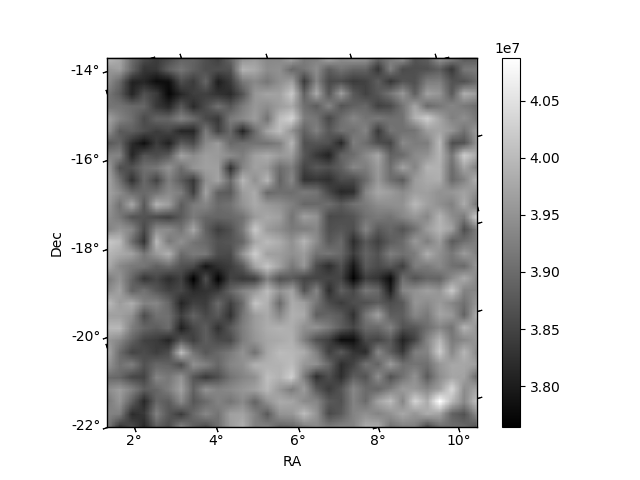
Histogram calculated using DETX and DETY for each event in the final _common_clean file
| Quadrant A | 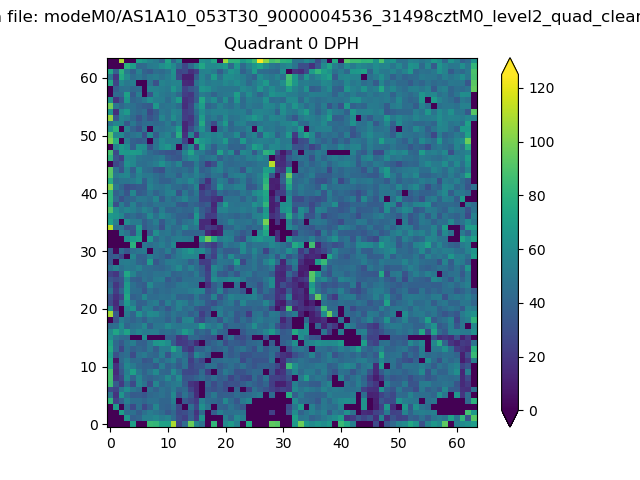 |
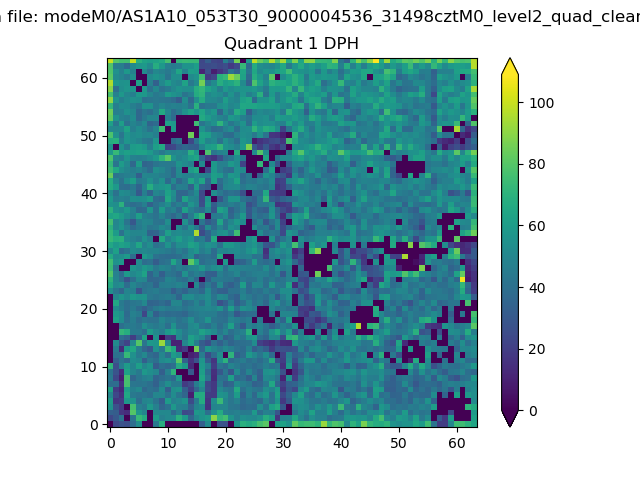 |
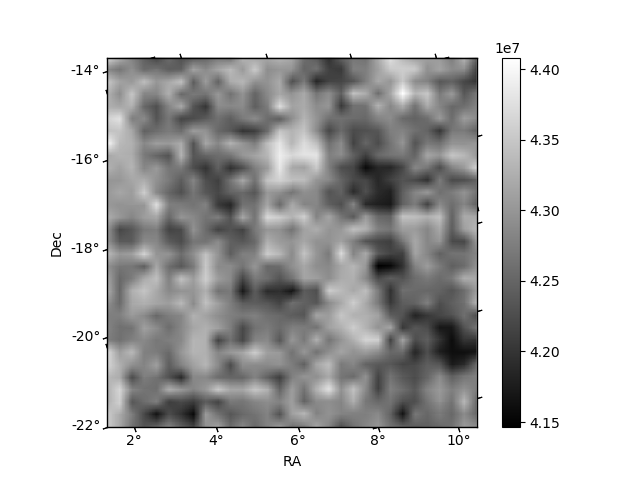
Quadrant B |
|---|---|---|---|
| Quadrant D | 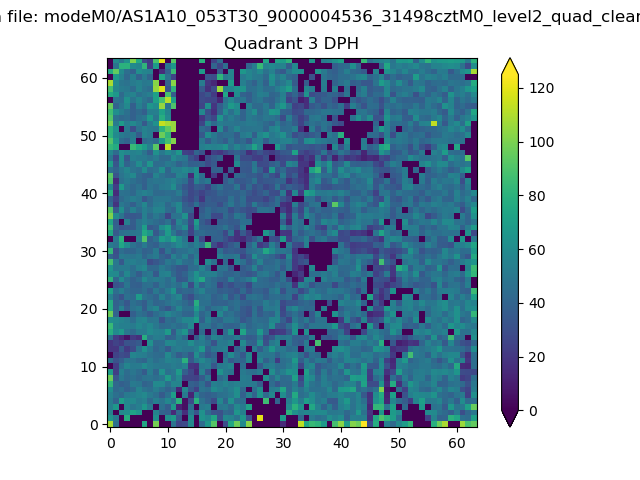 |
 |
Quadrant C |
| Plot type | Count rate plots | Images |
|---|---|---|
| Comparison with Poisson distribution Blue bars denote a histogram of data divided into 1 sec bins. Red curve is a Poisson curve with rate = median count rate of data. |
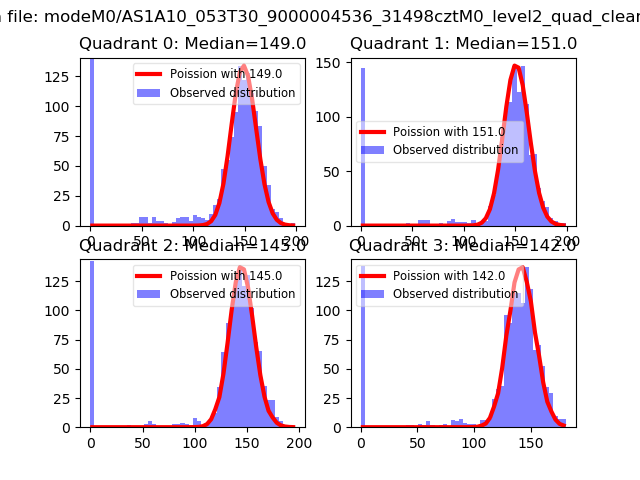 |
 |
| Quadrant-wise count rates Data is divided into 100 sec bins |
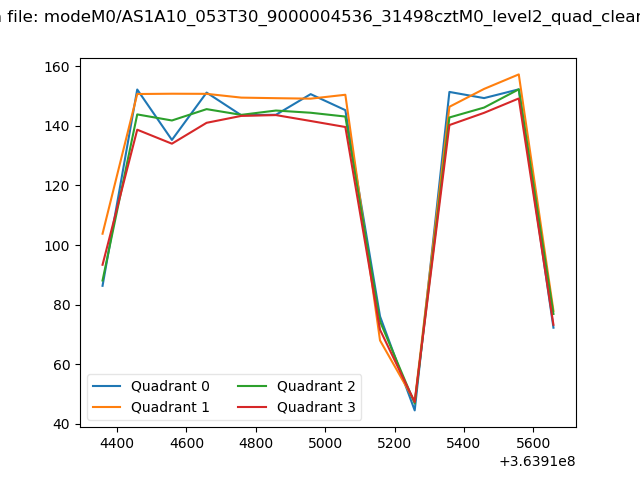 |
|
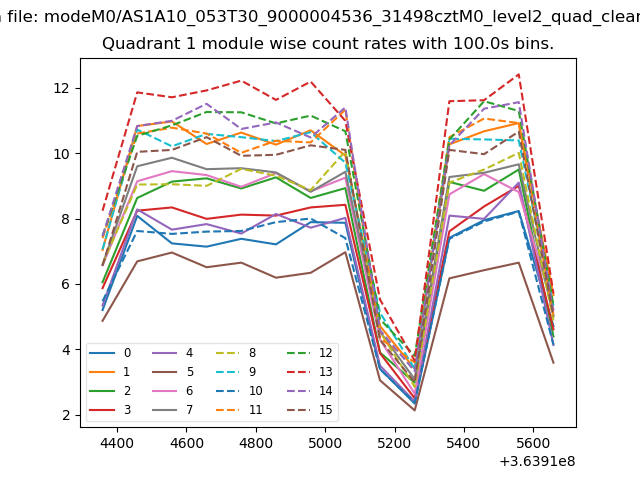
| Module-wise count rates for Quadrant A Data is divided into 100 sec bins |
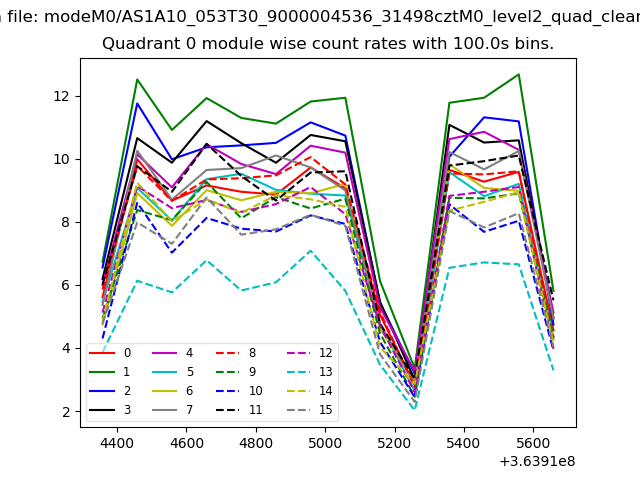 |
 |
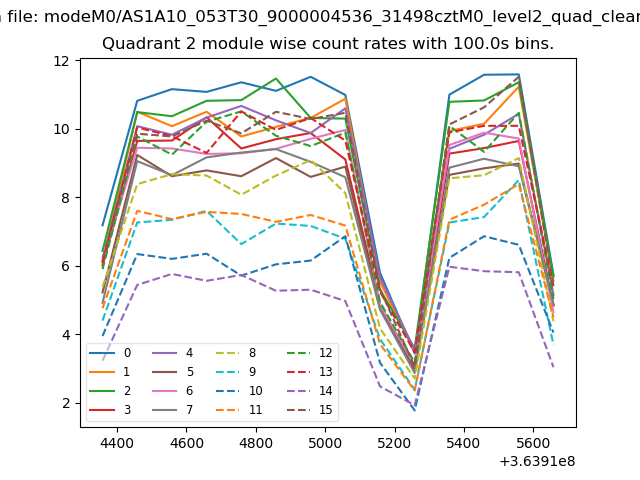
| Module-wise count rates for Quadrant B Data is divided into 100 sec bins |
 |
 |
| Module-wise count rates for Quadrant C Data is divided into 100 sec bins |
 |
 |
| Module-wise count rates for Quadrant D Data is divided into 100 sec bins |
 |
 |
| Parameter | Plot |
|---|---|
| CZT HV Monitor | 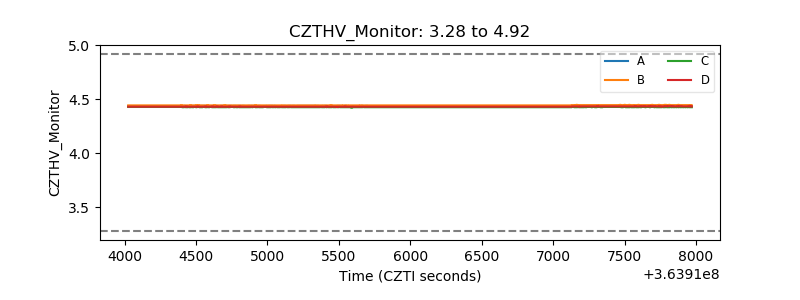 |
| D_VDD | 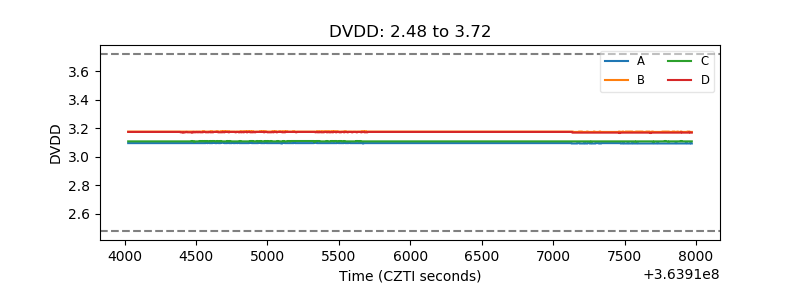 |
| Temperature 1 |  |
| Veto HV Monitor | 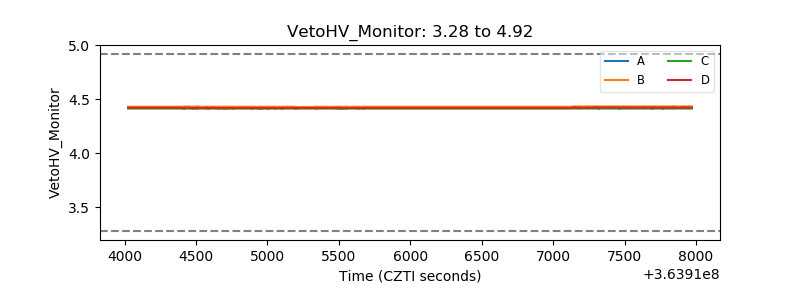 |
| Veto LLD |  |
| Alpha Counter | 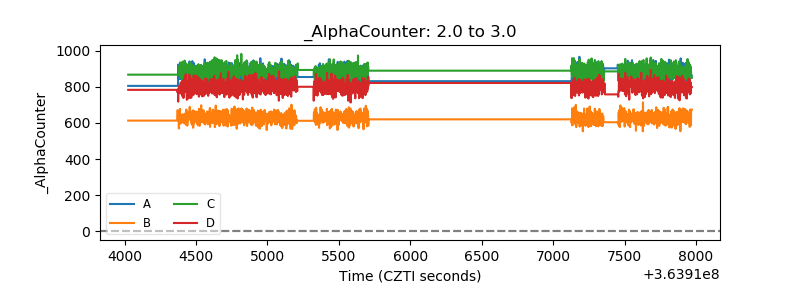 |
| _CPM_Rate | 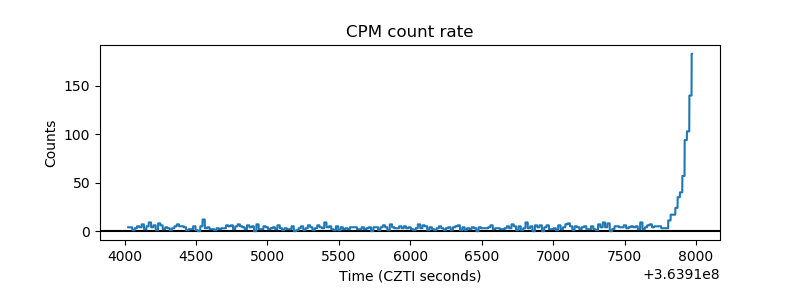 |
| CZT Counter | 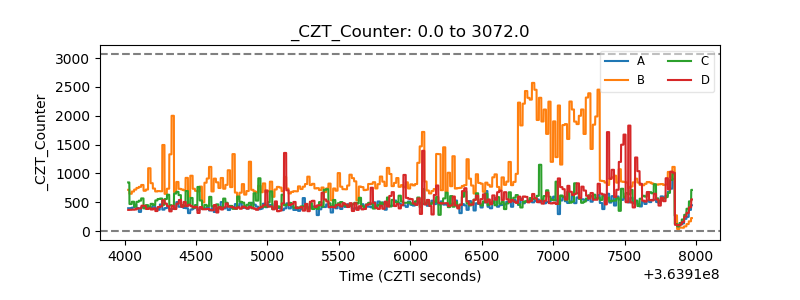 |
| +2.5 Volts monitor |  |
| +5 Volts monitor |  |
| _ROLL_ROT |  |
| _Roll_DEC | 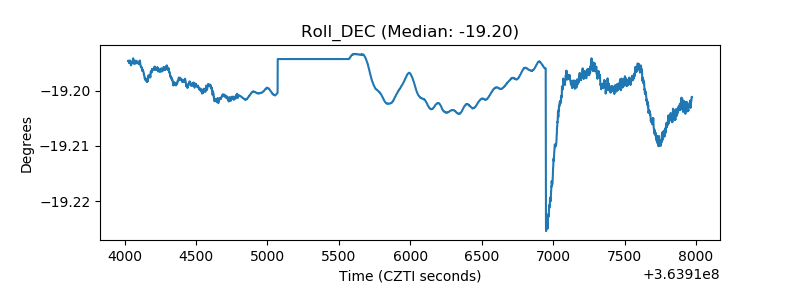 |
| _Roll_RA | 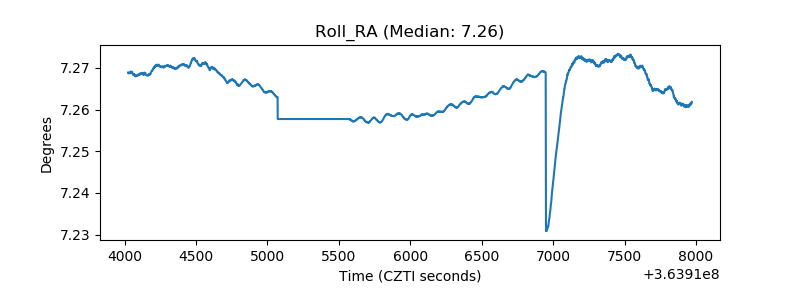 |
| Veto Counter | 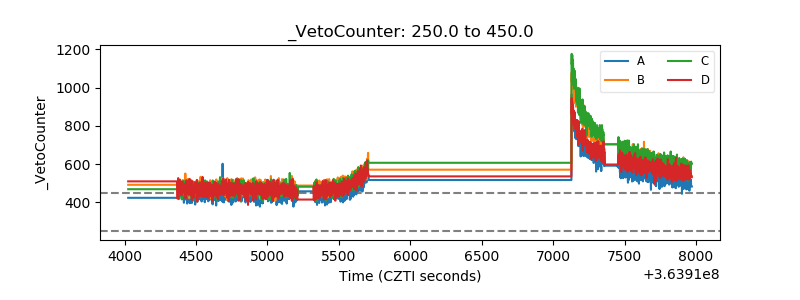 |