| Param | Original file | Final file |
|---|---|---|
| Filename | modeM0/AS1T04_025T01_9000004538cztM0_level2.fits | modeM0/AS1T04_025T01_9000004538cztM0_level2_quad_clean.evt |
| Size (bytes) | 768,752,640 | 882,708,480 |
| Size | 733.1 MB | 841.8 MB |
| Events in quadrant A | 4,866,196 | 5,734,623 |
| Events in quadrant B | 4,437,822 | 5,437,720 |
| Events in quadrant C | 4,586,790 | 5,320,670 |
| Events in quadrant D | 4,187,696 | 5,038,698 |
| Mode SS | |||
|---|---|---|---|
| Quadrant | BADHDUFLAG | Total packets | Discarded packets |
| A | 0 | 1542 | 0 |
| B | 0 | 1542 | 0 |
| C | 0 | 1542 | 0 |
| D | 0 | 1542 | 0 |
| Mode M0 | |||
|---|---|---|---|
| Quadrant | BADHDUFLAG | Total packets | Discarded packets |
| A | 0 | 158467 | 0 |
| B | 0 | 243931 | 0 |
| C | 0 | 171197 | 0 |
| D | 0 | 185399 | 0 |
| Mode M9 | |||
|---|---|---|---|
| Quadrant | BADHDUFLAG | Total packets | Discarded packets |
| A | 0 | 135 | 0 |
| B | 0 | 135 | 0 |
| C | 0 | 135 | 0 |
| D | 0 | 135 | 0 |
| Quadrant | Total seconds | Saturated seconds | Saturation percentage |
|---|---|---|---|
| A | 75890 | 729 | 0.960601% |
| B | 75890 | 3036 | 4.000527% |
| C | 75890 | 2787 | 3.672421% |
| D | 75890 | 1098 | 1.446831% |
Noise dominated data is calculated using 1-second bins in cleaned event files. If a bin has >2000 counts, and if more than 50% of those come from <1% of pixels, then it is considered to be noise-dominated and hence unusable.
| Quadrant | # 1 sec bins | Bins with >0 counts | Bins with >2000 counts | High rate bins dominated by noise | Noise dominated (total time) | Noise dominated (detector-on time) | Marked lightcurve |
|---|---|---|---|---|---|---|---|
| A | 88219 | 75889 | 0 | 0 | 0.00% | 0.00% |  |
| B | 88219 | 75859 | 0 | 0 | 0.00% | 0.00% |  |
| C | 88219 | 75823 | 0 | 0 | 0.00% | 0.00% |  |
| D | 88219 | 75886 | 0 | 0 | 0.00% | 0.00% |  |
Top three noisy pixels from each quadrant. If the there are fewer than three noisy pixels in the level2.evt file, extra rows are filled as -1
| Pixel properties | Quadrant properties | ||||||
|---|---|---|---|---|---|---|---|
| Quadrant | DetID | PixID | Counts | Sigma | Mean | Median | Sigma |
| A | 0 | 29 | 4106 | 9.69 | 1268 | 1203 | 299.7 |
| A | 7 | 110 | 3791 | 8.64 | 1268 | 1203 | 299.7 |
| A | 9 | 19 | 3628 | 8.09 | 1268 | 1203 | 299.7 |
| B | 2 | 9 | 3574 | 10.67 | 1177 | 1131 | 228.9 |
| B | 3 | 80 | 3083 | 8.53 | 1177 | 1131 | 228.9 |
| B | 2 | 8 | 2943 | 7.92 | 1177 | 1131 | 228.9 |
| C | 12 | 241 | 3294 | 7.11 | 1216 | 1147 | 302.0 |
| C | 9 | 209 | 3173 | 6.71 | 1216 | 1147 | 302.0 |
| C | 3 | 187 | 3168 | 6.69 | 1216 | 1147 | 302.0 |
| D | 10 | 189 | 2927 | 5.79 | 1196 | 1096 | 316.0 |
| D | 3 | 14 | 2914 | 5.75 | 1196 | 1096 | 316.0 |
| D | 6 | 67 | 2869 | 5.61 | 1196 | 1096 | 316.0 |
Histogram calculated using DETX and DETY for each event in the final _common_clean file
| Quadrant A | 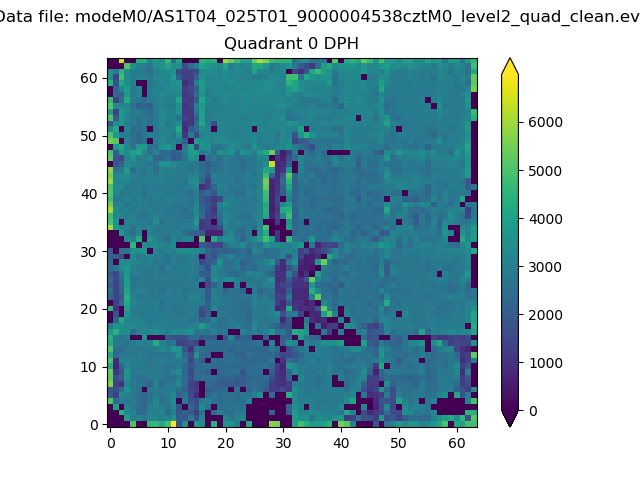 |
 |
Quadrant B |
|---|---|---|---|
| Quadrant D | 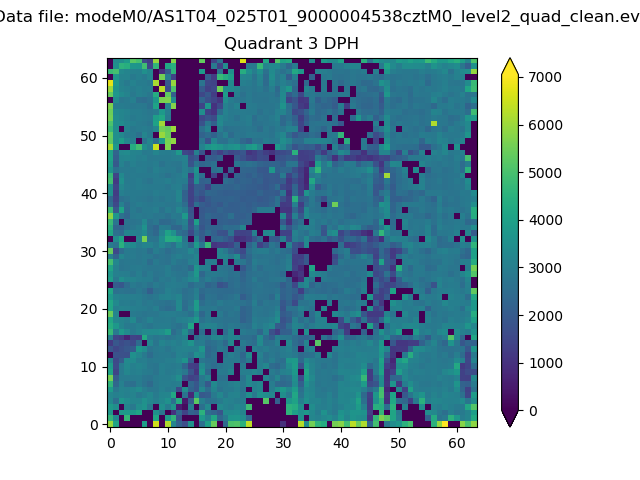 |
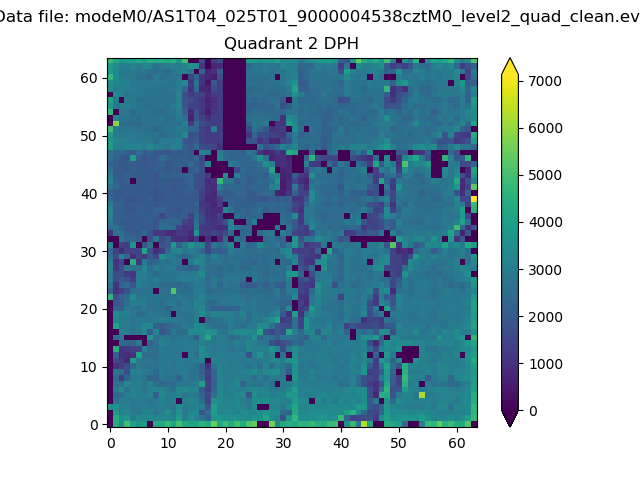 |
Quadrant C |
| Plot type | Count rate plots | Images |
|---|---|---|
| Comparison with Poisson distribution Blue bars denote a histogram of data divided into 1 sec bins. Red curve is a Poisson curve with rate = median count rate of data. |
 |
 |
| Quadrant-wise count rates Data is divided into 100 sec bins |
 |
|
| Module-wise count rates for Quadrant A Data is divided into 100 sec bins |
 |
 |
| Module-wise count rates for Quadrant B Data is divided into 100 sec bins |
 |
 |
| Module-wise count rates for Quadrant C Data is divided into 100 sec bins |
 |
 |
| Module-wise count rates for Quadrant D Data is divided into 100 sec bins |
 |
 |
| Parameter | Plot |
|---|---|
| CZT HV Monitor |  |
| D_VDD | 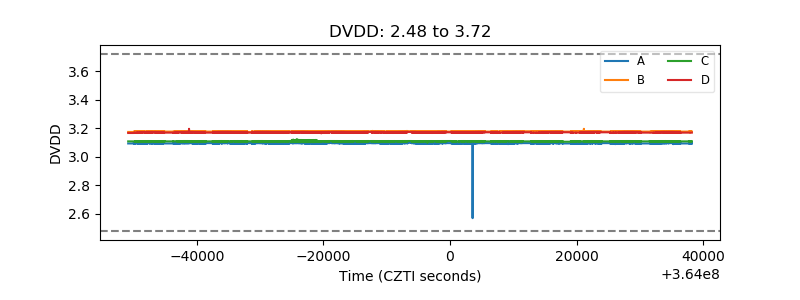 |
| Temperature 1 |  |
| Veto HV Monitor |  |
| Veto LLD |  |
| Alpha Counter |  |
| _CPM_Rate |  |
| CZT Counter |  |
| +2.5 Volts monitor |  |
| +5 Volts monitor |  |
| _ROLL_ROT |  |
| _Roll_DEC |  |
| _Roll_RA |  |
| Veto Counter |  |