| Param | Original file | Final file |
|---|---|---|
| Filename | modeM0/AS1T04_025T01_9000004538_31324cztM0_level2.evt | modeM0/AS1T04_025T01_9000004538_31324cztM0_level2_quad_clean.evt |
| Size (bytes) | 161,026,560 | 41,883,840 |
| Size | 153.6 MB | 39.9 MB |
| Events in quadrant A | 969,697 | 298,525 |
| Events in quadrant B | 1,484,543 | 290,347 |
| Events in quadrant C | 1,037,559 | 279,153 |
| Events in quadrant D | 1,268,868 | 277,025 |
| Mode SS | |||
|---|---|---|---|
| Quadrant | BADHDUFLAG | Total packets | Discarded packets |
| A | 0 | 34 | 0 |
| B | 0 | 34 | 0 |
| C | 0 | 34 | 0 |
| D | 0 | 34 | 0 |
| Mode M0 | |||
|---|---|---|---|
| Quadrant | BADHDUFLAG | Total packets | Discarded packets |
| A | 0 | 3946 | 1 |
| B | 0 | 5476 | 1 |
| C | 0 | 4198 | 1 |
| D | 0 | 5019 | 6 |
| Mode M9 | |||
|---|---|---|---|
| Quadrant | BADHDUFLAG | Total packets | Discarded packets |
| A | 0 | 9 | 0 |
| B | 0 | 9 | 0 |
| C | 0 | 9 | 0 |
| D | 0 | 9 | 0 |
| Quadrant | Total seconds | Saturated seconds | Saturation percentage |
|---|---|---|---|
| A | 1674 | 11 | 0.657109% |
| B | 1674 | 62 | 3.703704% |
| C | 1674 | 60 | 3.584229% |
| D | 1673 | 80 | 4.781829% |
Noise dominated data is calculated using 1-second bins in cleaned event files. If a bin has >2000 counts, and if more than 50% of those come from <1% of pixels, then it is considered to be noise-dominated and hence unusable.
| Quadrant | # 1 sec bins | Bins with >0 counts | Bins with >2000 counts | High rate bins dominated by noise | Noise dominated (total time) | Noise dominated (detector-on time) | Marked lightcurve |
|---|---|---|---|---|---|---|---|
| A | 1674 | 1674 | 0 | 0 | 0.00% | 0.00% | 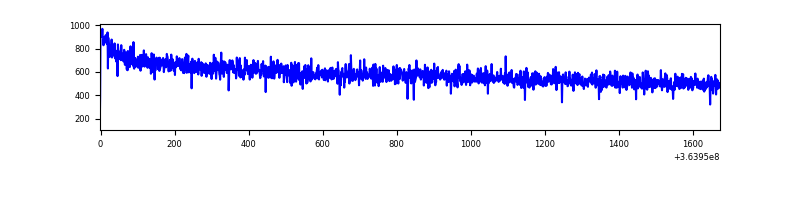 |
| B | 1674 | 1674 | 3 | 3 | 0.18% | 0.18% | 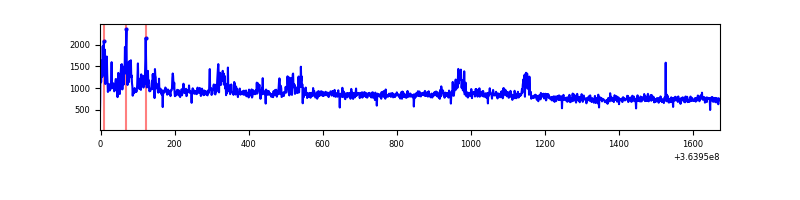 |
| C | 1674 | 1674 | 12 | 12 | 0.72% | 0.72% | 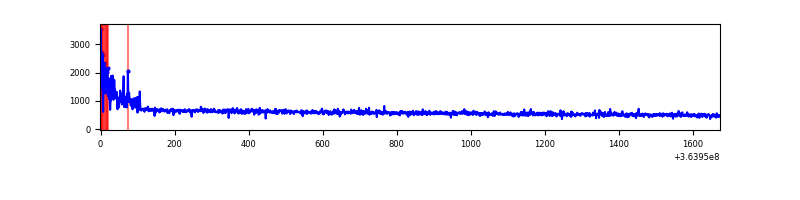 |
| D | 1673 | 1673 | 60 | 60 | 3.59% | 3.59% | 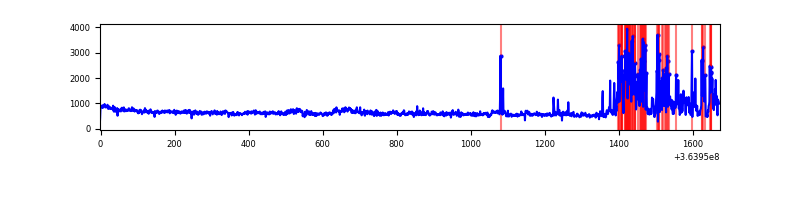 |
Top three noisy pixels from each quadrant. If the there are fewer than three noisy pixels in the level2.evt file, extra rows are filled as -1
| Pixel properties | Quadrant properties | ||||||
|---|---|---|---|---|---|---|---|
| Quadrant | DetID | PixID | Counts | Sigma | Mean | Median | Sigma |
| A | 13 | 254 | 3082 | 56.03 | 251 | 246 | 50.6 |
| A | 0 | 226 | 2190 | 38.4 | 251 | 246 | 50.6 |
| A | 3 | 137 | 2102 | 36.66 | 251 | 246 | 50.6 |
| B | 6 | 159 | 440353 | 9603.83 | 238 | 233 | 45.8 |
| B | 4 | 80 | 78606 | 1710.17 | 238 | 233 | 45.8 |
| B | 0 | 190 | 25273 | 546.4 | 238 | 233 | 45.8 |
| C | 0 | 10 | 60891 | 1086.4 | 235 | 237 | 55.8 |
| C | 14 | 238 | 39479 | 702.88 | 235 | 237 | 55.8 |
| C | 3 | 233 | 13774 | 242.47 | 235 | 237 | 55.8 |
| D | 12 | 233 | 250598 | 4365.64 | 243 | 238 | 57.3 |
| D | 8 | 195 | 84783 | 1474.25 | 243 | 238 | 57.3 |
| D | 2 | 250 | 8787 | 149.07 | 243 | 238 | 57.3 |
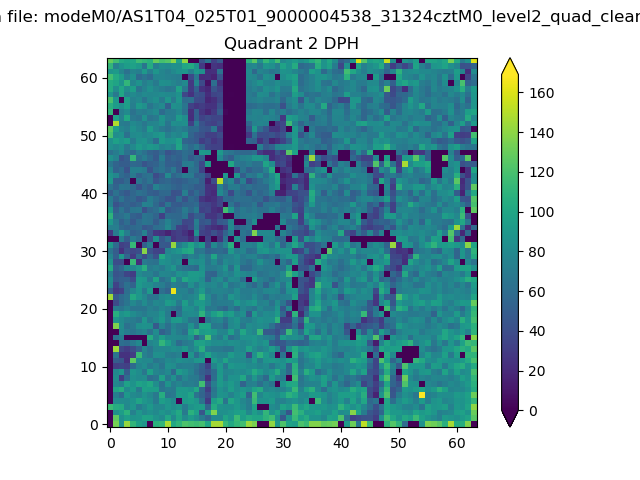
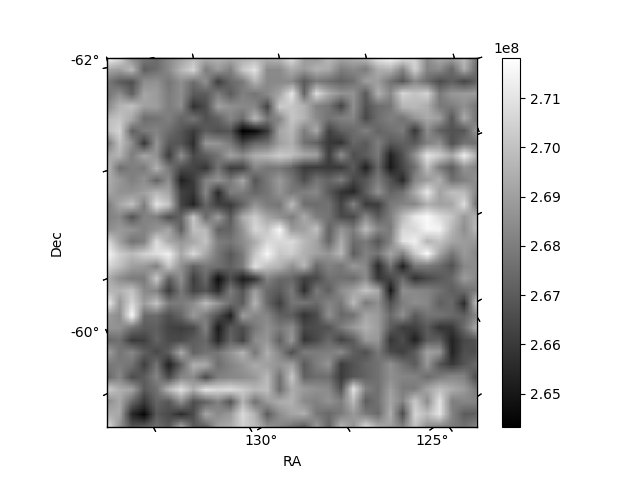
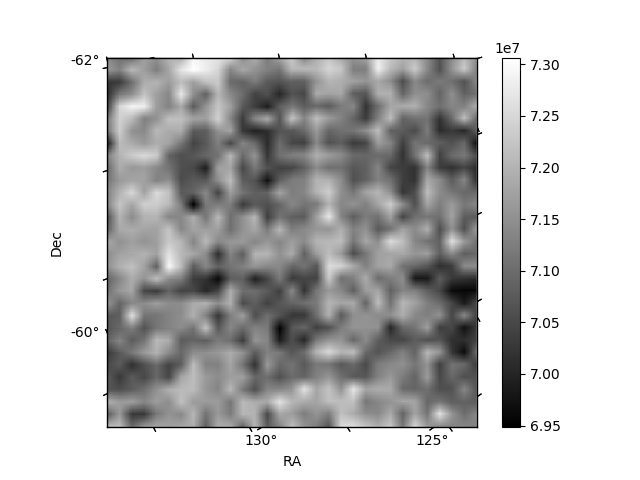
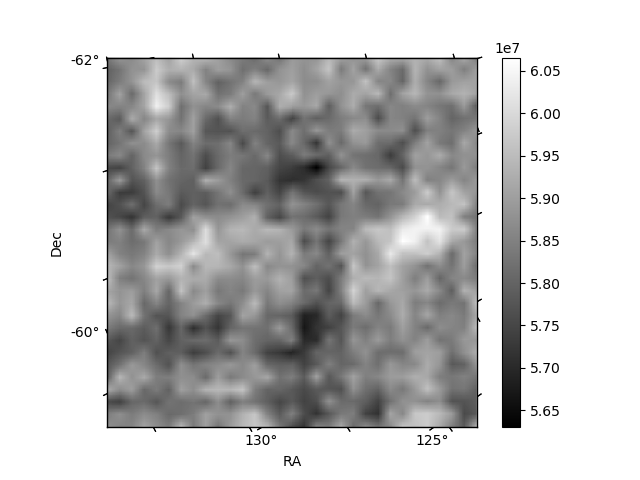
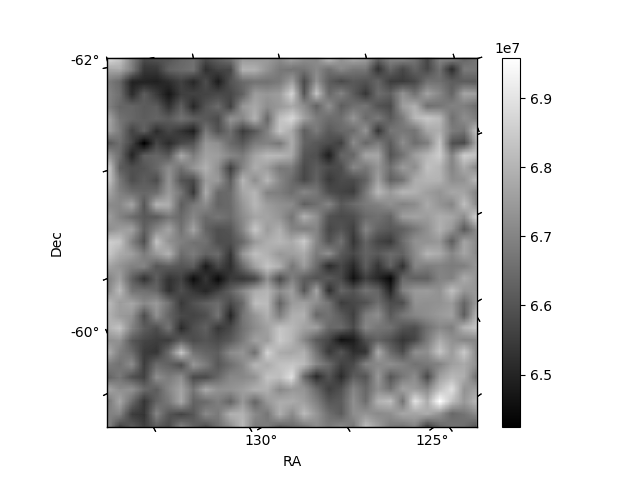
Histogram calculated using DETX and DETY for each event in the final _common_clean file
| Quadrant A | 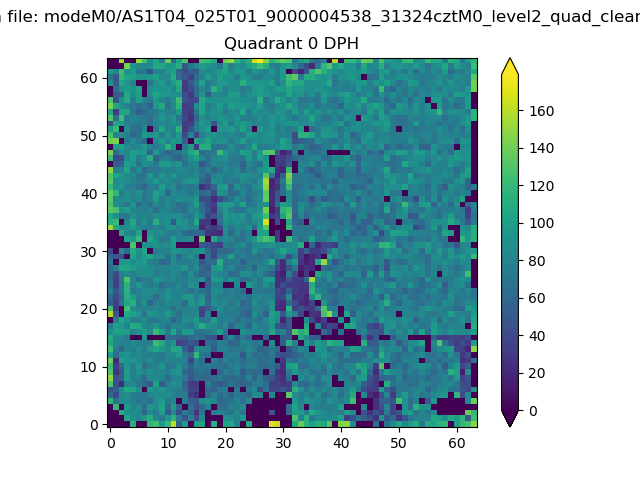 |
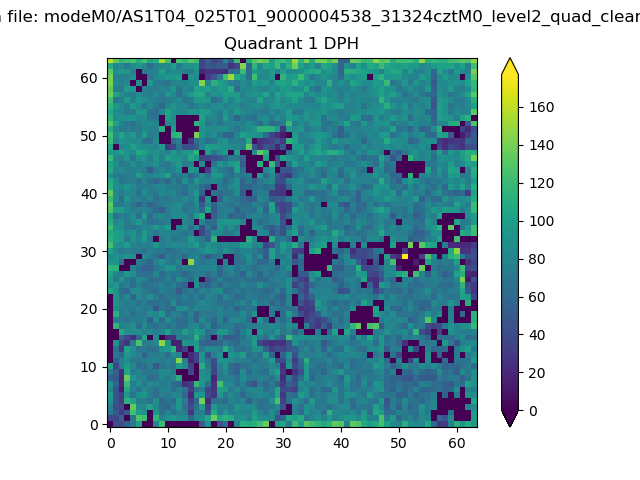 |
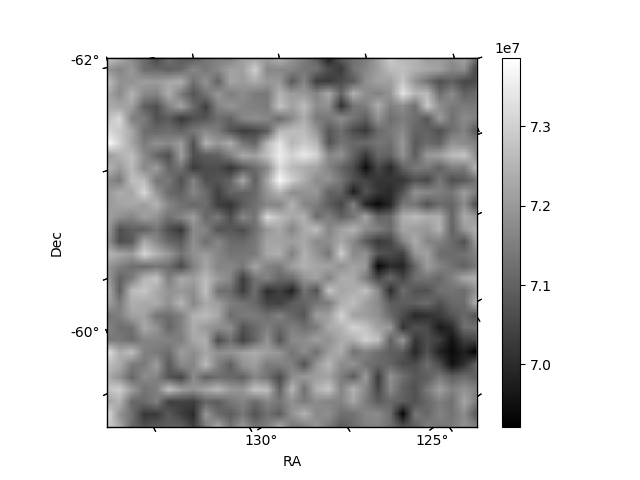
Quadrant B |
|---|---|---|---|
| Quadrant D | 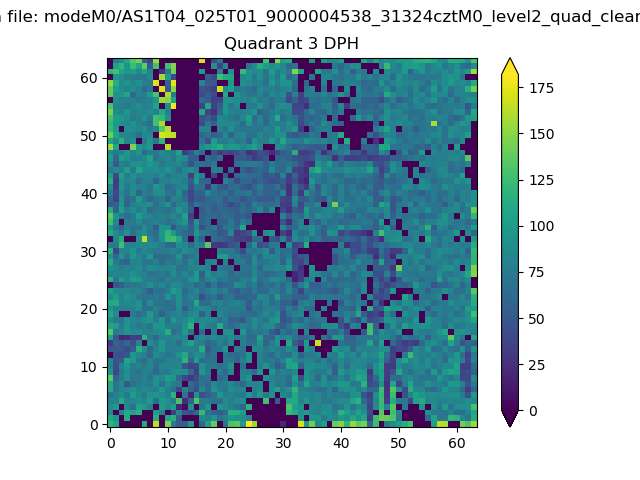 |
 |
Quadrant C |
| Plot type | Count rate plots | Images |
|---|---|---|
| Comparison with Poisson distribution Blue bars denote a histogram of data divided into 1 sec bins. Red curve is a Poisson curve with rate = median count rate of data. |
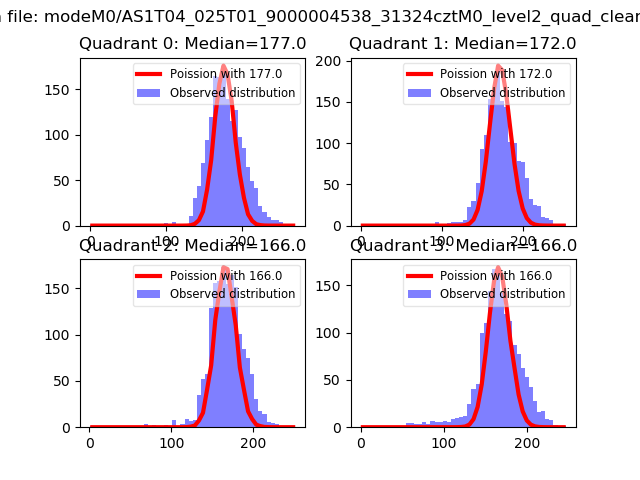 |
 |
| Quadrant-wise count rates Data is divided into 100 sec bins |
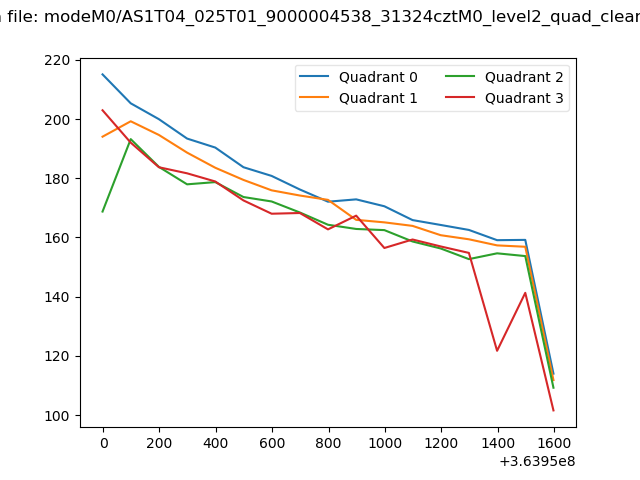 |
|
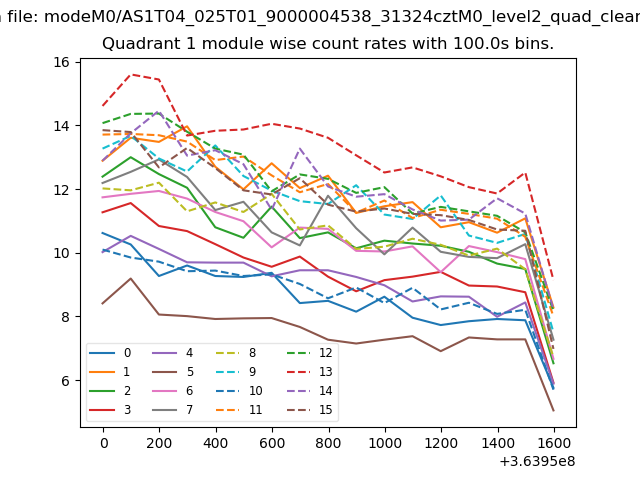
| Module-wise count rates for Quadrant A Data is divided into 100 sec bins |
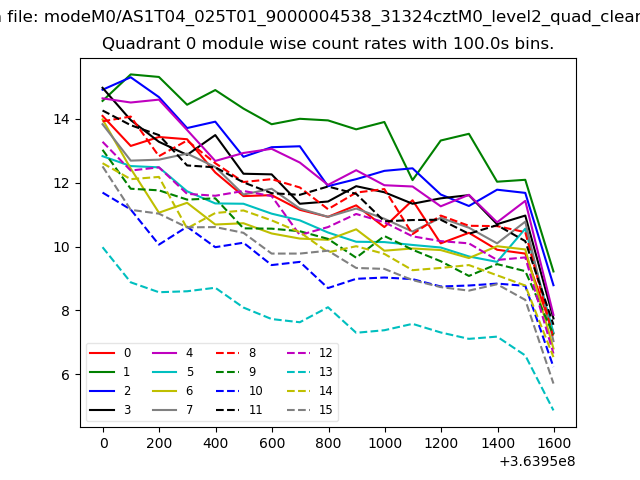 |
 |
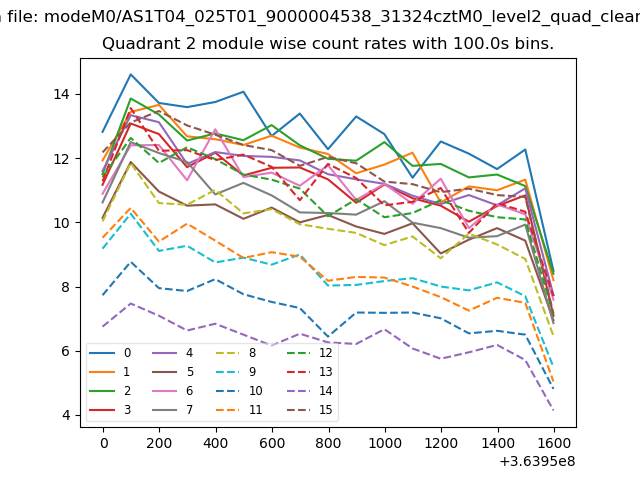
| Module-wise count rates for Quadrant B Data is divided into 100 sec bins |
 |
 |
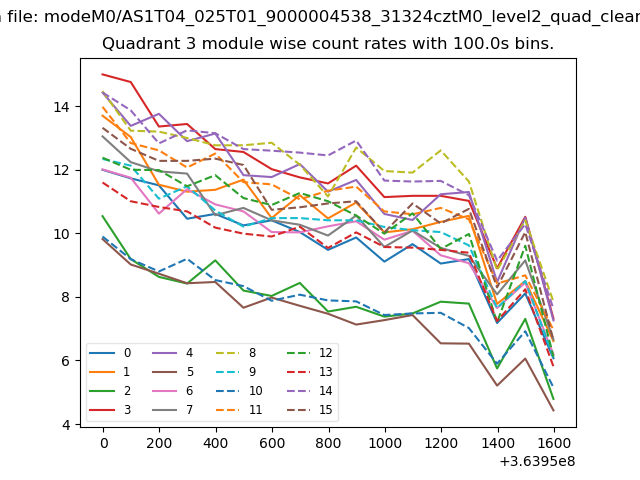
| Module-wise count rates for Quadrant C Data is divided into 100 sec bins |
 |
 |
| Module-wise count rates for Quadrant D Data is divided into 100 sec bins |
 |
 |
| Parameter | Plot |
|---|---|
| CZT HV Monitor | 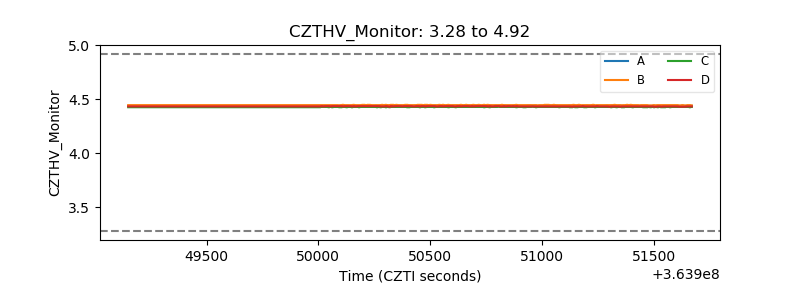 |
| D_VDD | 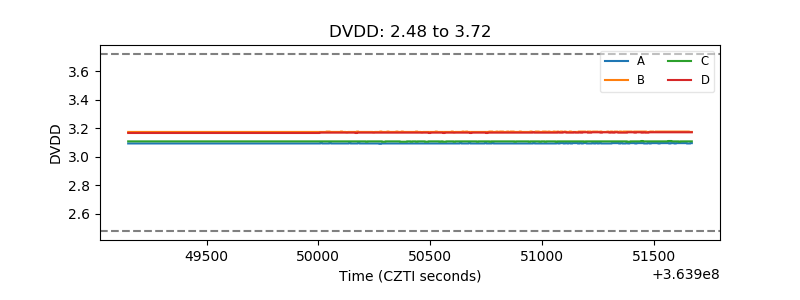 |
| Temperature 1 | 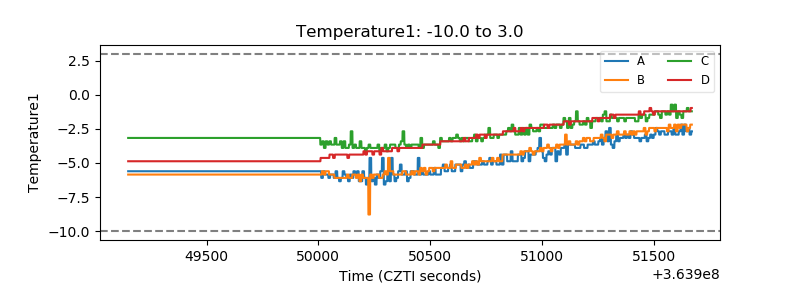 |
| Veto HV Monitor | 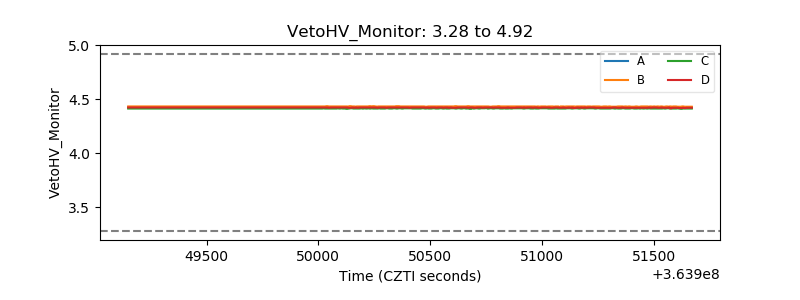 |
| Veto LLD | 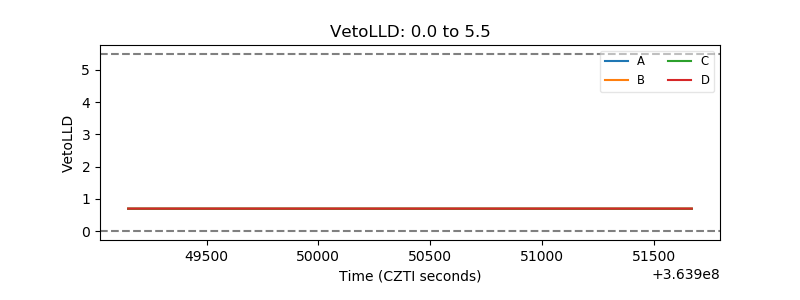 |
| Alpha Counter | 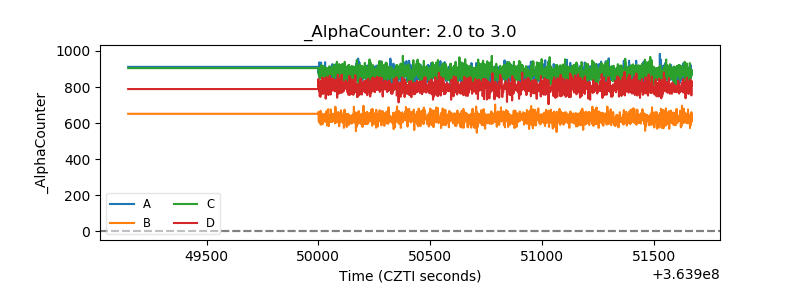 |
| _CPM_Rate | 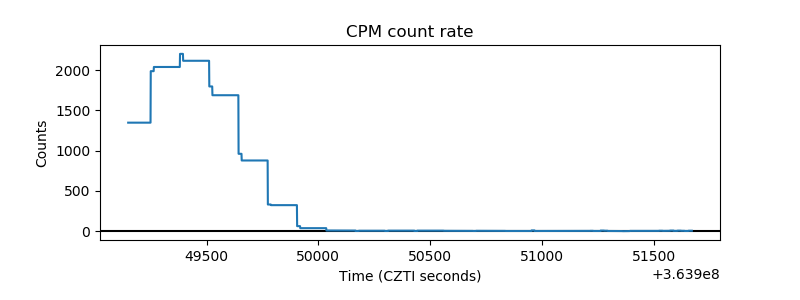 |
| CZT Counter | 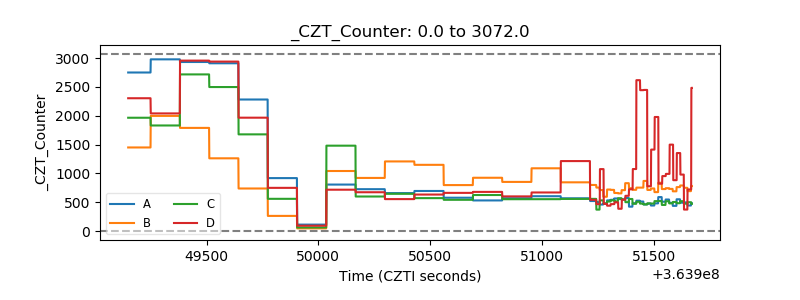 |
| +2.5 Volts monitor |  |
| +5 Volts monitor |  |
| _ROLL_ROT | 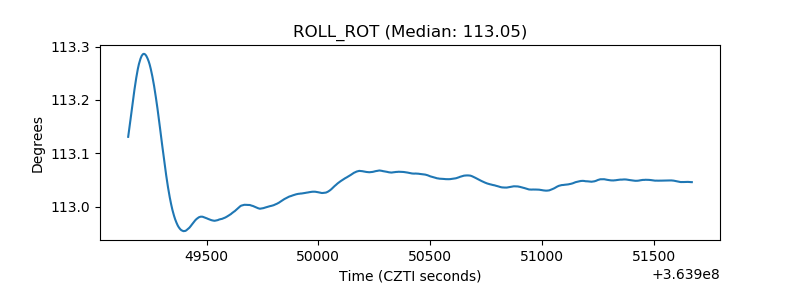 |
| _Roll_DEC | 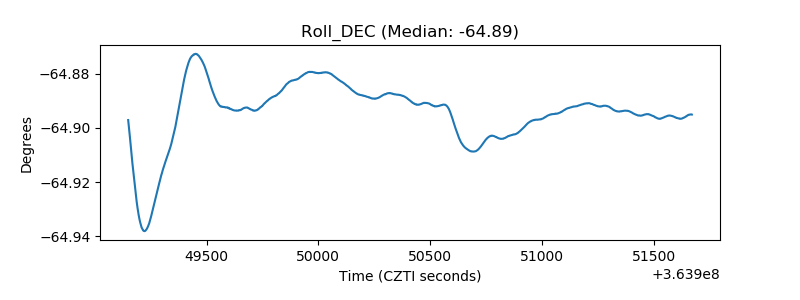 |
| _Roll_RA | 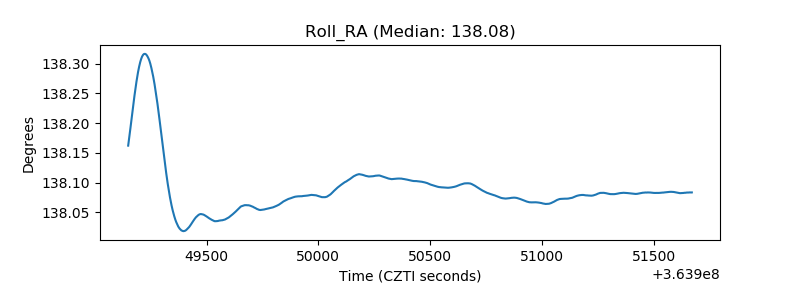 |
| Veto Counter | 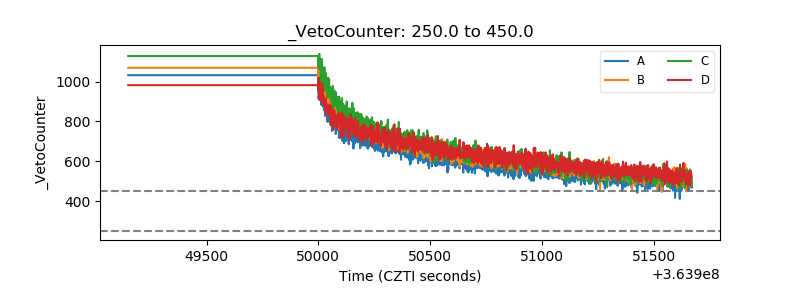 |