| Param | Original file | Final file |
|---|---|---|
| Filename | modeM0/AS1T04_025T01_9000004538_31325cztM0_level2.evt | modeM0/AS1T04_025T01_9000004538_31325cztM0_level2_quad_clean.evt |
| Size (bytes) | 522,120,960 | 136,681,920 |
| Size | 497.9 MB | 130.4 MB |
| Events in quadrant A | 3,181,062 | 963,081 |
| Events in quadrant B | 5,037,264 | 932,837 |
| Events in quadrant C | 3,330,007 | 905,846 |
| Events in quadrant D | 3,846,671 | 908,007 |
| Mode SS | |||
|---|---|---|---|
| Quadrant | BADHDUFLAG | Total packets | Discarded packets |
| A | 0 | 126 | 0 |
| B | 0 | 126 | 0 |
| C | 0 | 126 | 0 |
| D | 0 | 126 | 0 |
| Mode M0 | |||
|---|---|---|---|
| Quadrant | BADHDUFLAG | Total packets | Discarded packets |
| A | 0 | 13046 | 1 |
| B | 0 | 19335 | 1 |
| C | 0 | 13649 | 1 |
| D | 0 | 15438 | 1 |
| Mode M9 | |||
|---|---|---|---|
| Quadrant | BADHDUFLAG | Total packets | Discarded packets |
| A | 0 | 12 | 0 |
| B | 0 | 12 | 0 |
| C | 0 | 12 | 0 |
| D | 0 | 12 | 0 |
| Quadrant | Total seconds | Saturated seconds | Saturation percentage |
|---|---|---|---|
| A | 6158 | 108 | 1.753816% |
| B | 6158 | 196 | 3.182852% |
| C | 6158 | 213 | 3.458915% |
| D | 6158 | 183 | 2.971744% |
Noise dominated data is calculated using 1-second bins in cleaned event files. If a bin has >2000 counts, and if more than 50% of those come from <1% of pixels, then it is considered to be noise-dominated and hence unusable.
| Quadrant | # 1 sec bins | Bins with >0 counts | Bins with >2000 counts | High rate bins dominated by noise | Noise dominated (total time) | Noise dominated (detector-on time) | Marked lightcurve |
|---|---|---|---|---|---|---|---|
| A | 7413 | 6159 | 0 | 0 | 0.00% | 0.00% | 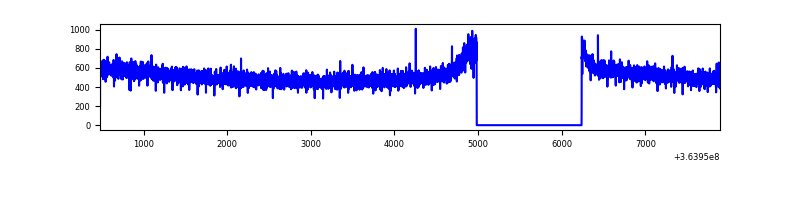 |
| B | 7413 | 6159 | 10 | 10 | 0.13% | 0.16% |  |
| C | 7413 | 6159 | 20 | 20 | 0.27% | 0.32% |  |
| D | 7413 | 6159 | 76 | 76 | 1.03% | 1.23% | 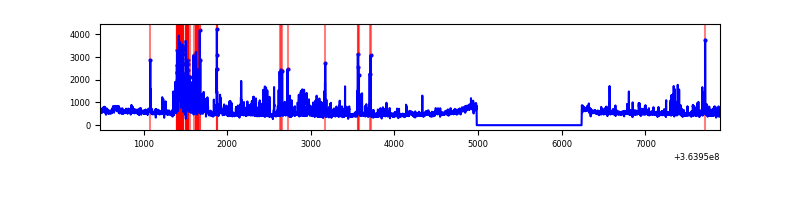 |
Top three noisy pixels from each quadrant. If the there are fewer than three noisy pixels in the level2.evt file, extra rows are filled as -1
| Pixel properties | Quadrant properties | ||||||
|---|---|---|---|---|---|---|---|
| Quadrant | DetID | PixID | Counts | Sigma | Mean | Median | Sigma |
| A | 13 | 254 | 11194 | 63.89 | 824 | 809 | 162.5 |
| A | 3 | 137 | 7642 | 42.04 | 824 | 809 | 162.5 |
| A | 0 | 226 | 7163 | 39.09 | 824 | 809 | 162.5 |
| B | 6 | 159 | 1631526 | 10985.51 | 790 | 772 | 148.4 |
| B | 4 | 80 | 183516 | 1231.05 | 790 | 772 | 148.4 |
| B | 0 | 190 | 67672 | 450.67 | 790 | 772 | 148.4 |
| C | 14 | 238 | 130883 | 739.63 | 767 | 774 | 175.9 |
| C | 0 | 10 | 100590 | 567.42 | 767 | 774 | 175.9 |
| C | 3 | 233 | 83684 | 471.32 | 767 | 774 | 175.9 |
| D | 12 | 233 | 383353 | 2068.94 | 797 | 778 | 184.9 |
| D | 8 | 195 | 363130 | 1959.58 | 797 | 778 | 184.9 |
| D | 2 | 250 | 70052 | 374.63 | 797 | 778 | 184.9 |
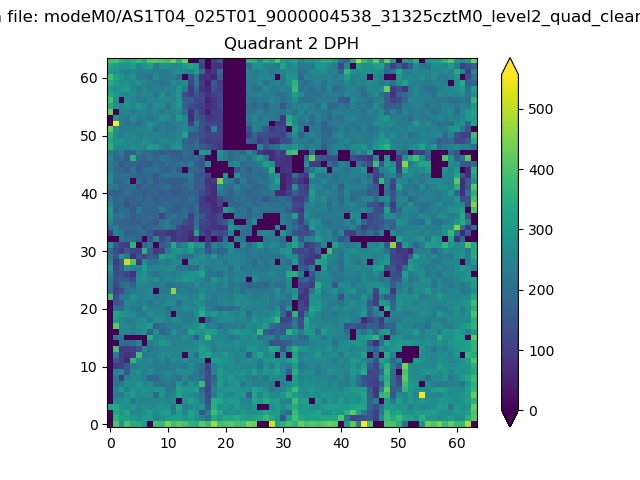
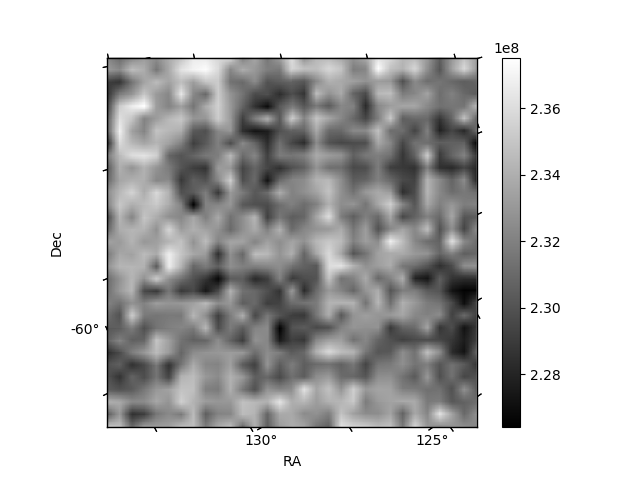
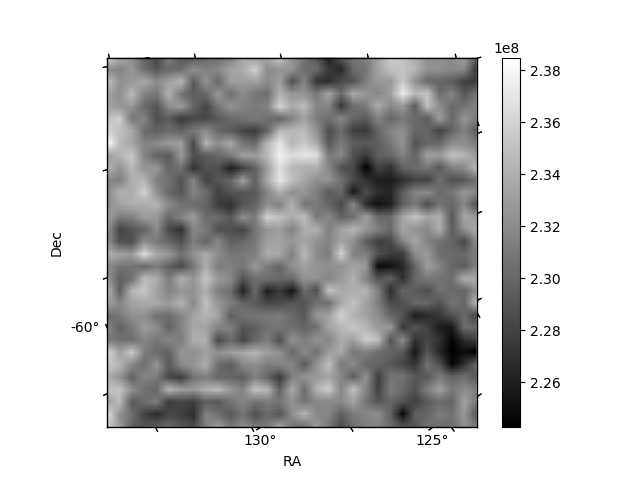
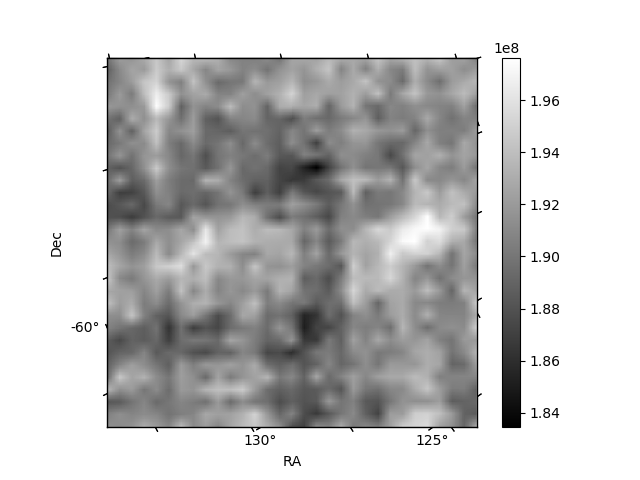
Histogram calculated using DETX and DETY for each event in the final _common_clean file
| Quadrant A | 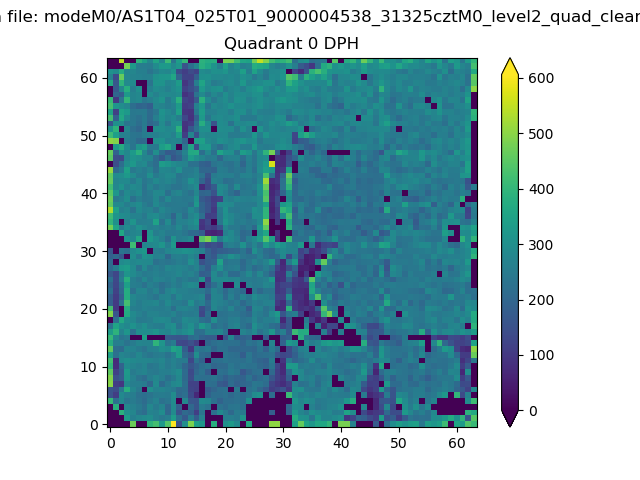 |
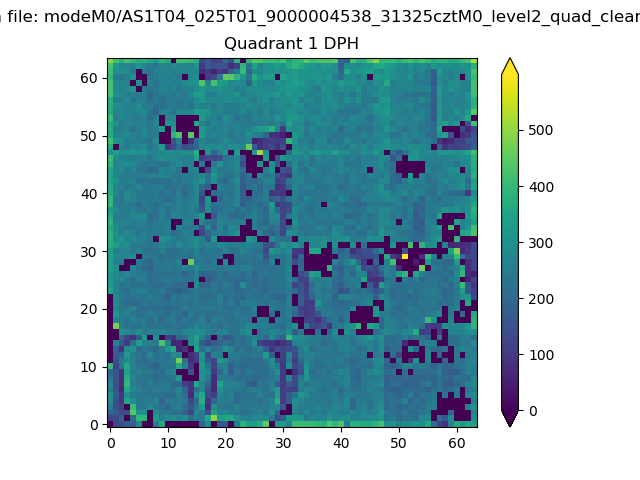 |
Quadrant B |
|---|---|---|---|
| Quadrant D |  |
 |
Quadrant C |
| Plot type | Count rate plots | Images |
|---|---|---|
| Comparison with Poisson distribution Blue bars denote a histogram of data divided into 1 sec bins. Red curve is a Poisson curve with rate = median count rate of data. |
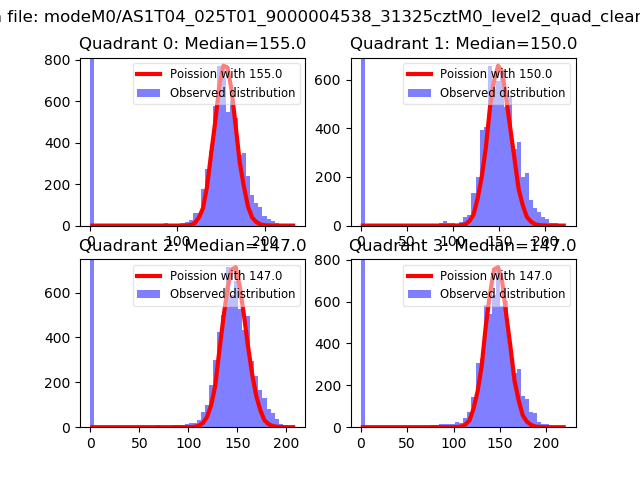 |
 |
| Quadrant-wise count rates Data is divided into 100 sec bins |
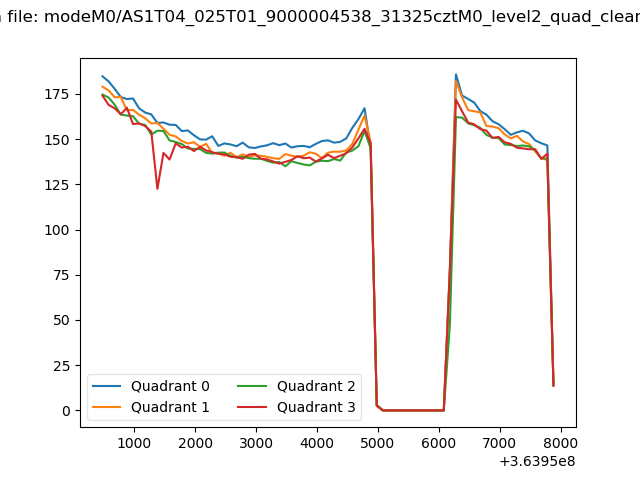 |
|
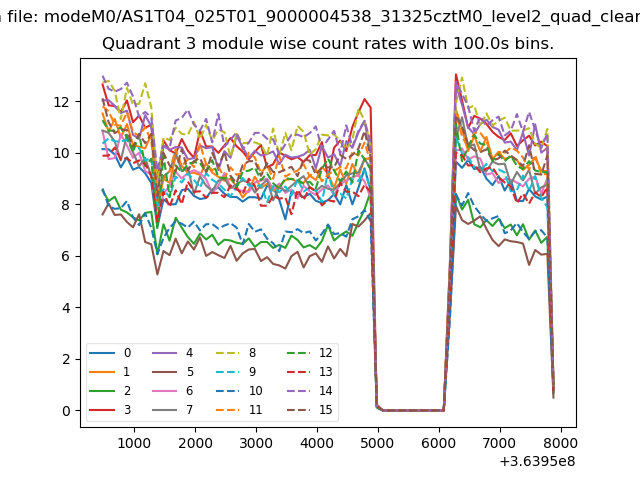
| Module-wise count rates for Quadrant A Data is divided into 100 sec bins |
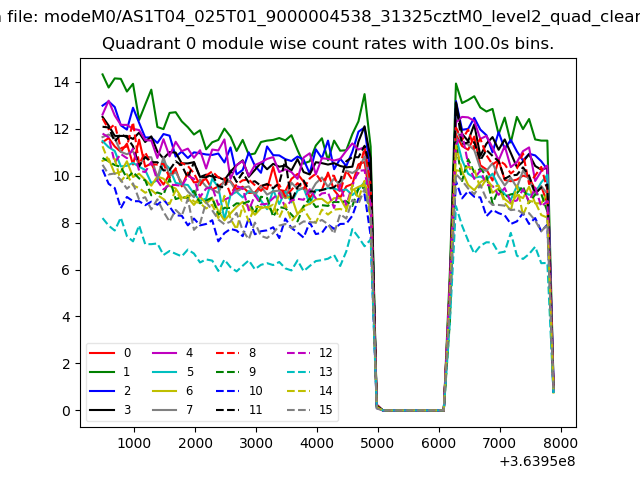 |
 |
| Module-wise count rates for Quadrant B Data is divided into 100 sec bins |
 |
 |
| Module-wise count rates for Quadrant C Data is divided into 100 sec bins |
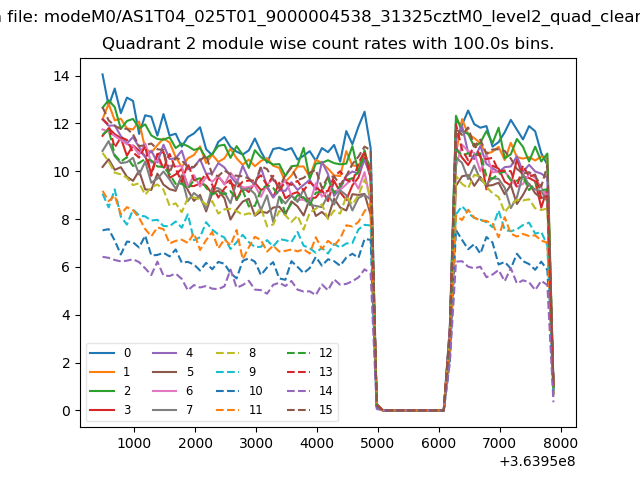 |
 |
| Module-wise count rates for Quadrant D Data is divided into 100 sec bins |
 |
 |
| Parameter | Plot |
|---|---|
| CZT HV Monitor | 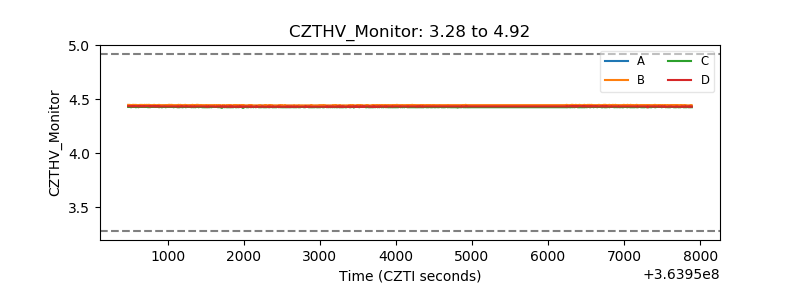 |
| D_VDD | 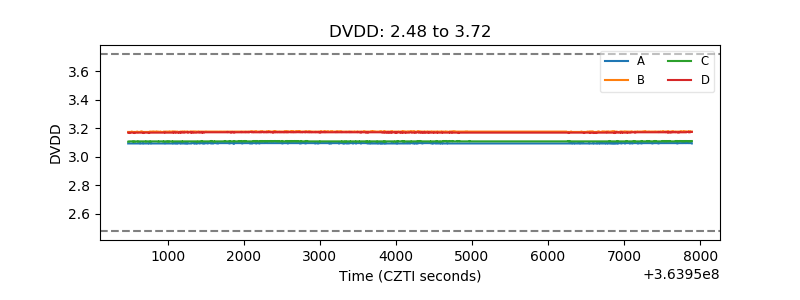 |
| Temperature 1 | 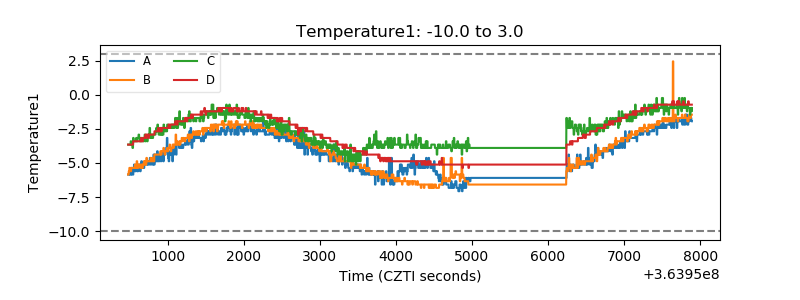 |
| Veto HV Monitor | 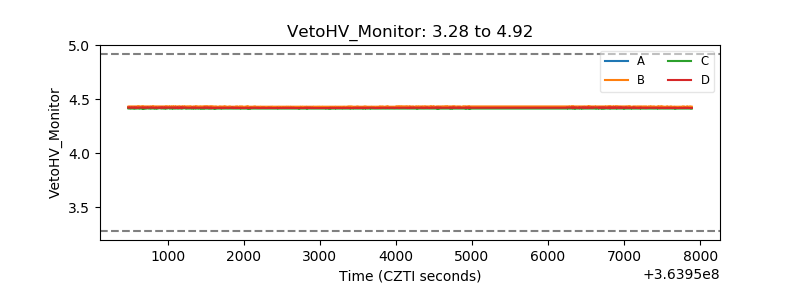 |
| Veto LLD |  |
| Alpha Counter | 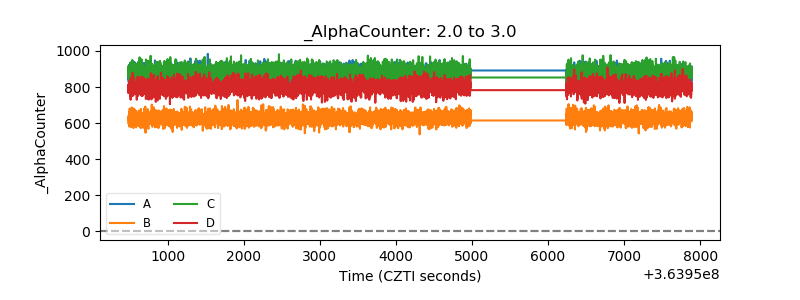 |
| _CPM_Rate | 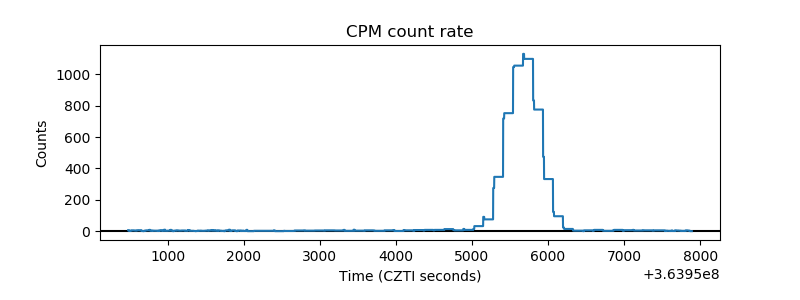 |
| CZT Counter | 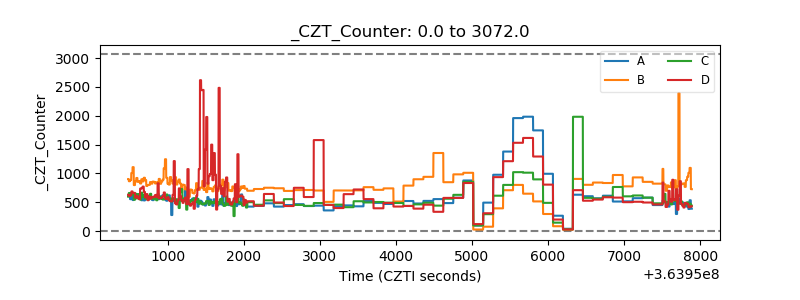 |
| +2.5 Volts monitor |  |
| +5 Volts monitor |  |
| _ROLL_ROT | 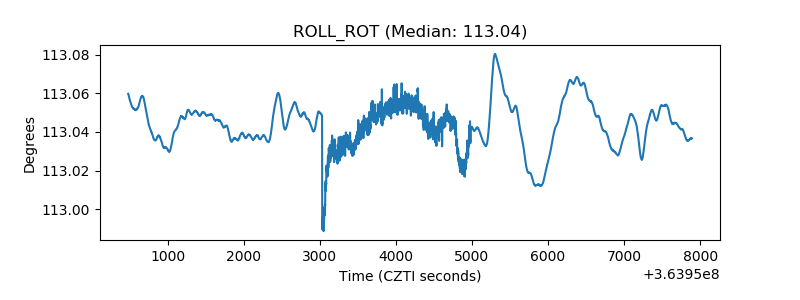 |
| _Roll_DEC | 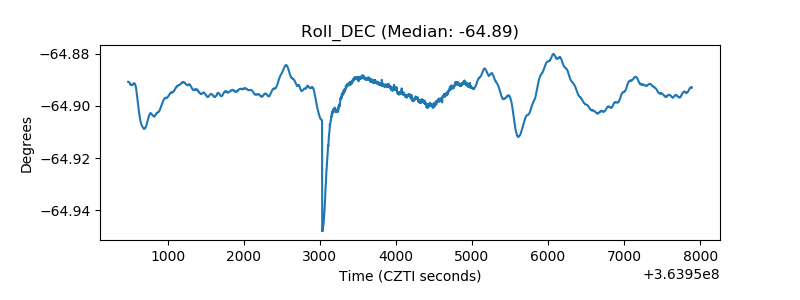 |
| _Roll_RA | 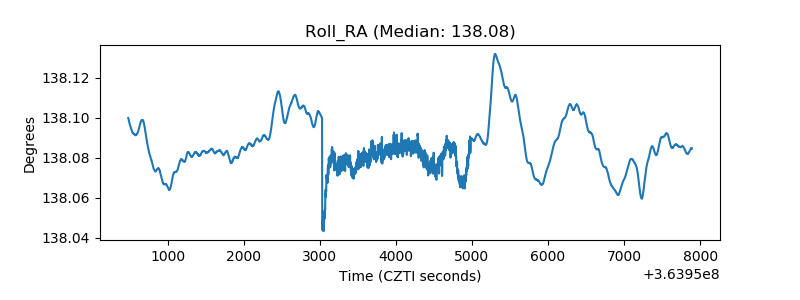 |
| Veto Counter | 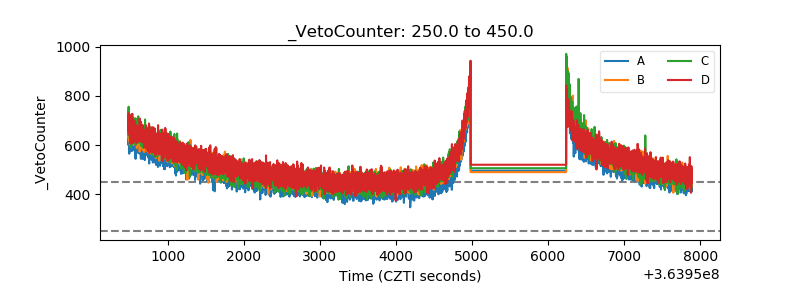 |