| Param | Original file | Final file |
|---|---|---|
| Filename | modeM0/AS1T04_025T01_9000004538_31329cztM0_level2.evt | modeM0/AS1T04_025T01_9000004538_31329cztM0_level2_quad_clean.evt |
| Size (bytes) | 592,960,320 | 137,321,280 |
| Size | 565.5 MB | 131.0 MB |
| Events in quadrant A | 3,401,779 | 947,021 |
| Events in quadrant B | 6,158,763 | 906,030 |
| Events in quadrant C | 3,594,781 | 899,693 |
| Events in quadrant D | 4,308,182 | 898,468 |
| Mode SS | |||
|---|---|---|---|
| Quadrant | BADHDUFLAG | Total packets | Discarded packets |
| A | 0 | 148 | 0 |
| B | 0 | 148 | 0 |
| C | 0 | 148 | 0 |
| D | 0 | 148 | 0 |
| Mode M0 | |||
|---|---|---|---|
| Quadrant | BADHDUFLAG | Total packets | Discarded packets |
| A | 0 | 14956 | 1 |
| B | 0 | 23772 | 1 |
| C | 0 | 15389 | 1 |
| D | 0 | 17842 | 1 |
| Mode M9 | |||
|---|---|---|---|
| Quadrant | BADHDUFLAG | Total packets | Discarded packets |
| A | 0 | 2 | 0 |
| B | 0 | 2 | 0 |
| C | 0 | 2 | 0 |
| D | 0 | 2 | 0 |
| Quadrant | Total seconds | Saturated seconds | Saturation percentage |
|---|---|---|---|
| A | 7296 | 43 | 0.589364% |
| B | 7296 | 413 | 5.660636% |
| C | 7296 | 171 | 2.343750% |
| D | 7297 | 109 | 1.493765% |
Noise dominated data is calculated using 1-second bins in cleaned event files. If a bin has >2000 counts, and if more than 50% of those come from <1% of pixels, then it is considered to be noise-dominated and hence unusable.
| Quadrant | # 1 sec bins | Bins with >0 counts | Bins with >2000 counts | High rate bins dominated by noise | Noise dominated (total time) | Noise dominated (detector-on time) | Marked lightcurve |
|---|---|---|---|---|---|---|---|
| A | 7536 | 7297 | 0 | 0 | 0.00% | 0.00% | 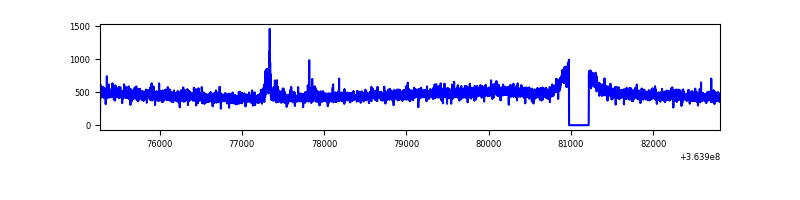 |
| B | 7536 | 7297 | 165 | 165 | 2.19% | 2.26% | 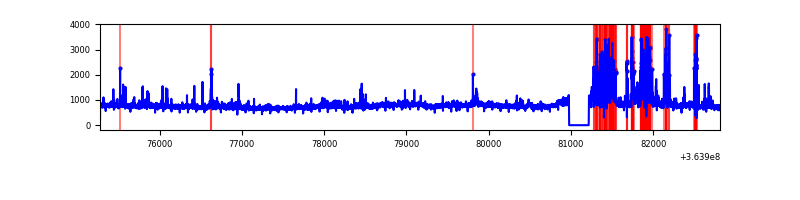 |
| C | 7536 | 7297 | 2 | 2 | 0.03% | 0.03% | 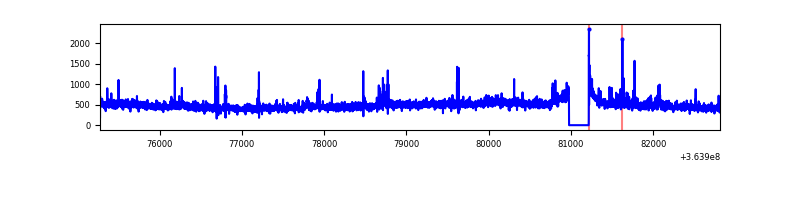 |
| D | 7537 | 7298 | 86 | 86 | 1.14% | 1.18% | 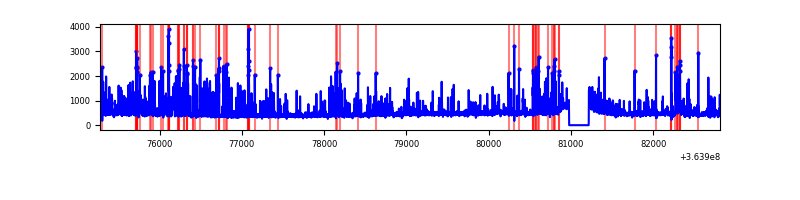 |
Top three noisy pixels from each quadrant. If the there are fewer than three noisy pixels in the level2.evt file, extra rows are filled as -1
| Pixel properties | Quadrant properties | ||||||
|---|---|---|---|---|---|---|---|
| Quadrant | DetID | PixID | Counts | Sigma | Mean | Median | Sigma |
| A | 5 | 16 | 38092 | 213.13 | 871 | 852 | 174.7 |
| A | 13 | 254 | 14215 | 76.48 | 871 | 852 | 174.7 |
| A | 3 | 137 | 8751 | 45.21 | 871 | 852 | 174.7 |
| B | 6 | 159 | 2028044 | 12497.86 | 836 | 813 | 162.2 |
| B | 5 | 172 | 609464 | 3752.33 | 836 | 813 | 162.2 |
| B | 0 | 190 | 69967 | 426.33 | 836 | 813 | 162.2 |
| C | 14 | 238 | 165860 | 858.18 | 820 | 821 | 192.3 |
| C | 3 | 233 | 133076 | 687.71 | 820 | 821 | 192.3 |
| C | 14 | 254 | 44870 | 229.05 | 820 | 821 | 192.3 |
| D | 8 | 195 | 828136 | 4112.74 | 839 | 813 | 201.2 |
| D | 12 | 233 | 181676 | 899.1 | 839 | 813 | 201.2 |
| D | 7 | 69 | 44963 | 219.48 | 839 | 813 | 201.2 |
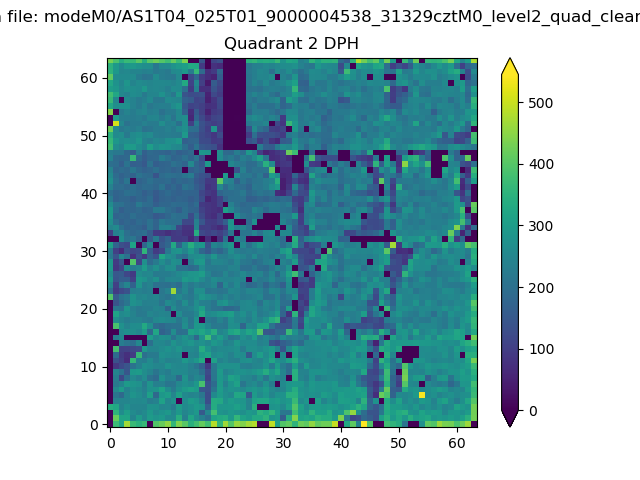
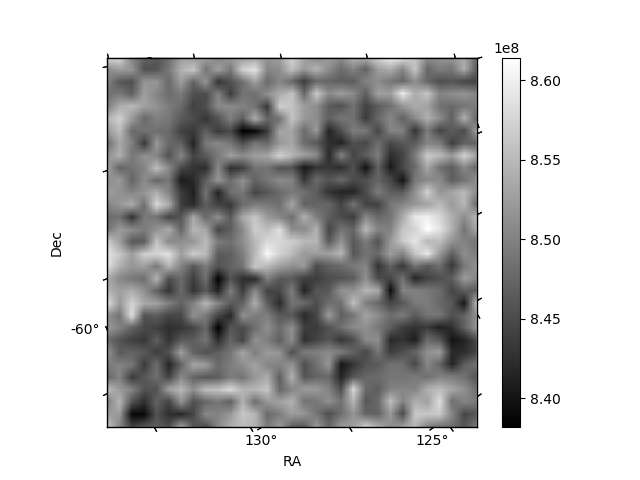
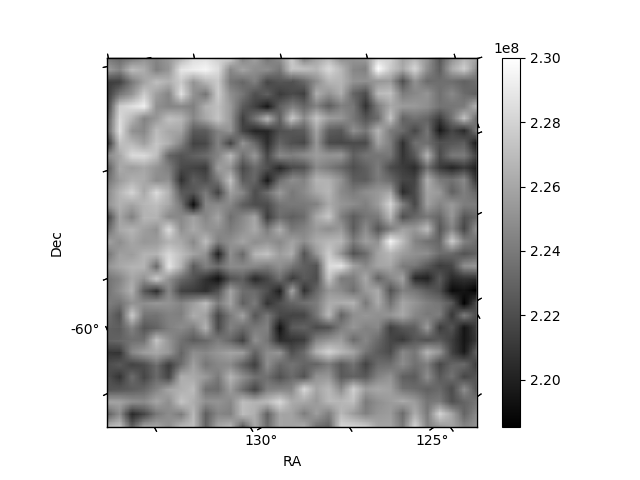
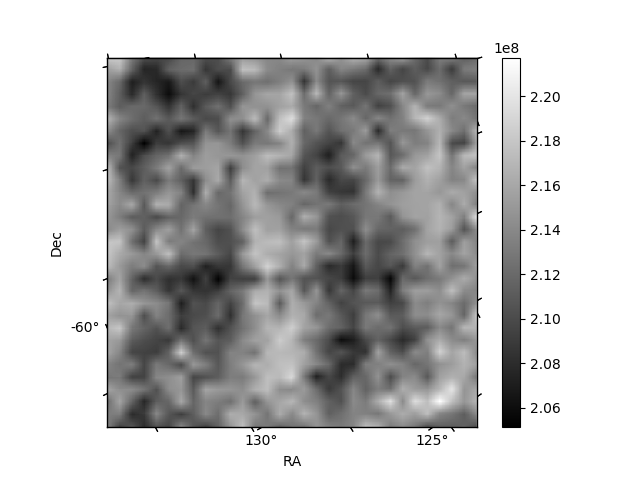
Histogram calculated using DETX and DETY for each event in the final _common_clean file
| Quadrant A | 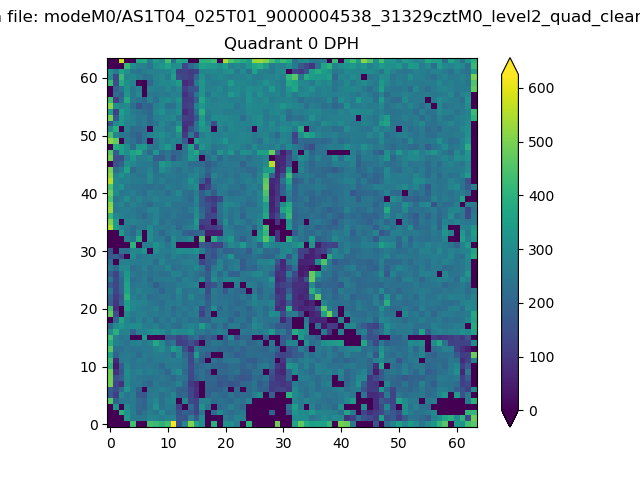 |
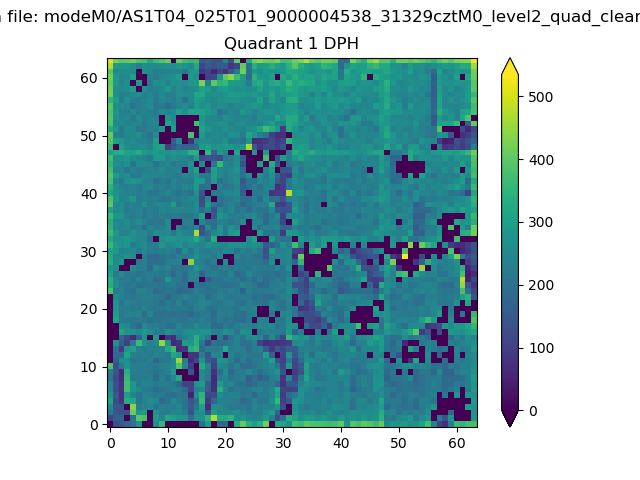 |
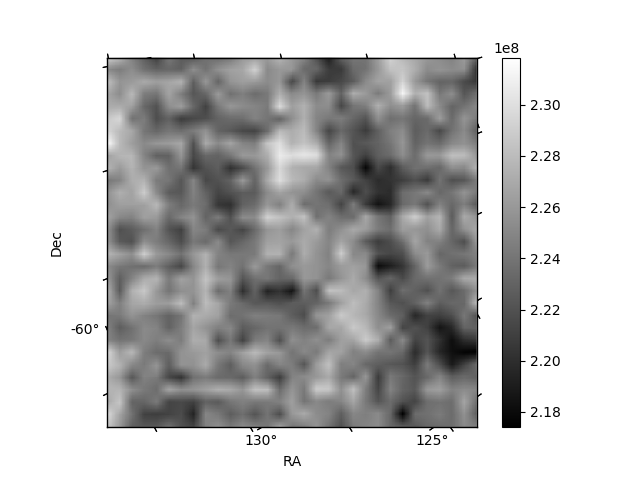
Quadrant B |
|---|---|---|---|
| Quadrant D | 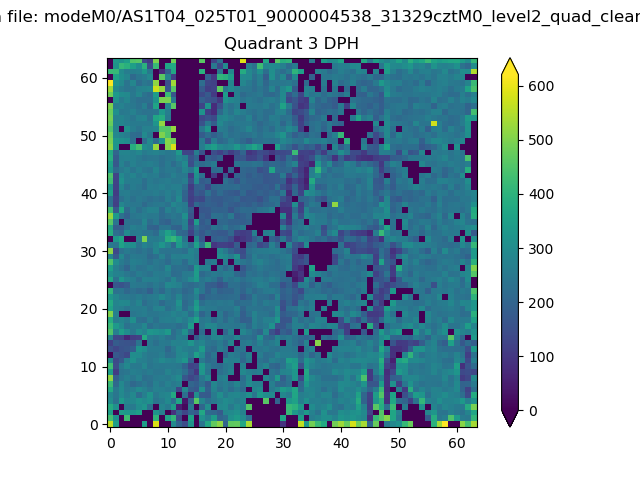 |
 |
Quadrant C |
| Plot type | Count rate plots | Images |
|---|---|---|
| Comparison with Poisson distribution Blue bars denote a histogram of data divided into 1 sec bins. Red curve is a Poisson curve with rate = median count rate of data. |
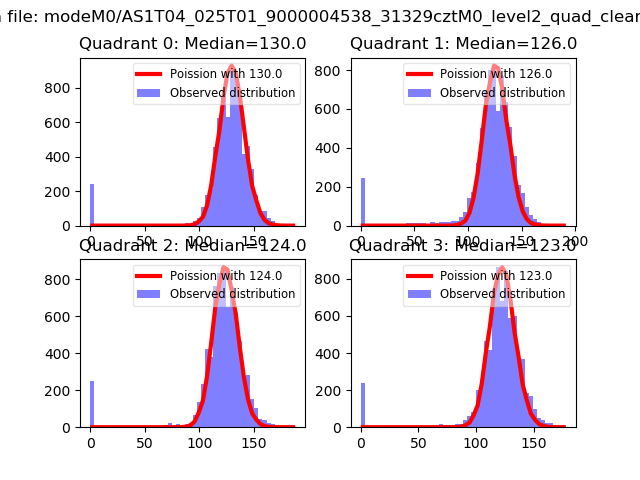 |
 |
| Quadrant-wise count rates Data is divided into 100 sec bins |
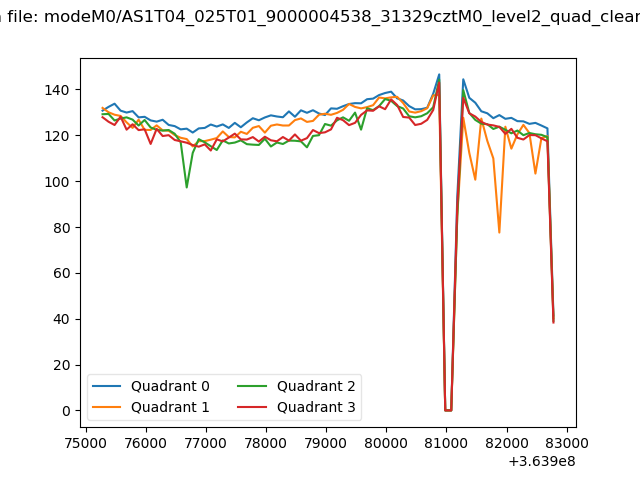 |
|
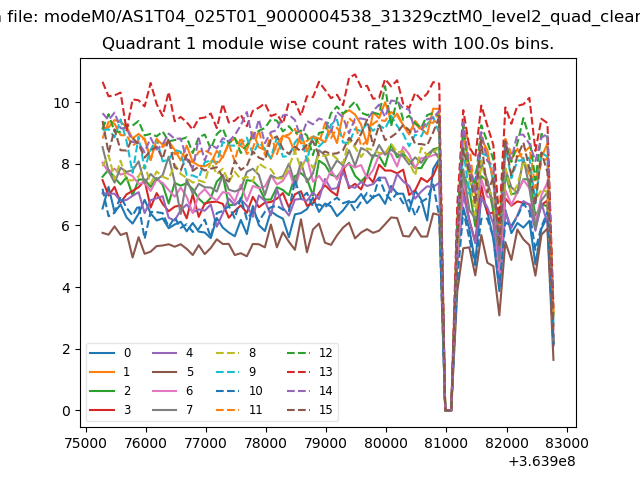
| Module-wise count rates for Quadrant A Data is divided into 100 sec bins |
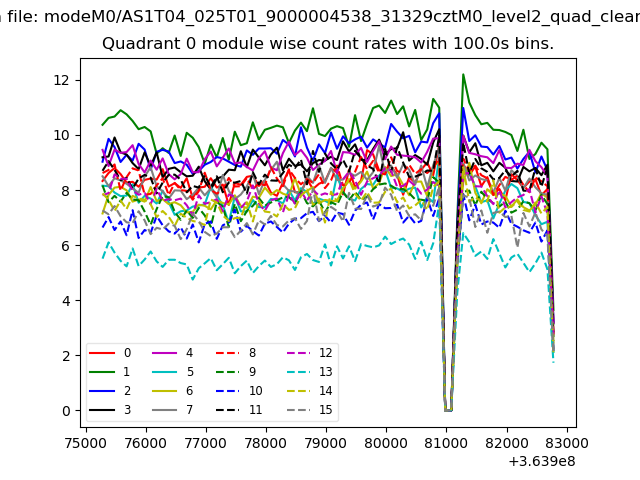 |
 |
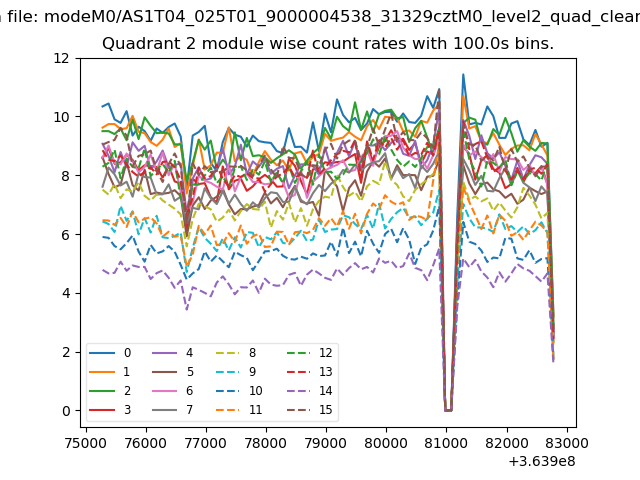
| Module-wise count rates for Quadrant B Data is divided into 100 sec bins |
 |
 |
| Module-wise count rates for Quadrant C Data is divided into 100 sec bins |
 |
 |
| Module-wise count rates for Quadrant D Data is divided into 100 sec bins |
 |
 |
| Parameter | Plot |
|---|---|
| CZT HV Monitor | 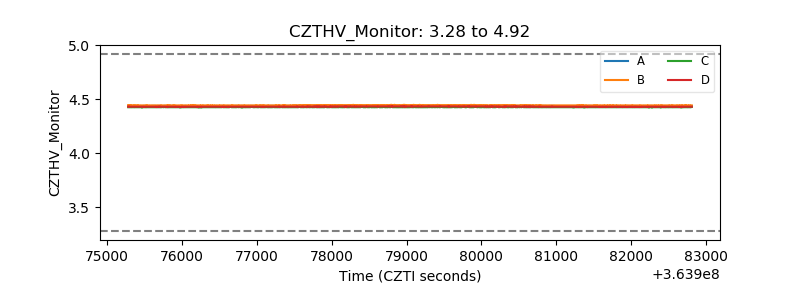 |
| D_VDD | 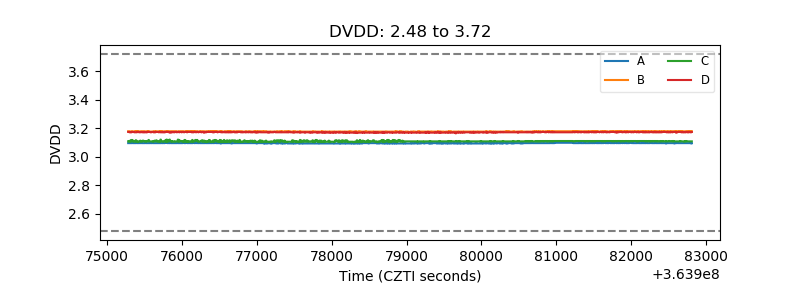 |
| Temperature 1 | 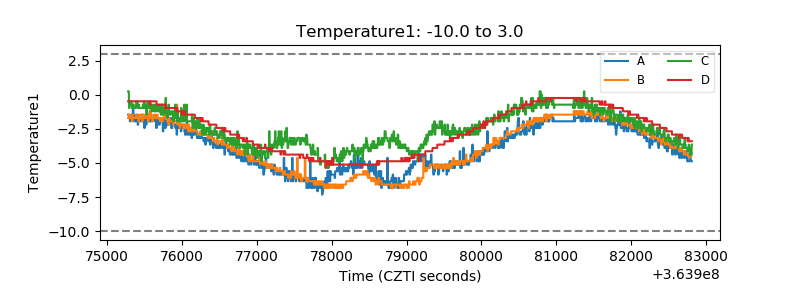 |
| Veto HV Monitor | 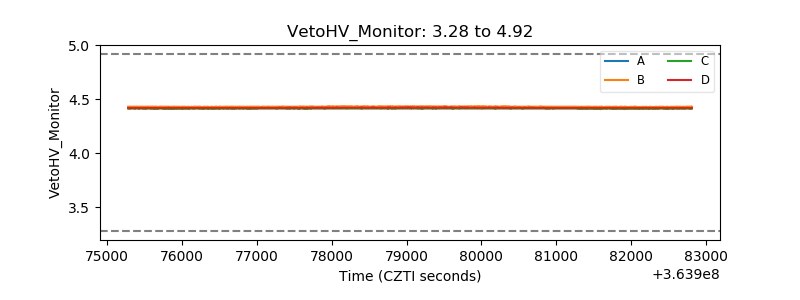 |
| Veto LLD | 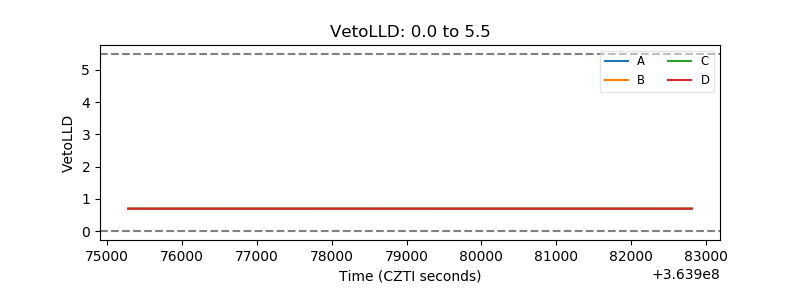 |
| Alpha Counter | 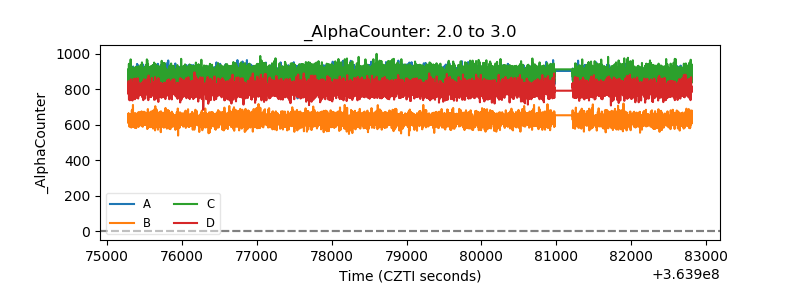 |
| _CPM_Rate | 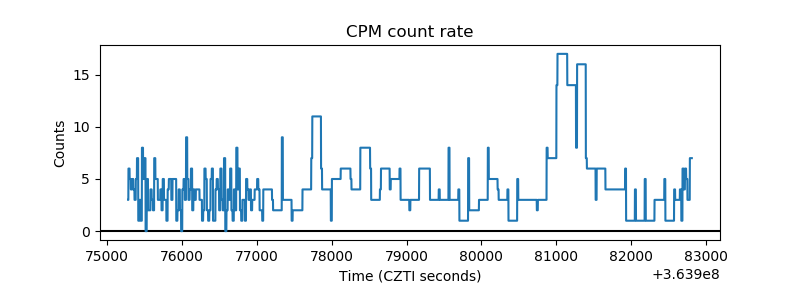 |
| CZT Counter | 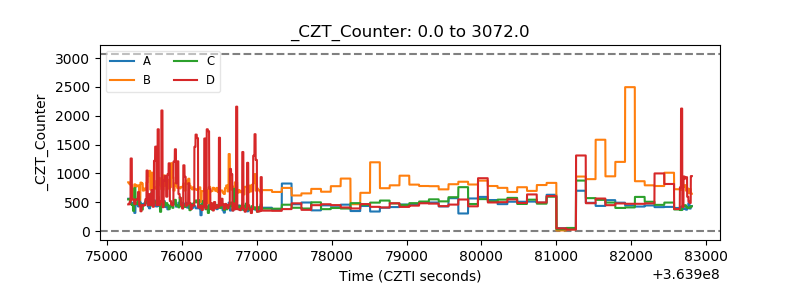 |
| +2.5 Volts monitor |  |
| +5 Volts monitor |  |
| _ROLL_ROT |  |
| _Roll_DEC | 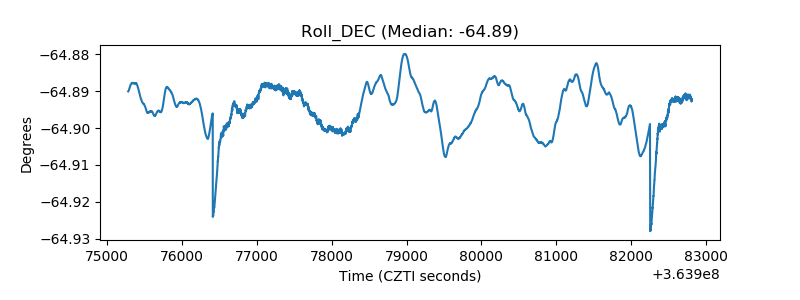 |
| _Roll_RA | 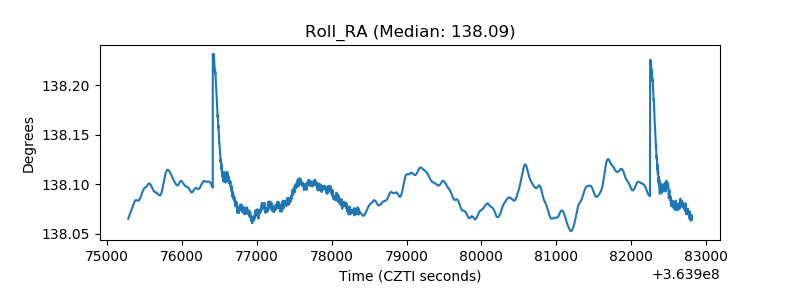 |
| Veto Counter | 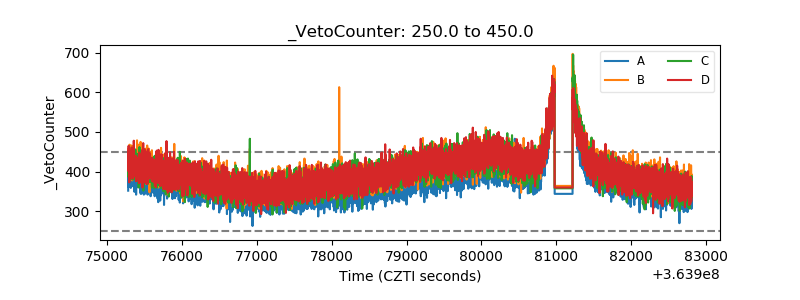 |