| Param | Original file | Final file |
|---|---|---|
| Filename | modeM0/AS1T04_025T01_9000004538_31330cztM0_level2.evt | modeM0/AS1T04_025T01_9000004538_31330cztM0_level2_quad_clean.evt |
| Size (bytes) | 567,509,760 | 130,363,200 |
| Size | 541.2 MB | 124.3 MB |
| Events in quadrant A | 3,191,327 | 897,520 |
| Events in quadrant B | 5,905,162 | 865,710 |
| Events in quadrant C | 3,450,793 | 851,515 |
| Events in quadrant D | 4,166,904 | 847,446 |
| Mode SS | |||
|---|---|---|---|
| Quadrant | BADHDUFLAG | Total packets | Discarded packets |
| A | 0 | 142 | 0 |
| B | 0 | 142 | 0 |
| C | 0 | 142 | 0 |
| D | 0 | 142 | 0 |
| Mode M0 | |||
|---|---|---|---|
| Quadrant | BADHDUFLAG | Total packets | Discarded packets |
| A | 0 | 14172 | 1 |
| B | 0 | 22718 | 1 |
| C | 0 | 14808 | 1 |
| D | 0 | 17108 | 1 |
| Mode M9 | |||
|---|---|---|---|
| Quadrant | BADHDUFLAG | Total packets | Discarded packets |
| A | 0 | 4 | 0 |
| B | 0 | 4 | 0 |
| C | 0 | 4 | 0 |
| D | 0 | 4 | 0 |
| Quadrant | Total seconds | Saturated seconds | Saturation percentage |
|---|---|---|---|
| A | 6976 | 35 | 0.501720% |
| B | 6976 | 312 | 4.472477% |
| C | 6977 | 151 | 2.164254% |
| D | 6977 | 129 | 1.848932% |
Noise dominated data is calculated using 1-second bins in cleaned event files. If a bin has >2000 counts, and if more than 50% of those come from <1% of pixels, then it is considered to be noise-dominated and hence unusable.
| Quadrant | # 1 sec bins | Bins with >0 counts | Bins with >2000 counts | High rate bins dominated by noise | Noise dominated (total time) | Noise dominated (detector-on time) | Marked lightcurve |
|---|---|---|---|---|---|---|---|
| A | 7381 | 6977 | 0 | 0 | 0.00% | 0.00% |  |
| B | 7381 | 6977 | 127 | 127 | 1.72% | 1.82% |  |
| C | 7382 | 6978 | 2 | 2 | 0.03% | 0.03% |  |
| D | 7382 | 6978 | 97 | 97 | 1.31% | 1.39% |  |
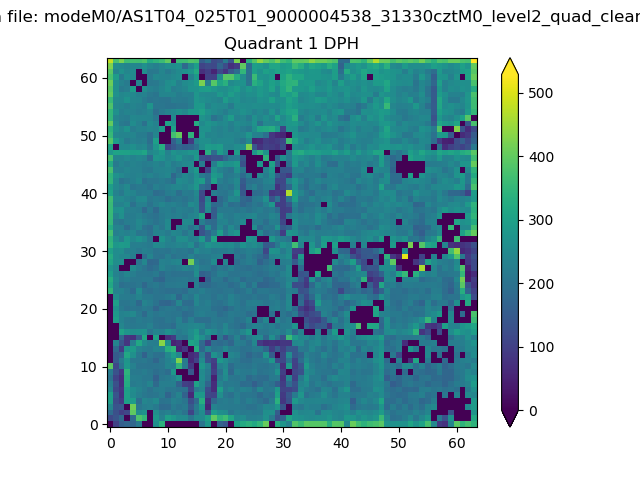
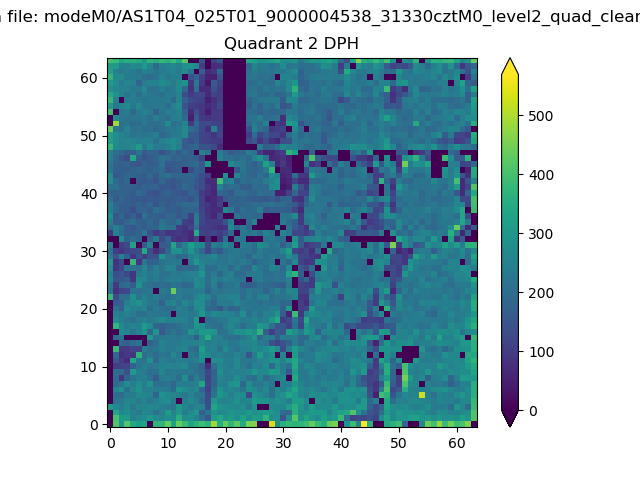
Top three noisy pixels from each quadrant. If the there are fewer than three noisy pixels in the level2.evt file, extra rows are filled as -1
| Pixel properties | Quadrant properties | ||||||
|---|---|---|---|---|---|---|---|
| Quadrant | DetID | PixID | Counts | Sigma | Mean | Median | Sigma |
| A | 13 | 254 | 14135 | 80.46 | 826 | 808 | 165.6 |
| A | 3 | 137 | 8430 | 46.02 | 826 | 808 | 165.6 |
| A | 0 | 226 | 6894 | 36.74 | 826 | 808 | 165.6 |
| B | 6 | 159 | 1993763 | 12921.07 | 800 | 780 | 154.2 |
| B | 5 | 172 | 442754 | 2865.44 | 800 | 780 | 154.2 |
| B | 4 | 80 | 142330 | 917.71 | 800 | 780 | 154.2 |
| C | 14 | 238 | 158817 | 870.6 | 777 | 781 | 181.5 |
| C | 3 | 233 | 148380 | 813.1 | 777 | 781 | 181.5 |
| C | 14 | 254 | 46791 | 253.46 | 777 | 781 | 181.5 |
| D | 8 | 195 | 694330 | 3685.45 | 791 | 770 | 188.2 |
| D | 12 | 233 | 363297 | 1926.4 | 791 | 770 | 188.2 |
| D | 13 | 249 | 60159 | 315.58 | 791 | 770 | 188.2 |
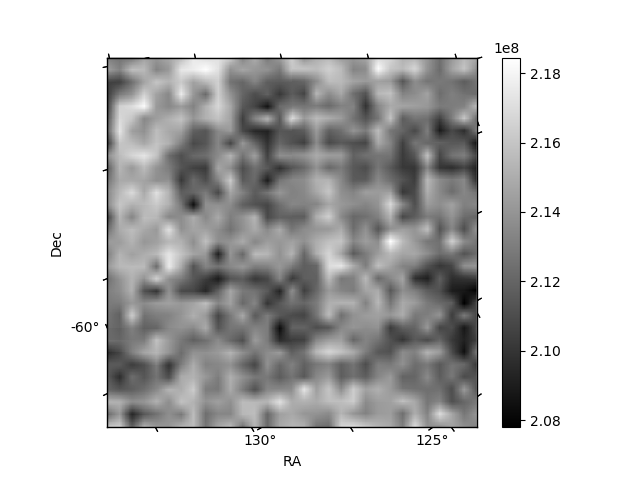
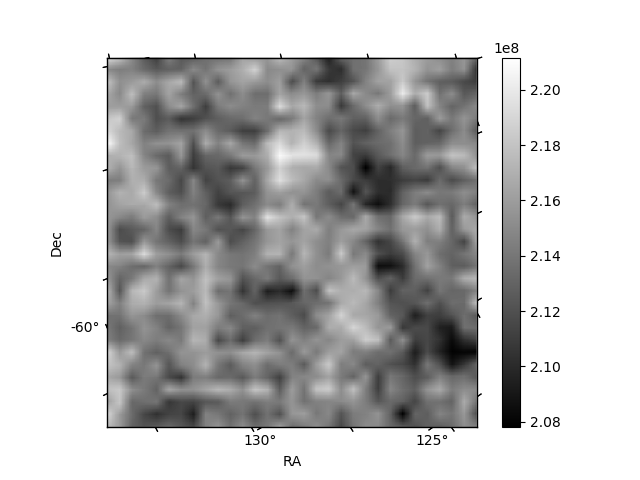
Histogram calculated using DETX and DETY for each event in the final _common_clean file
| Quadrant A | 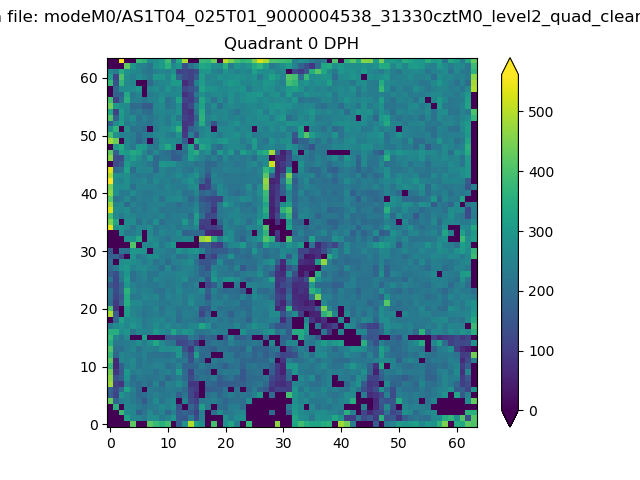 |
 |
Quadrant B |
|---|---|---|---|
| Quadrant D | 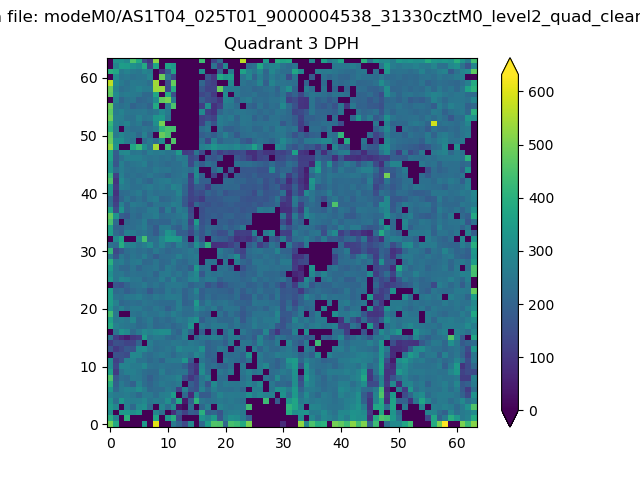 |
 |
Quadrant C |
| Plot type | Count rate plots | Images |
|---|---|---|
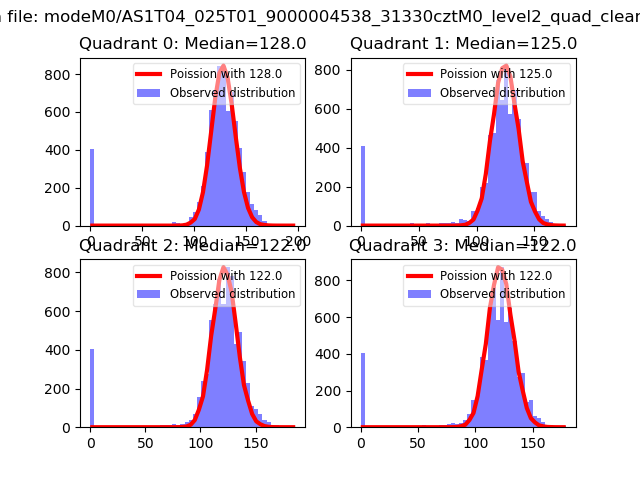
| Comparison with Poisson distribution Blue bars denote a histogram of data divided into 1 sec bins. Red curve is a Poisson curve with rate = median count rate of data. |
 |
 |
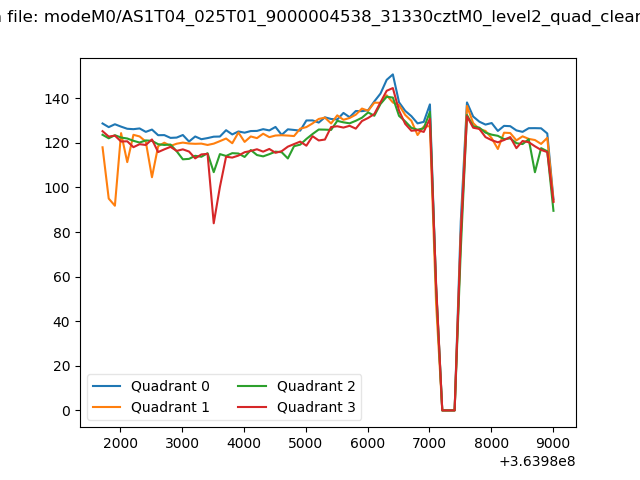
| Quadrant-wise count rates Data is divided into 100 sec bins |
 |
|
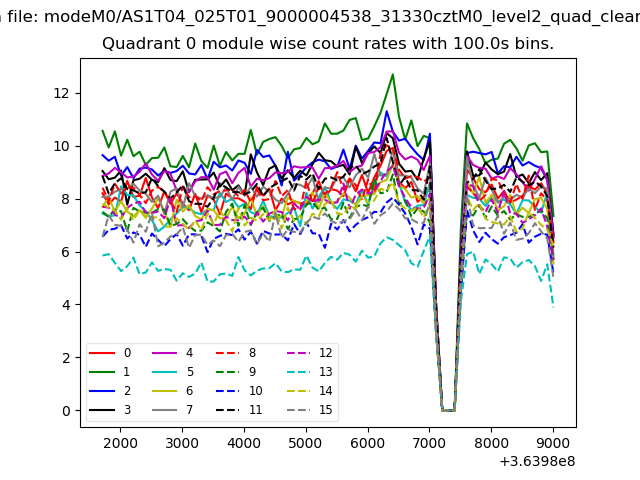
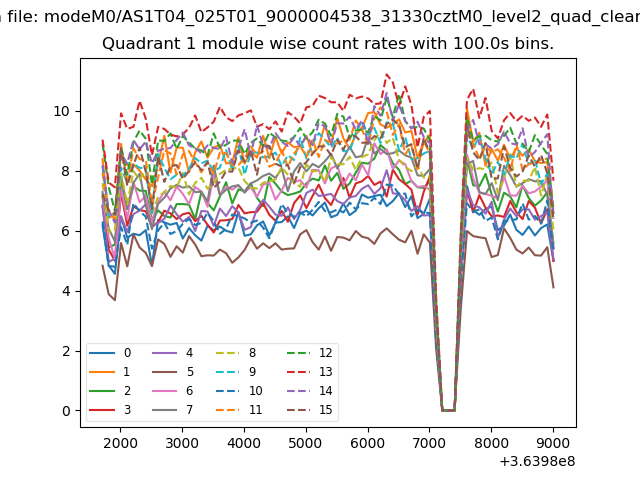
| Module-wise count rates for Quadrant A Data is divided into 100 sec bins |
 |
 |
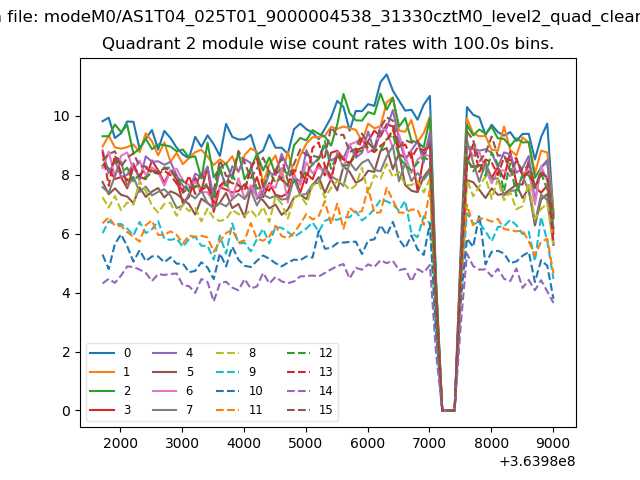
| Module-wise count rates for Quadrant B Data is divided into 100 sec bins |
 |
 |
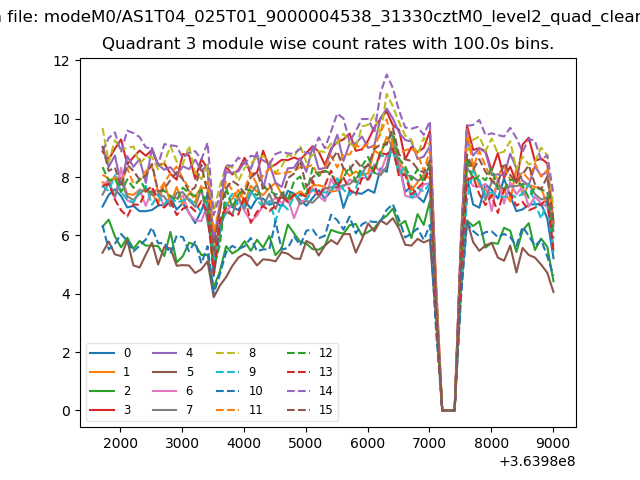
| Module-wise count rates for Quadrant C Data is divided into 100 sec bins |
 |
 |
| Module-wise count rates for Quadrant D Data is divided into 100 sec bins |
 |
 |
| Parameter | Plot |
|---|---|
| CZT HV Monitor | 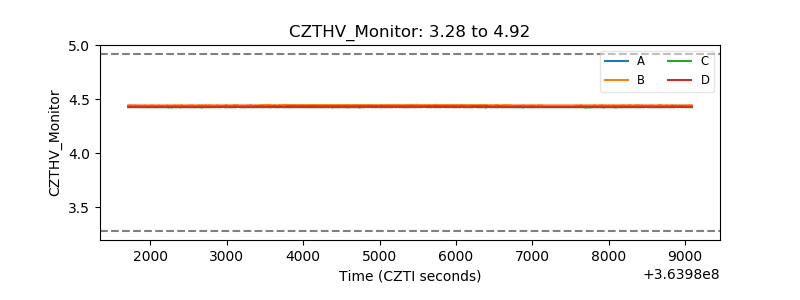 |
| D_VDD |  |
| Temperature 1 | 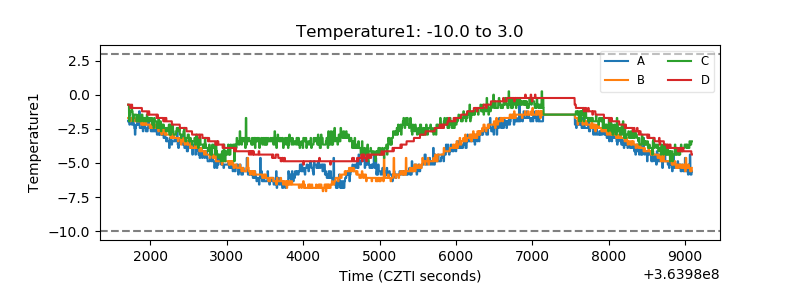 |
| Veto HV Monitor | 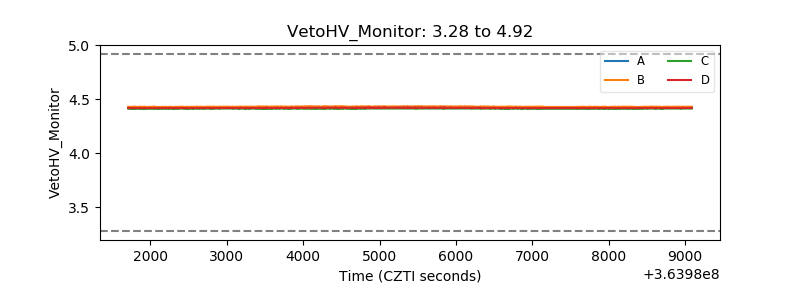 |
| Veto LLD | 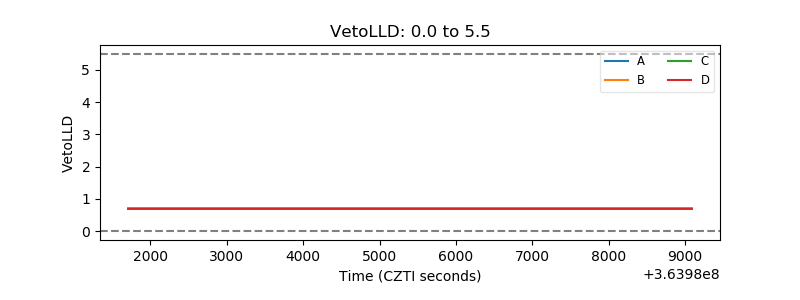 |
| Alpha Counter | 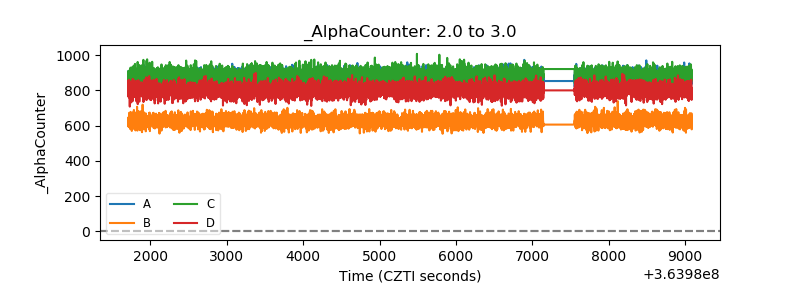 |
| _CPM_Rate | 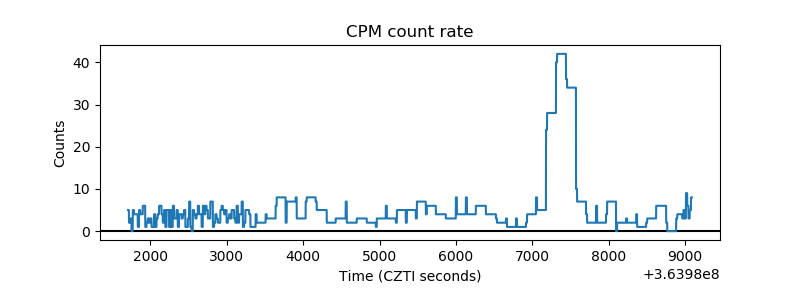 |
| CZT Counter | 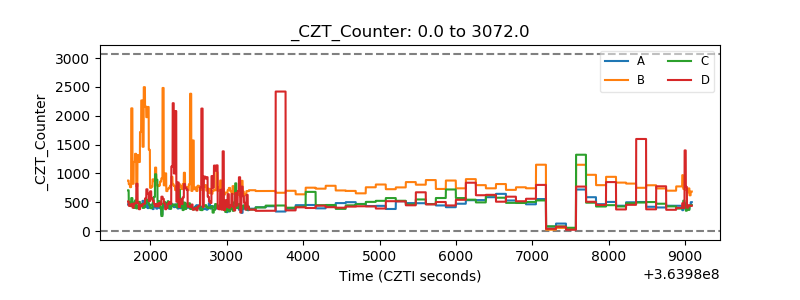 |
| +2.5 Volts monitor |  |
| +5 Volts monitor |  |
| _ROLL_ROT | 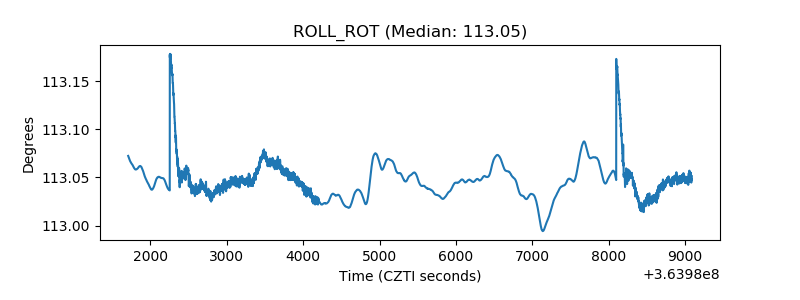 |
| _Roll_DEC | 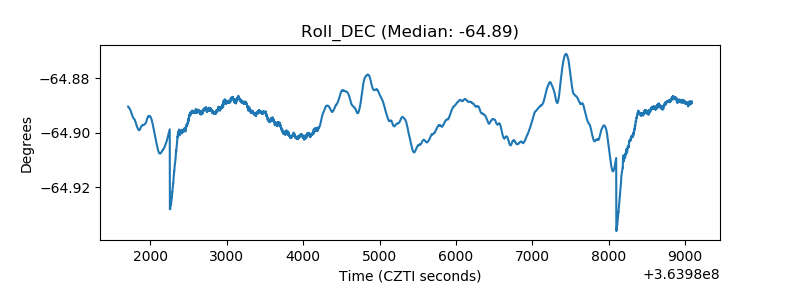 |
| _Roll_RA | 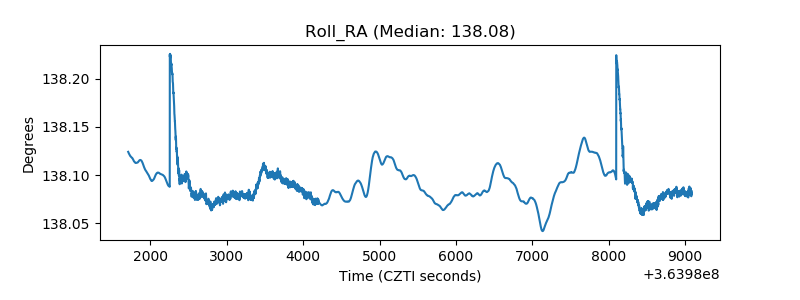 |
| Veto Counter | 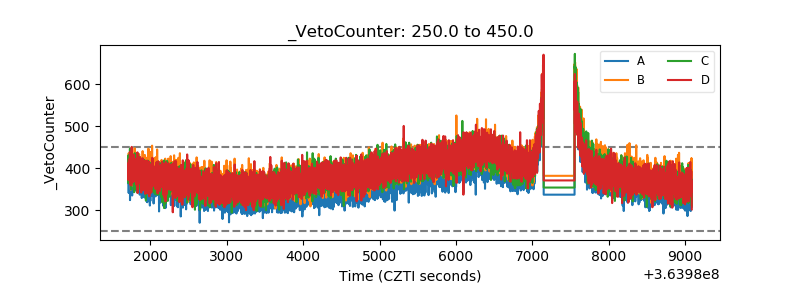 |