| Param | Original file | Final file |
|---|---|---|
| Filename | modeM0/AS1T04_025T01_9000004538_31333cztM0_level2.evt | modeM0/AS1T04_025T01_9000004538_31333cztM0_level2_quad_clean.evt |
| Size (bytes) | 572,304,960 | 131,258,880 |
| Size | 545.8 MB | 125.2 MB |
| Events in quadrant A | 3,217,977 | 903,611 |
| Events in quadrant B | 5,950,757 | 884,744 |
| Events in quadrant C | 3,724,343 | 858,610 |
| Events in quadrant D | 3,975,103 | 850,998 |
| Mode SS | |||
|---|---|---|---|
| Quadrant | BADHDUFLAG | Total packets | Discarded packets |
| A | 0 | 140 | 0 |
| B | 0 | 140 | 0 |
| C | 0 | 140 | 0 |
| D | 0 | 140 | 0 |
| Mode M0 | |||
|---|---|---|---|
| Quadrant | BADHDUFLAG | Total packets | Discarded packets |
| A | 0 | 14012 | 2 |
| B | 0 | 22591 | 2 |
| C | 0 | 15285 | 2 |
| D | 0 | 16314 | 2 |
| Mode M9 | |||
|---|---|---|---|
| Quadrant | BADHDUFLAG | Total packets | Discarded packets |
| A | 0 | 18 | 0 |
| B | 0 | 18 | 0 |
| C | 0 | 18 | 0 |
| D | 0 | 18 | 0 |
| Quadrant | Total seconds | Saturated seconds | Saturation percentage |
|---|---|---|---|
| A | 6857 | 47 | 0.685431% |
| B | 6857 | 277 | 4.039667% |
| C | 6857 | 214 | 3.120898% |
| D | 6857 | 118 | 1.720869% |
Noise dominated data is calculated using 1-second bins in cleaned event files. If a bin has >2000 counts, and if more than 50% of those come from <1% of pixels, then it is considered to be noise-dominated and hence unusable.
| Quadrant | # 1 sec bins | Bins with >0 counts | Bins with >2000 counts | High rate bins dominated by noise | Noise dominated (total time) | Noise dominated (detector-on time) | Marked lightcurve |
|---|---|---|---|---|---|---|---|
| A | 8572 | 6859 | 6 | 6 | 0.07% | 0.09% | 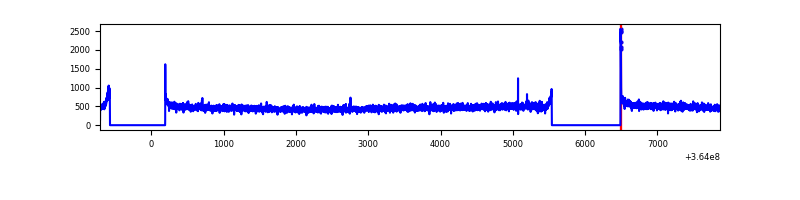 |
| B | 8572 | 6859 | 69 | 69 | 0.80% | 1.01% | 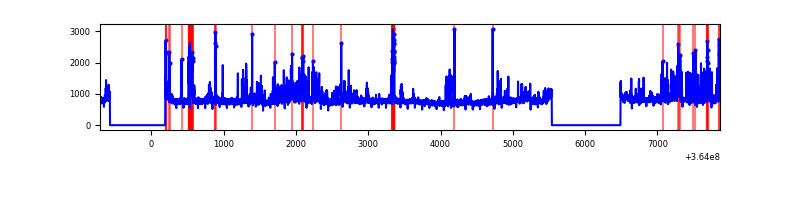 |
| C | 8572 | 6859 | 11 | 11 | 0.13% | 0.16% |  |
| D | 8572 | 6859 | 72 | 72 | 0.84% | 1.05% | 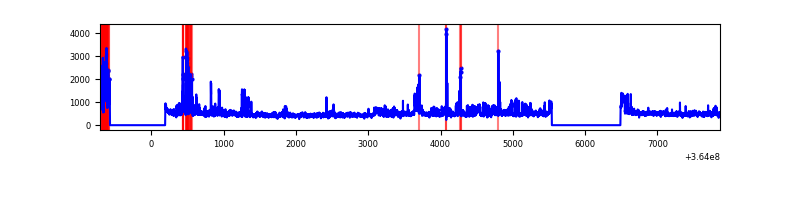 |
Top three noisy pixels from each quadrant. If the there are fewer than three noisy pixels in the level2.evt file, extra rows are filled as -1
| Pixel properties | Quadrant properties | ||||||
|---|---|---|---|---|---|---|---|
| Quadrant | DetID | PixID | Counts | Sigma | Mean | Median | Sigma |
| A | 8 | 192 | 17498 | 100.18 | 829 | 813 | 166.6 |
| A | 13 | 254 | 11828 | 66.13 | 829 | 813 | 166.6 |
| A | 3 | 137 | 8387 | 45.47 | 829 | 813 | 166.6 |
| B | 6 | 159 | 1970780 | 12481.47 | 813 | 789 | 157.8 |
| B | 4 | 80 | 698323 | 4419.44 | 813 | 789 | 157.8 |
| B | 0 | 190 | 54620 | 341.06 | 813 | 789 | 157.8 |
| C | 3 | 233 | 291621 | 1588.79 | 787 | 792 | 183.1 |
| C | 14 | 238 | 170330 | 926.18 | 787 | 792 | 183.1 |
| C | 0 | 10 | 111749 | 606.16 | 787 | 792 | 183.1 |
| D | 8 | 195 | 612767 | 3233.3 | 797 | 774 | 189.3 |
| D | 12 | 233 | 228354 | 1202.36 | 797 | 774 | 189.3 |
| D | 12 | 79 | 44053 | 228.65 | 797 | 774 | 189.3 |
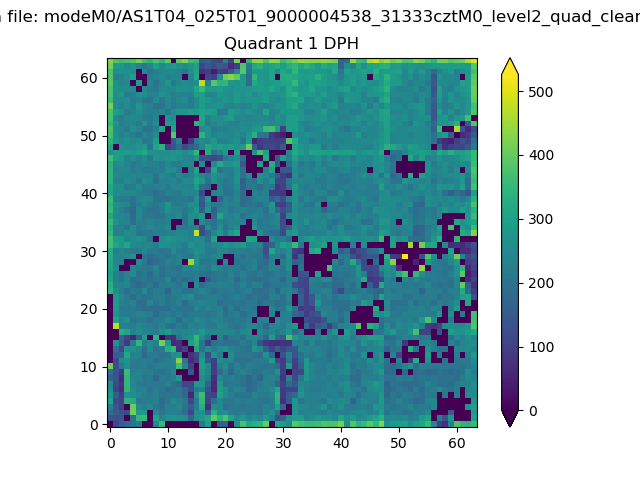
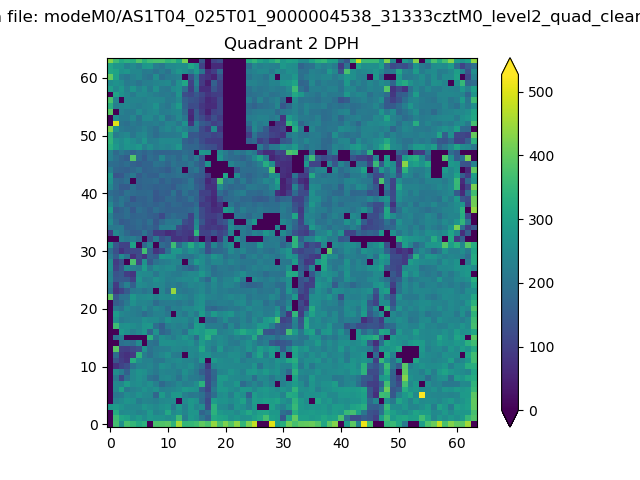
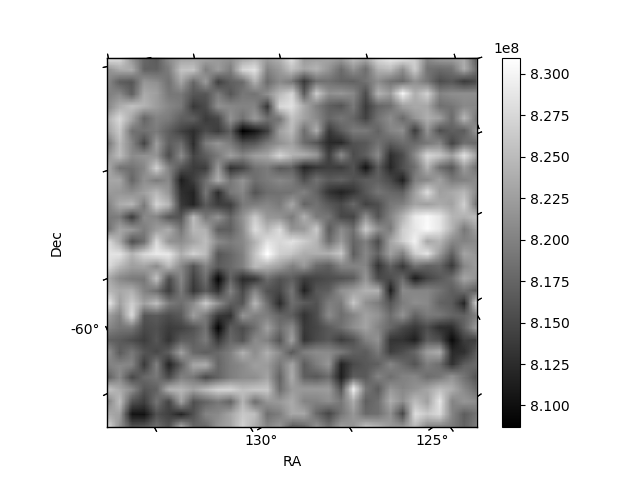
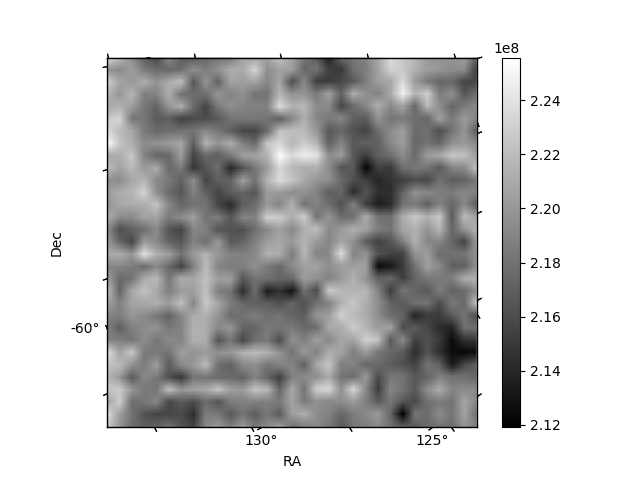
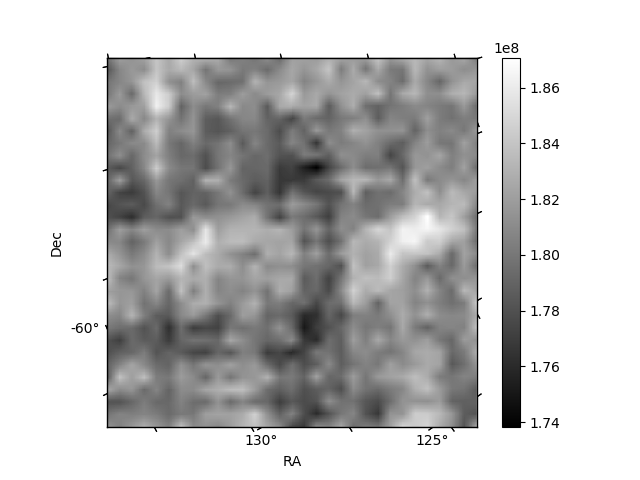
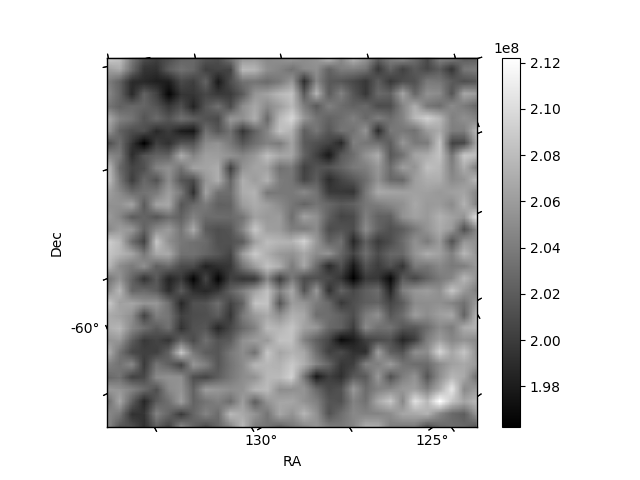
Histogram calculated using DETX and DETY for each event in the final _common_clean file
| Quadrant A | 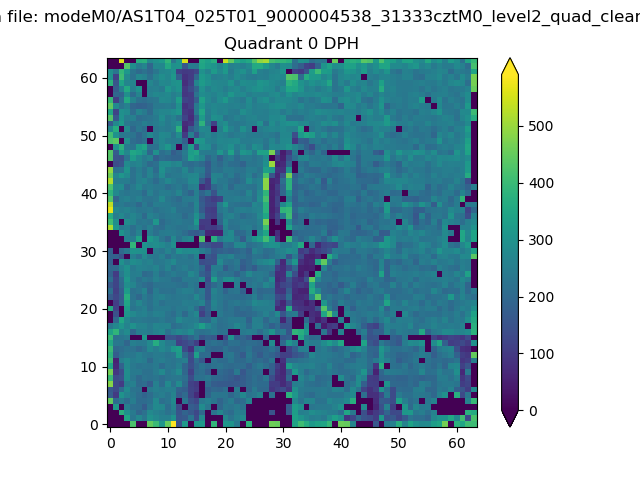 |
 |
Quadrant B |
|---|---|---|---|
| Quadrant D | 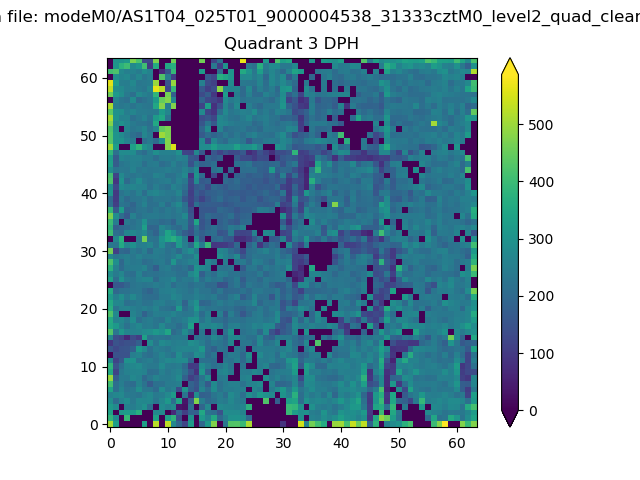 |
 |
Quadrant C |
| Plot type | Count rate plots | Images |
|---|---|---|
| Comparison with Poisson distribution Blue bars denote a histogram of data divided into 1 sec bins. Red curve is a Poisson curve with rate = median count rate of data. |
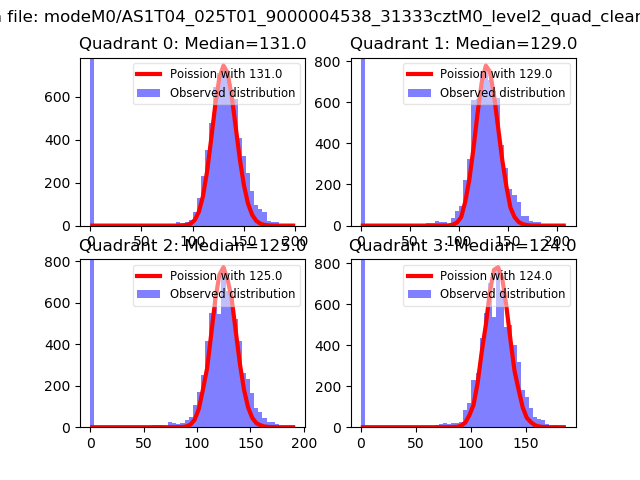 |
 |
| Quadrant-wise count rates Data is divided into 100 sec bins |
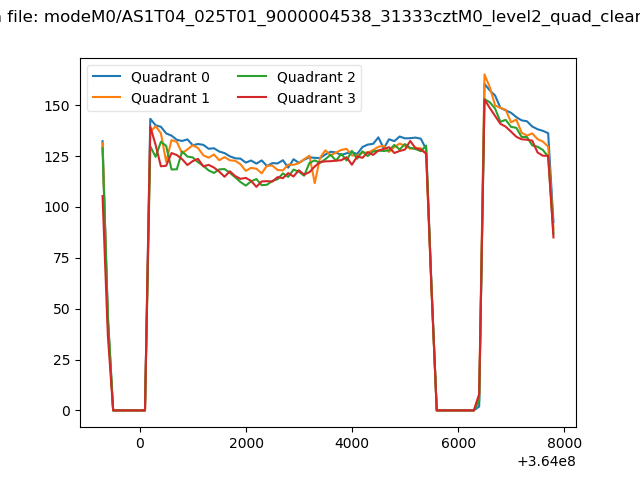 |
|
| Module-wise count rates for Quadrant A Data is divided into 100 sec bins |
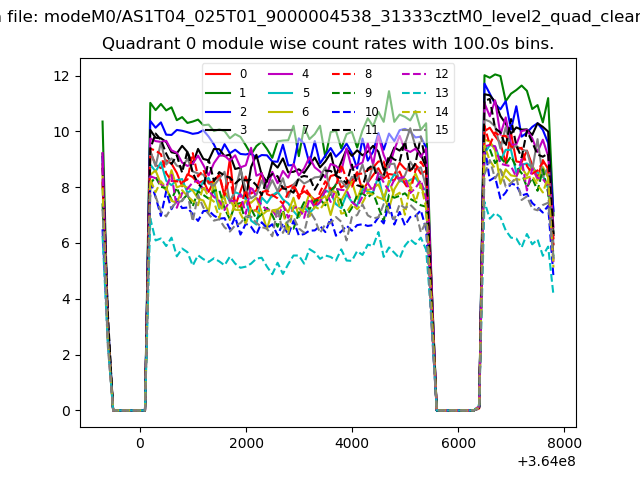 |
 |
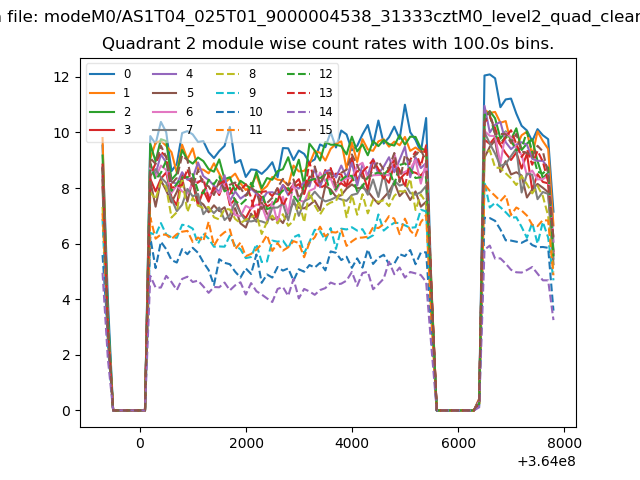
| Module-wise count rates for Quadrant B Data is divided into 100 sec bins |
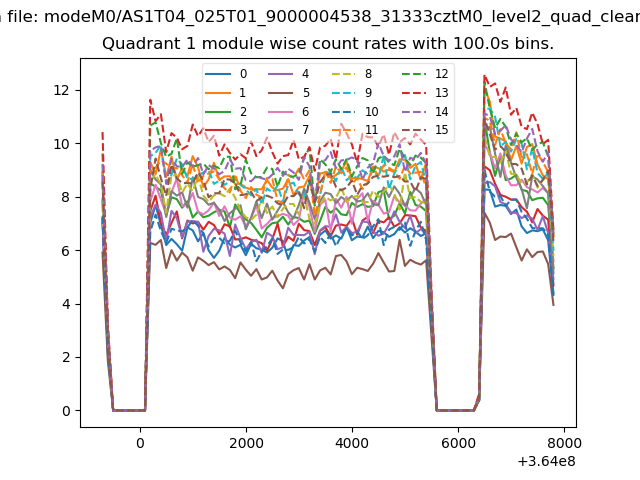 |
 |
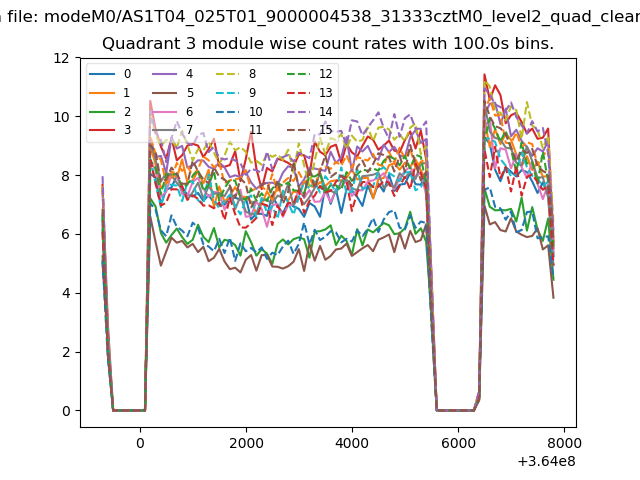
| Module-wise count rates for Quadrant C Data is divided into 100 sec bins |
 |
 |
| Module-wise count rates for Quadrant D Data is divided into 100 sec bins |
 |
 |
| Parameter | Plot |
|---|---|
| CZT HV Monitor | 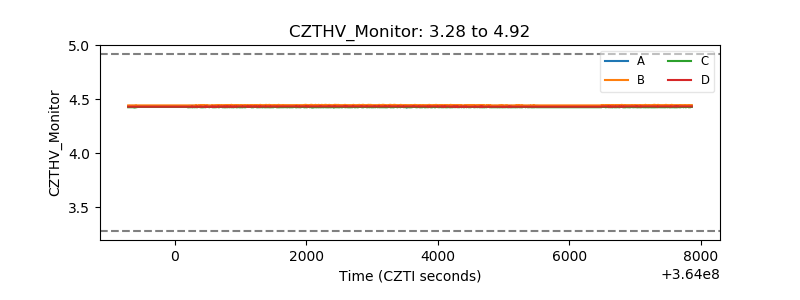 |
| D_VDD | 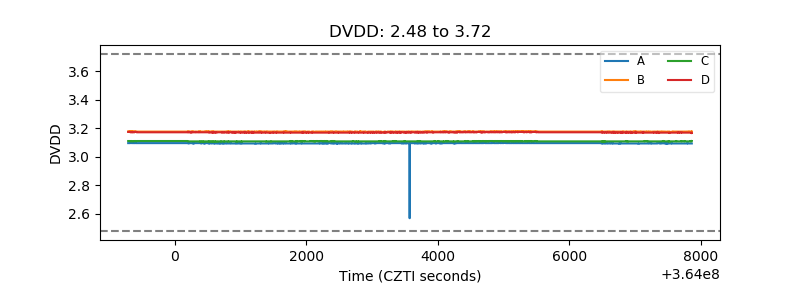 |
| Temperature 1 | 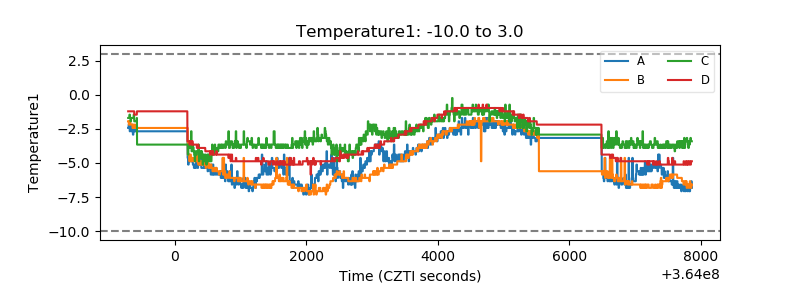 |
| Veto HV Monitor | 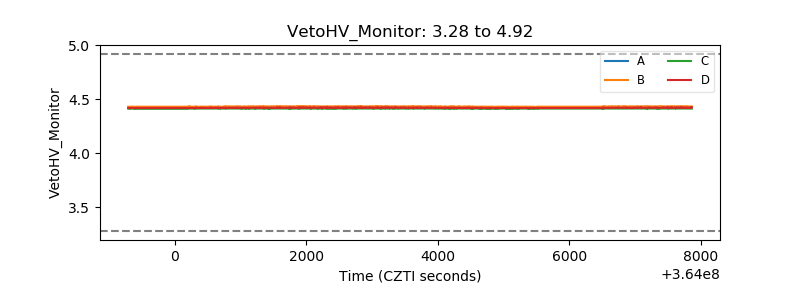 |
| Veto LLD | 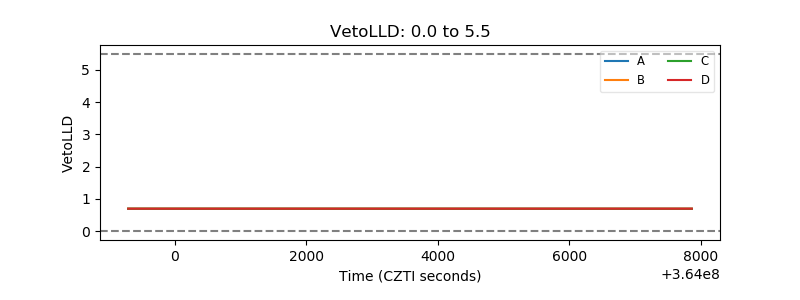 |
| Alpha Counter | 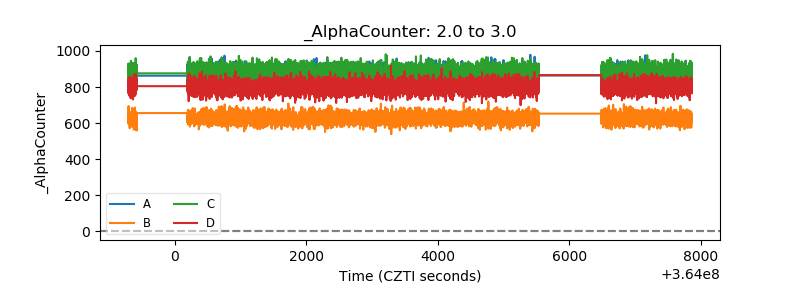 |
| _CPM_Rate | 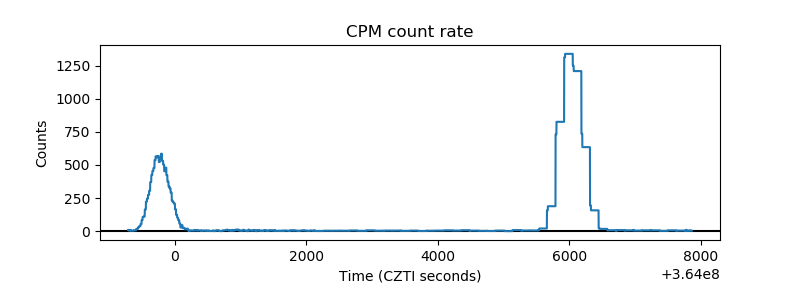 |
| CZT Counter | 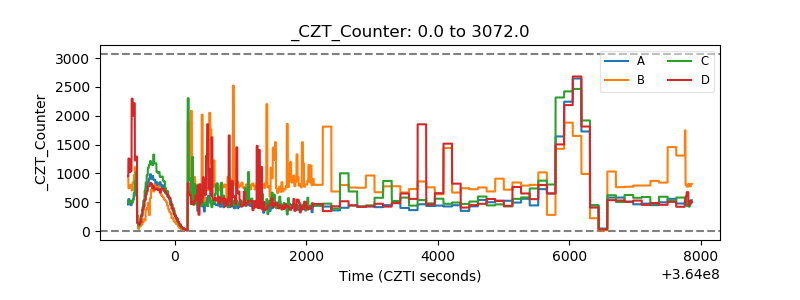 |
| +2.5 Volts monitor | 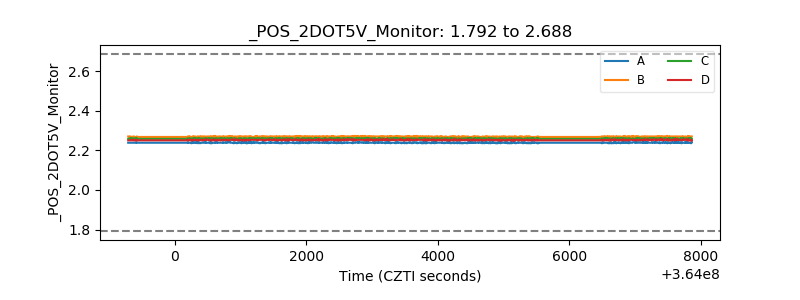 |
| +5 Volts monitor |  |
| _ROLL_ROT | 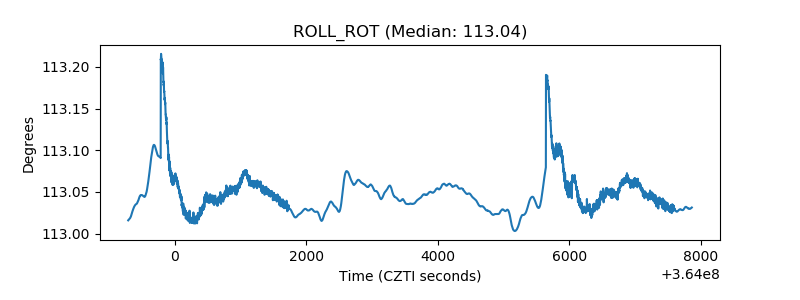 |
| _Roll_DEC | 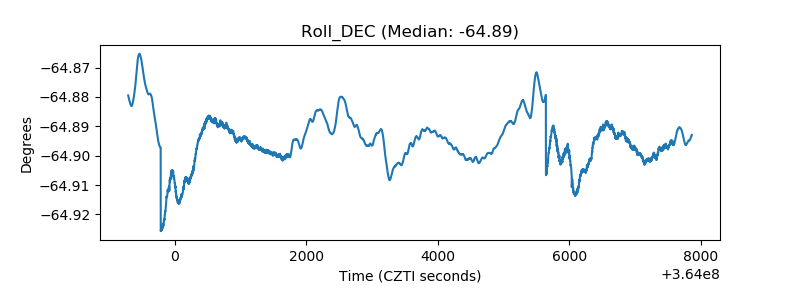 |
| _Roll_RA | 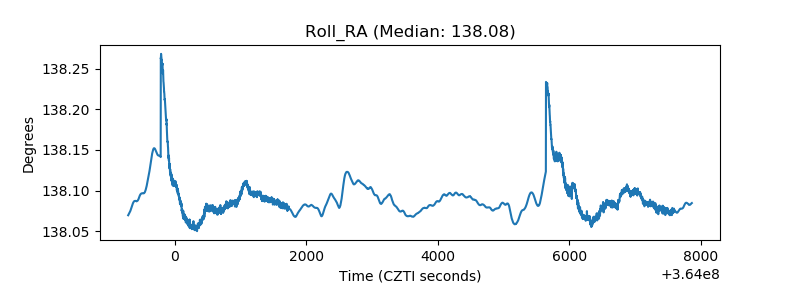 |
| Veto Counter | 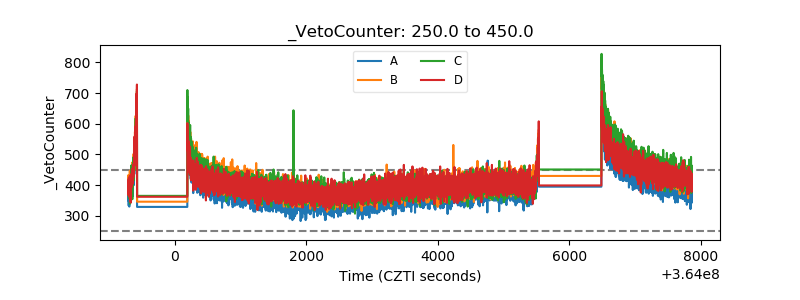 |