| Param | Original file | Final file |
|---|---|---|
| Filename | modeM0/AS1T04_025T01_9000004538_31338cztM0_level2.evt | modeM0/AS1T04_025T01_9000004538_31338cztM0_level2_quad_clean.evt |
| Size (bytes) | 527,345,280 | 134,792,640 |
| Size | 502.9 MB | 128.5 MB |
| Events in quadrant A | 3,093,040 | 952,444 |
| Events in quadrant B | 4,770,779 | 940,180 |
| Events in quadrant C | 3,693,498 | 879,741 |
| Events in quadrant D | 4,022,075 | 906,460 |
| Mode SS | |||
|---|---|---|---|
| Quadrant | BADHDUFLAG | Total packets | Discarded packets |
| A | 0 | 118 | 0 |
| B | 0 | 118 | 0 |
| C | 0 | 118 | 0 |
| D | 0 | 118 | 0 |
| Mode M0 | |||
|---|---|---|---|
| Quadrant | BADHDUFLAG | Total packets | Discarded packets |
| A | 0 | 12732 | 1 |
| B | 0 | 18056 | 1 |
| C | 0 | 14995 | 1 |
| D | 0 | 16017 | 1 |
| Mode M9 | |||
|---|---|---|---|
| Quadrant | BADHDUFLAG | Total packets | Discarded packets |
| A | 0 | 13 | 0 |
| B | 0 | 13 | 0 |
| C | 0 | 13 | 0 |
| D | 0 | 13 | 0 |
| Quadrant | Total seconds | Saturated seconds | Saturation percentage |
|---|---|---|---|
| A | 5775 | 61 | 1.056277% |
| B | 5775 | 110 | 1.904762% |
| C | 5776 | 519 | 8.985457% |
| D | 5776 | 109 | 1.887119% |
Noise dominated data is calculated using 1-second bins in cleaned event files. If a bin has >2000 counts, and if more than 50% of those come from <1% of pixels, then it is considered to be noise-dominated and hence unusable.
| Quadrant | # 1 sec bins | Bins with >0 counts | Bins with >2000 counts | High rate bins dominated by noise | Noise dominated (total time) | Noise dominated (detector-on time) | Marked lightcurve |
|---|---|---|---|---|---|---|---|
| A | 7110 | 5776 | 0 | 0 | 0.00% | 0.00% |  |
| B | 7110 | 5776 | 4 | 4 | 0.06% | 0.07% | 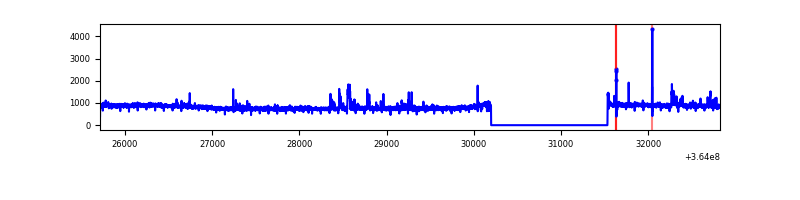 |
| C | 7111 | 5777 | 14 | 14 | 0.20% | 0.24% | 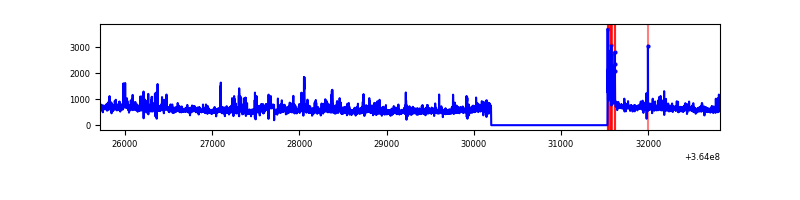 |
| D | 7111 | 5777 | 38 | 38 | 0.53% | 0.66% | 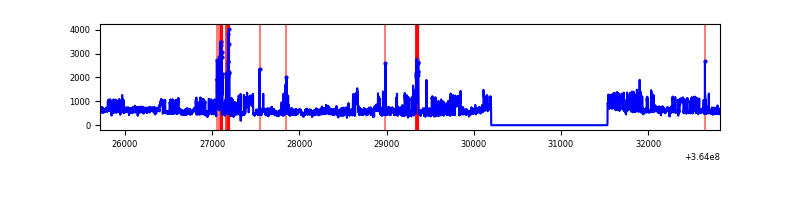 |
Top three noisy pixels from each quadrant. If the there are fewer than three noisy pixels in the level2.evt file, extra rows are filled as -1
| Pixel properties | Quadrant properties | ||||||
|---|---|---|---|---|---|---|---|
| Quadrant | DetID | PixID | Counts | Sigma | Mean | Median | Sigma |
| A | 13 | 254 | 11734 | 70.12 | 801 | 789 | 156.1 |
| A | 3 | 137 | 7041 | 40.05 | 801 | 789 | 156.1 |
| A | 0 | 226 | 6746 | 38.16 | 801 | 789 | 156.1 |
| B | 6 | 159 | 1571002 | 10962.86 | 776 | 759 | 143.2 |
| B | 4 | 80 | 87232 | 603.72 | 776 | 759 | 143.2 |
| B | 0 | 190 | 52934 | 364.27 | 776 | 759 | 143.2 |
| C | 3 | 233 | 243131 | 1442.31 | 738 | 746 | 168.1 |
| C | 14 | 238 | 219067 | 1299.12 | 738 | 746 | 168.1 |
| C | 14 | 254 | 138914 | 822.17 | 738 | 746 | 168.1 |
| D | 8 | 195 | 864986 | 4757.46 | 783 | 765 | 181.7 |
| D | 2 | 250 | 109921 | 600.89 | 783 | 765 | 181.7 |
| D | 12 | 79 | 49951 | 270.76 | 783 | 765 | 181.7 |
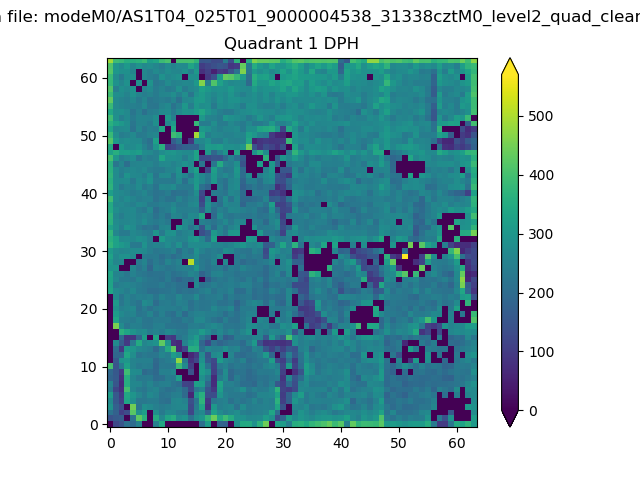
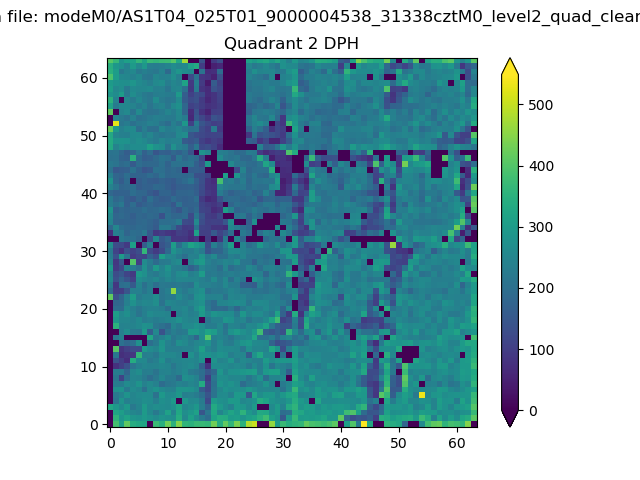
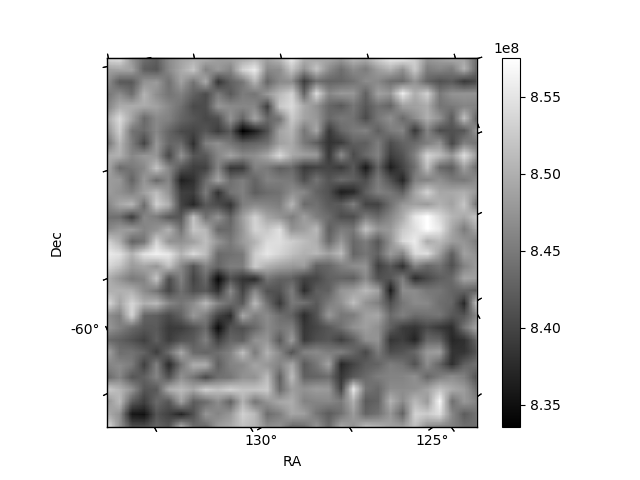
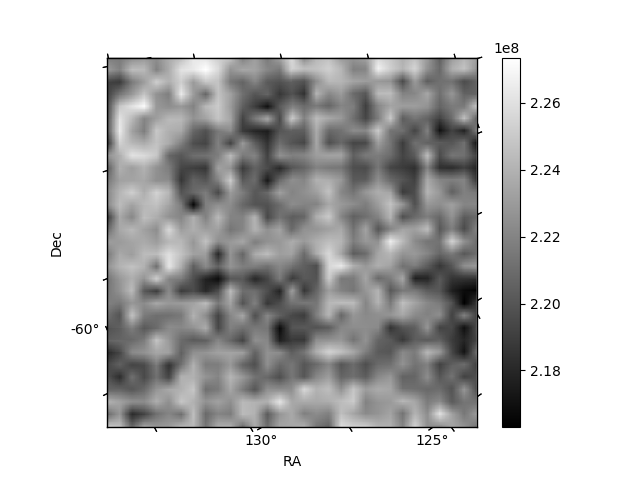
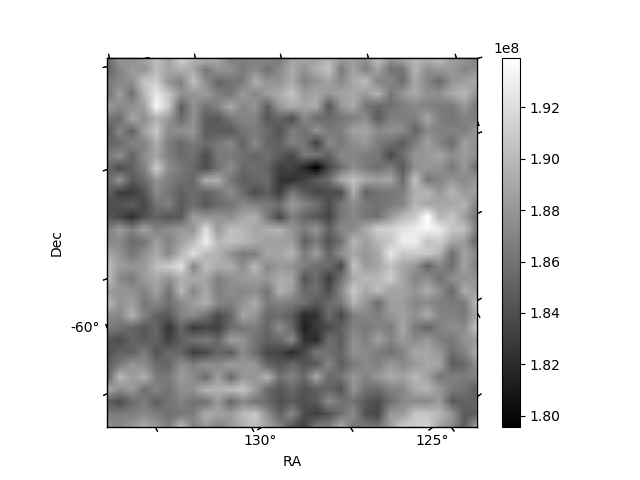
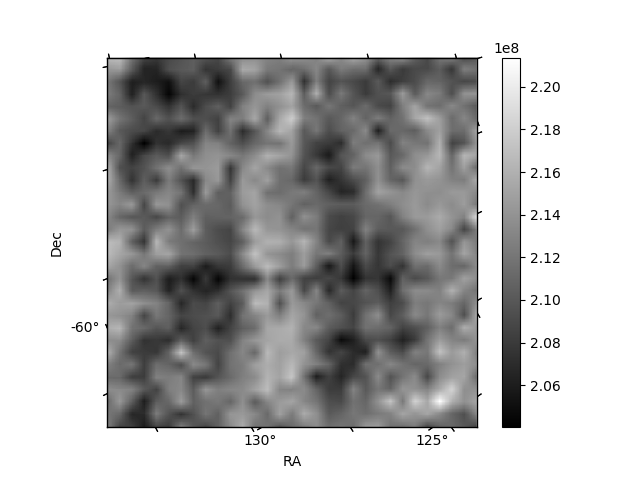
Histogram calculated using DETX and DETY for each event in the final _common_clean file
| Quadrant A | 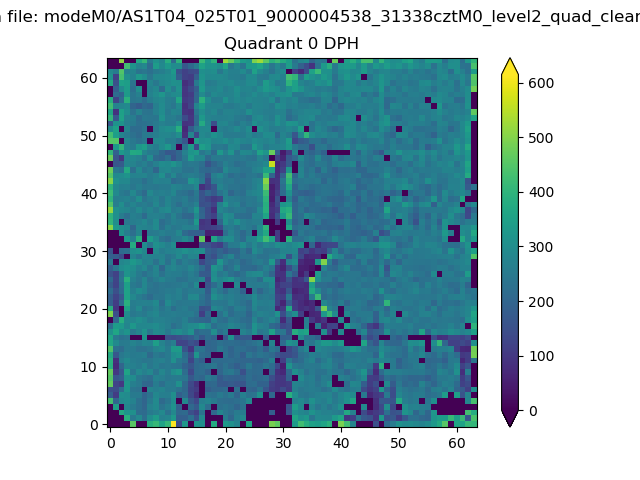 |
 |
Quadrant B |
|---|---|---|---|
| Quadrant D | 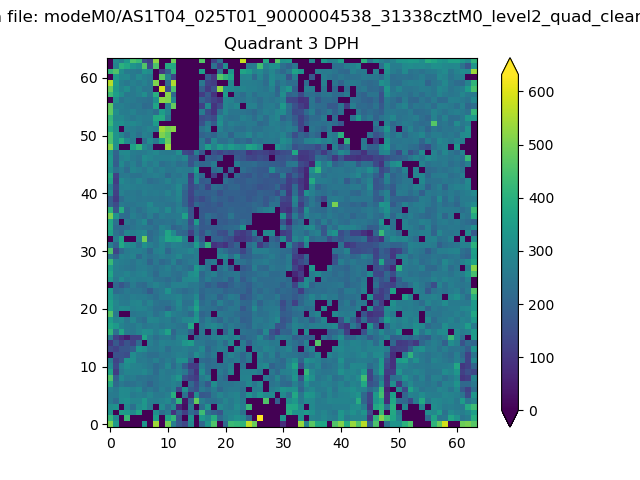 |
 |
Quadrant C |
| Plot type | Count rate plots | Images |
|---|---|---|
| Comparison with Poisson distribution Blue bars denote a histogram of data divided into 1 sec bins. Red curve is a Poisson curve with rate = median count rate of data. |
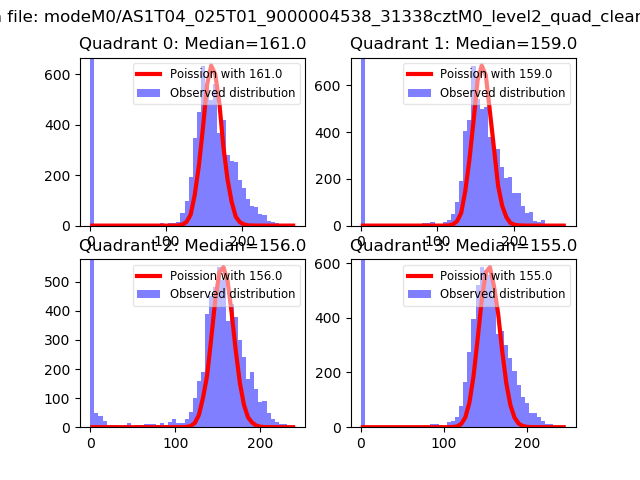 |
 |
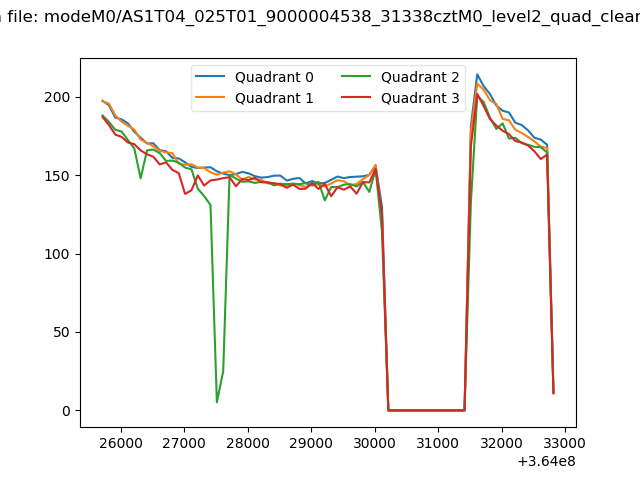
| Quadrant-wise count rates Data is divided into 100 sec bins |
 |
|
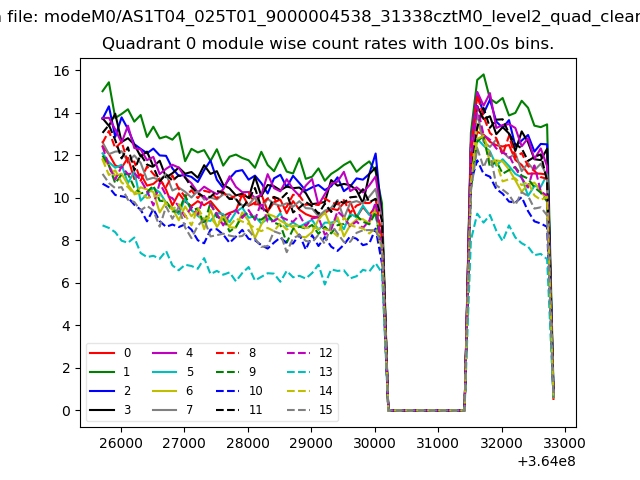
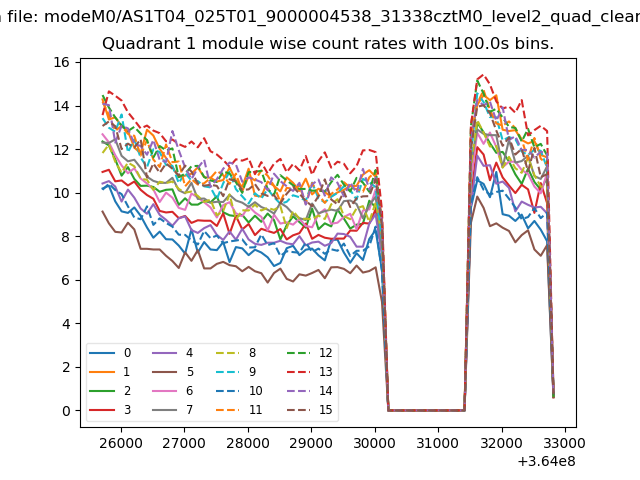
| Module-wise count rates for Quadrant A Data is divided into 100 sec bins |
 |
 |
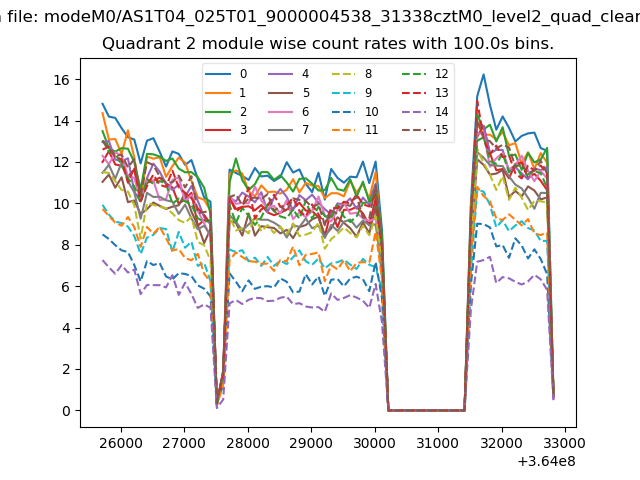
| Module-wise count rates for Quadrant B Data is divided into 100 sec bins |
 |
 |
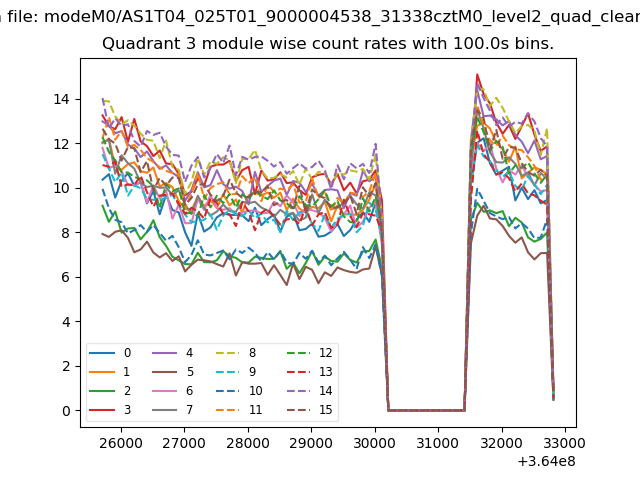
| Module-wise count rates for Quadrant C Data is divided into 100 sec bins |
 |
 |
| Module-wise count rates for Quadrant D Data is divided into 100 sec bins |
 |
 |
| Parameter | Plot |
|---|---|
| CZT HV Monitor | 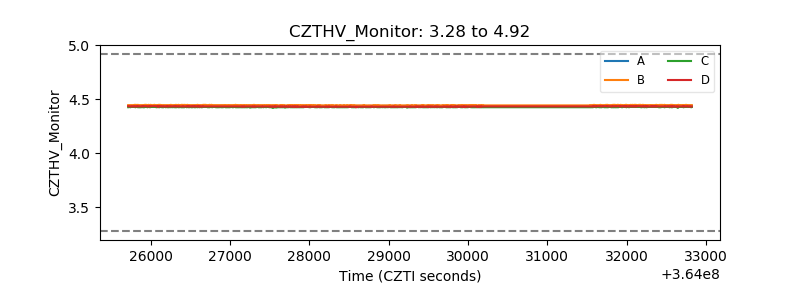 |
| D_VDD |  |
| Temperature 1 |  |
| Veto HV Monitor | 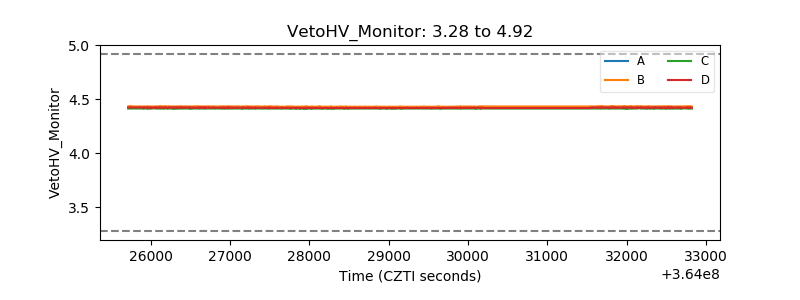 |
| Veto LLD | 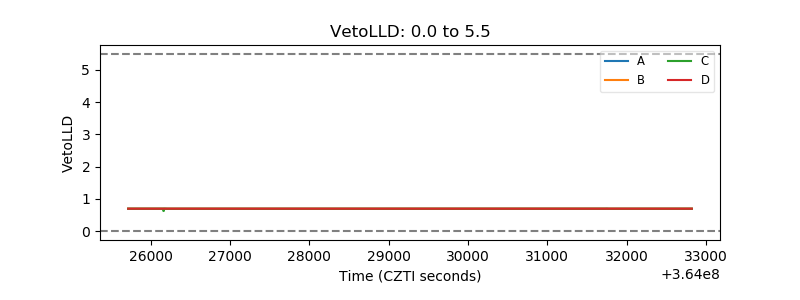 |
| Alpha Counter | 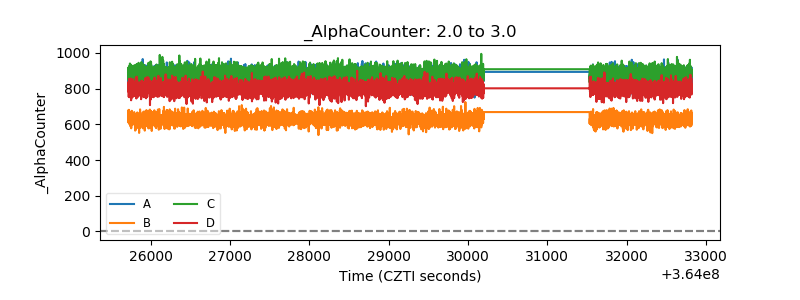 |
| _CPM_Rate | 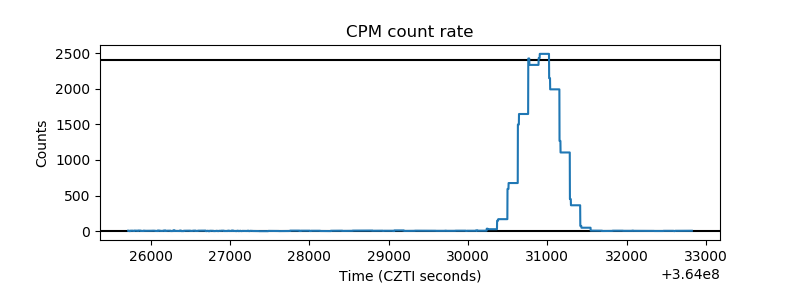 |
| CZT Counter | 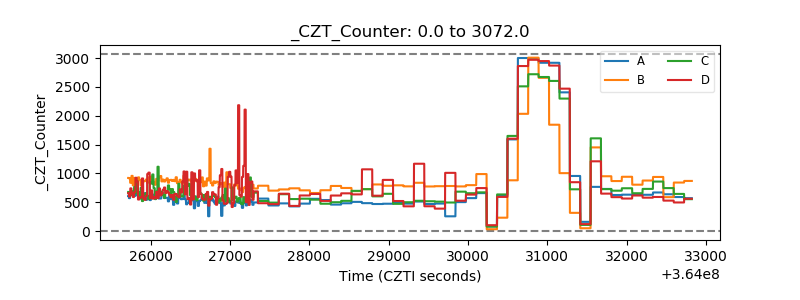 |
| +2.5 Volts monitor | 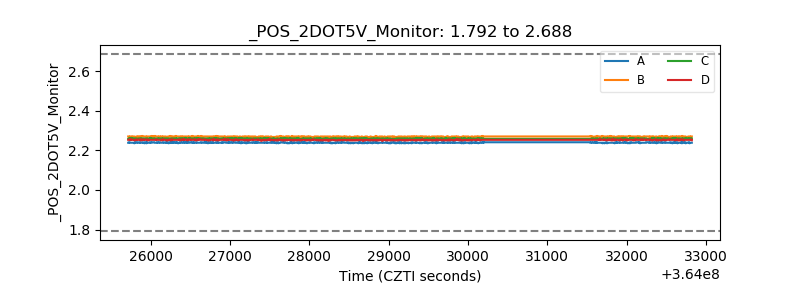 |
| +5 Volts monitor |  |
| _ROLL_ROT | 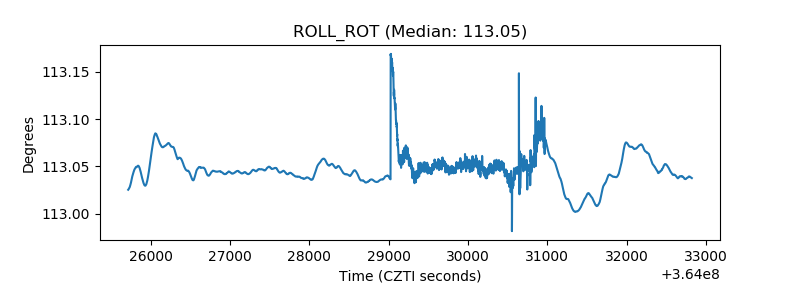 |
| _Roll_DEC | 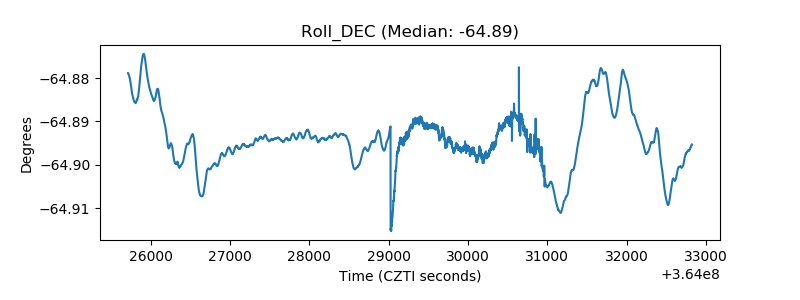 |
| _Roll_RA | 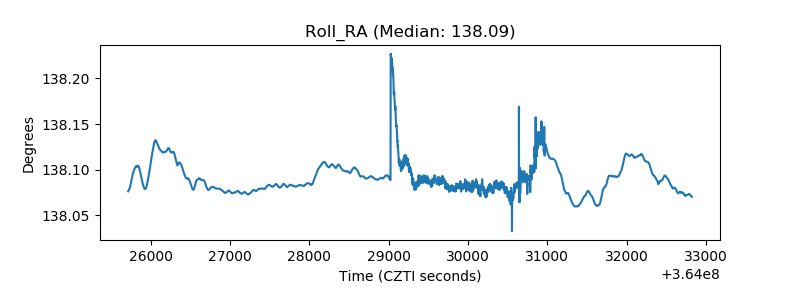 |
| Veto Counter | 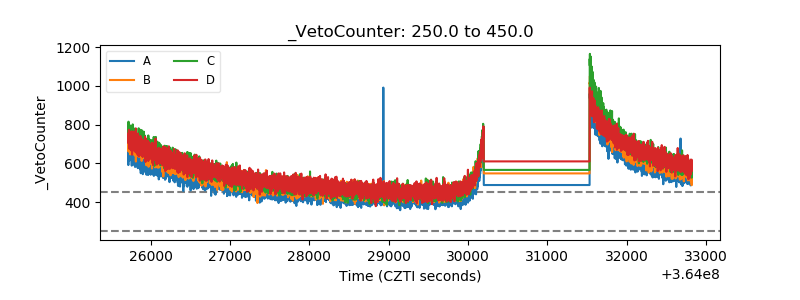 |