| Param | Original file | Final file |
|---|---|---|
| Filename | modeM0/AS1T04_025T01_9000004538_31339cztM0_level2.evt | modeM0/AS1T04_025T01_9000004538_31339cztM0_level2_quad_clean.evt |
| Size (bytes) | 438,661,440 | 111,553,920 |
| Size | 418.3 MB | 106.4 MB |
| Events in quadrant A | 2,558,334 | 784,277 |
| Events in quadrant B | 3,997,744 | 765,380 |
| Events in quadrant C | 2,979,218 | 740,390 |
| Events in quadrant D | 3,418,083 | 745,809 |
| Mode SS | |||
|---|---|---|---|
| Quadrant | BADHDUFLAG | Total packets | Discarded packets |
| A | 0 | 98 | 0 |
| B | 0 | 98 | 0 |
| C | 0 | 98 | 0 |
| D | 0 | 98 | 0 |
| Mode M0 | |||
|---|---|---|---|
| Quadrant | BADHDUFLAG | Total packets | Discarded packets |
| A | 0 | 10570 | 1 |
| B | 0 | 15306 | 1 |
| C | 0 | 12126 | 1 |
| D | 0 | 13423 | 1 |
| Mode M9 | |||
|---|---|---|---|
| Quadrant | BADHDUFLAG | Total packets | Discarded packets |
| A | 0 | 14 | 0 |
| B | 0 | 14 | 0 |
| C | 0 | 14 | 0 |
| D | 0 | 14 | 0 |
| Quadrant | Total seconds | Saturated seconds | Saturation percentage |
|---|---|---|---|
| A | 4893 | 59 | 1.205804% |
| B | 4894 | 118 | 2.411116% |
| C | 4894 | 267 | 5.455660% |
| D | 4894 | 61 | 1.246424% |
Noise dominated data is calculated using 1-second bins in cleaned event files. If a bin has >2000 counts, and if more than 50% of those come from <1% of pixels, then it is considered to be noise-dominated and hence unusable.
| Quadrant | # 1 sec bins | Bins with >0 counts | Bins with >2000 counts | High rate bins dominated by noise | Noise dominated (total time) | Noise dominated (detector-on time) | Marked lightcurve |
|---|---|---|---|---|---|---|---|
| A | 6208 | 4894 | 0 | 0 | 0.00% | 0.00% | 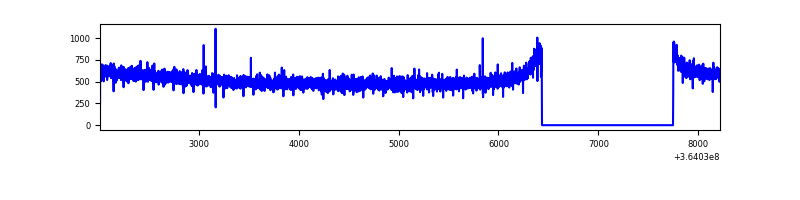 |
| B | 6209 | 4895 | 3 | 3 | 0.05% | 0.06% |  |
| C | 6209 | 4895 | 13 | 13 | 0.21% | 0.27% | 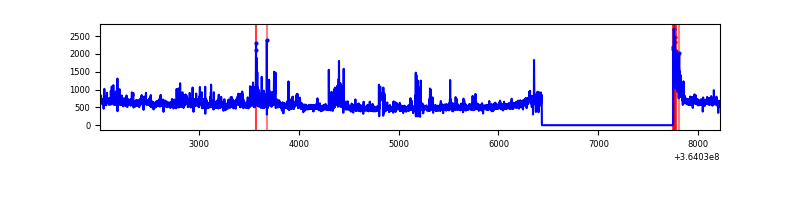 |
| D | 6209 | 4895 | 2 | 2 | 0.03% | 0.04% | 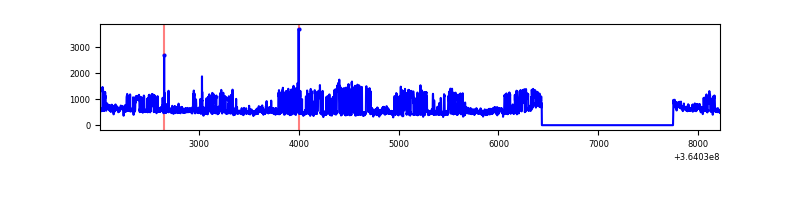 |
Top three noisy pixels from each quadrant. If the there are fewer than three noisy pixels in the level2.evt file, extra rows are filled as -1
| Pixel properties | Quadrant properties | ||||||
|---|---|---|---|---|---|---|---|
| Quadrant | DetID | PixID | Counts | Sigma | Mean | Median | Sigma |
| A | 13 | 254 | 8989 | 63.14 | 663 | 651 | 132.1 |
| A | 3 | 137 | 5930 | 39.98 | 663 | 651 | 132.1 |
| A | 0 | 226 | 5793 | 38.94 | 663 | 651 | 132.1 |
| B | 6 | 159 | 1330537 | 11170.56 | 639 | 624 | 119.1 |
| B | 4 | 80 | 64167 | 533.73 | 639 | 624 | 119.1 |
| B | 0 | 190 | 55560 | 461.43 | 639 | 624 | 119.1 |
| C | 3 | 233 | 217428 | 1526.88 | 619 | 625 | 142.0 |
| C | 14 | 238 | 137680 | 965.24 | 619 | 625 | 142.0 |
| C | 0 | 10 | 84224 | 588.76 | 619 | 625 | 142.0 |
| D | 8 | 195 | 944883 | 6310.74 | 644 | 628 | 149.6 |
| D | 12 | 233 | 21582 | 140.04 | 644 | 628 | 149.6 |
| D | 2 | 234 | 21532 | 139.71 | 644 | 628 | 149.6 |
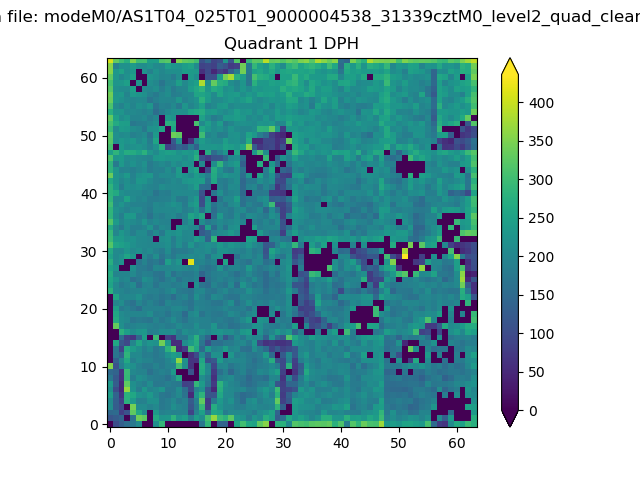
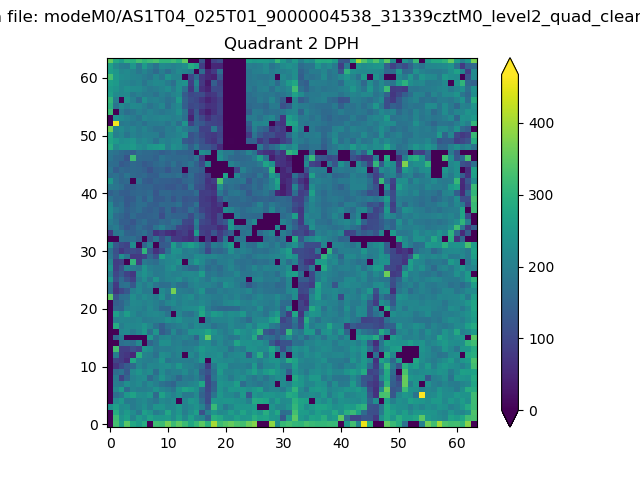
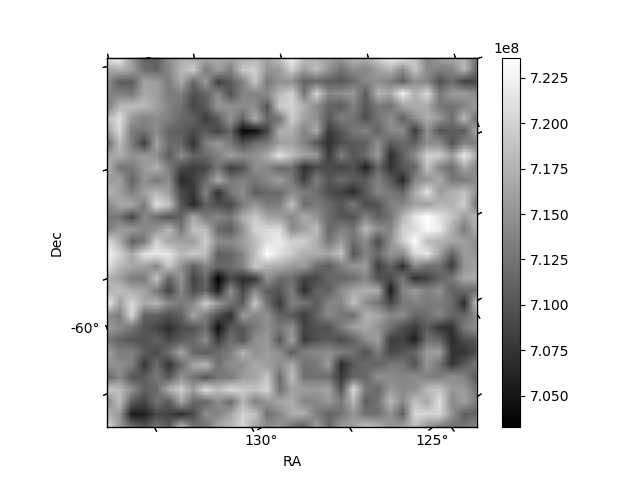
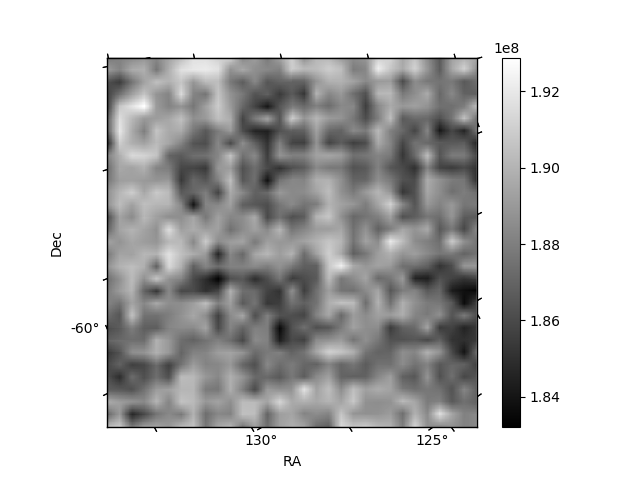
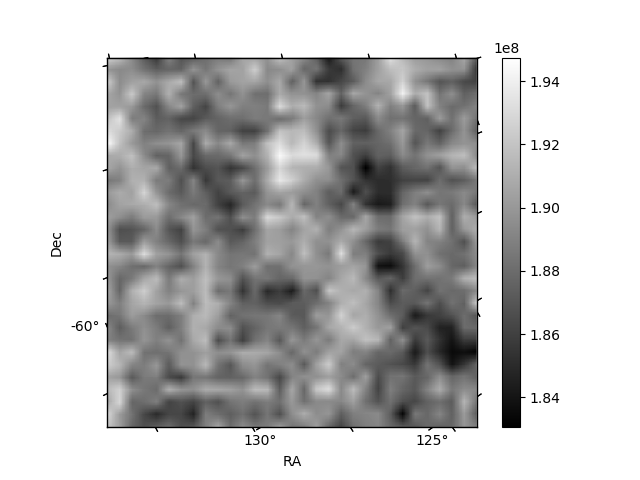
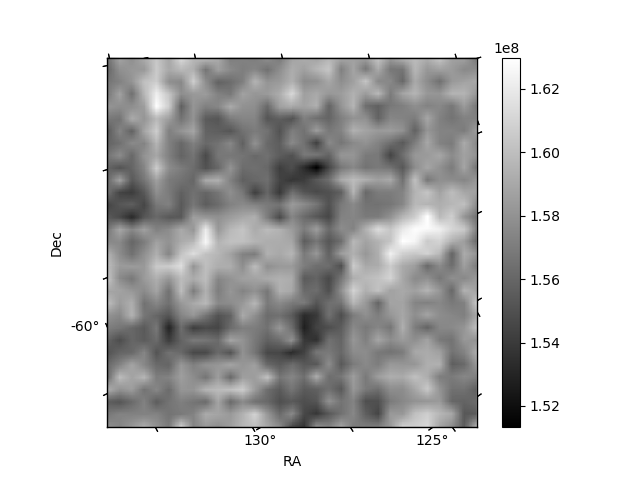
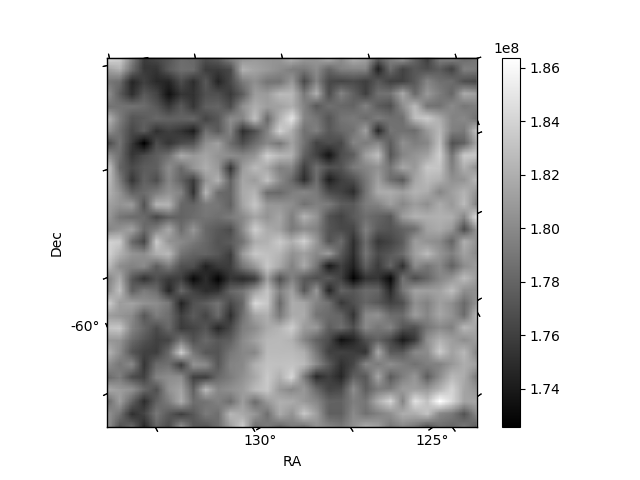
Histogram calculated using DETX and DETY for each event in the final _common_clean file
| Quadrant A | 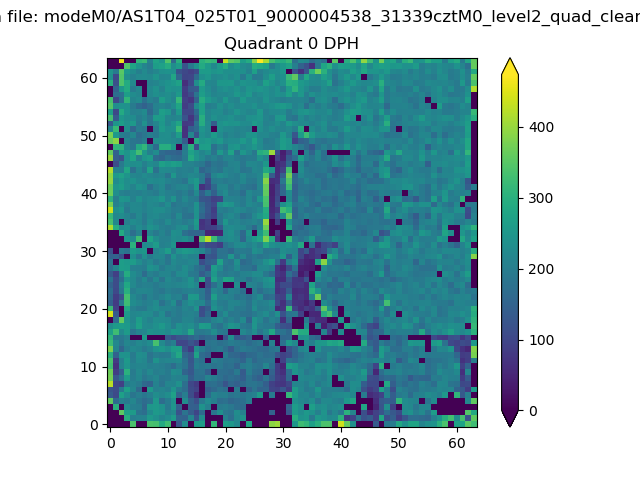 |
 |
Quadrant B |
|---|---|---|---|
| Quadrant D | 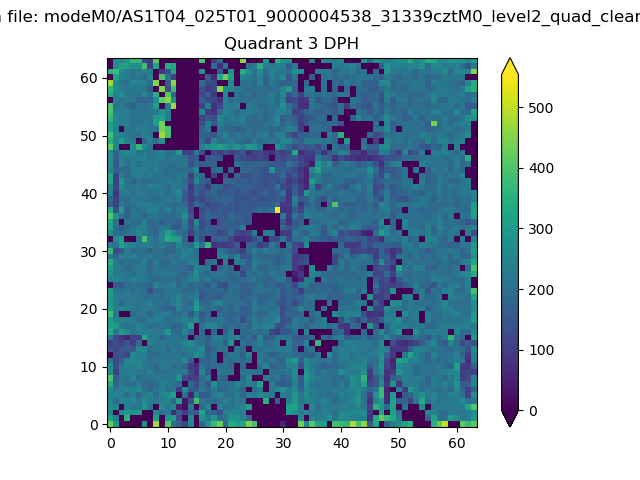 |
 |
Quadrant C |
| Plot type | Count rate plots | Images |
|---|---|---|
| Comparison with Poisson distribution Blue bars denote a histogram of data divided into 1 sec bins. Red curve is a Poisson curve with rate = median count rate of data. |
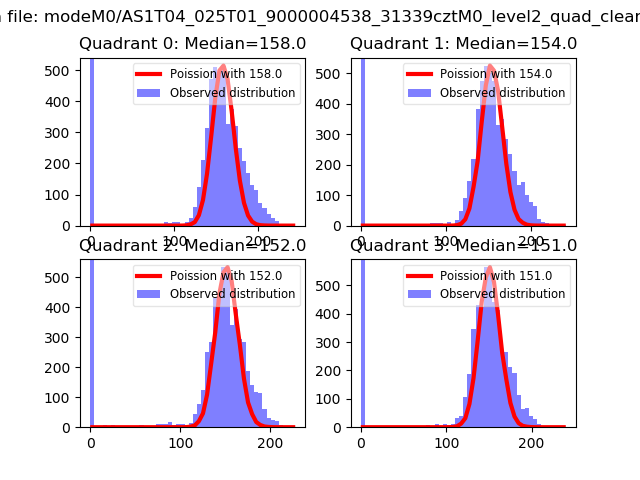 |
 |
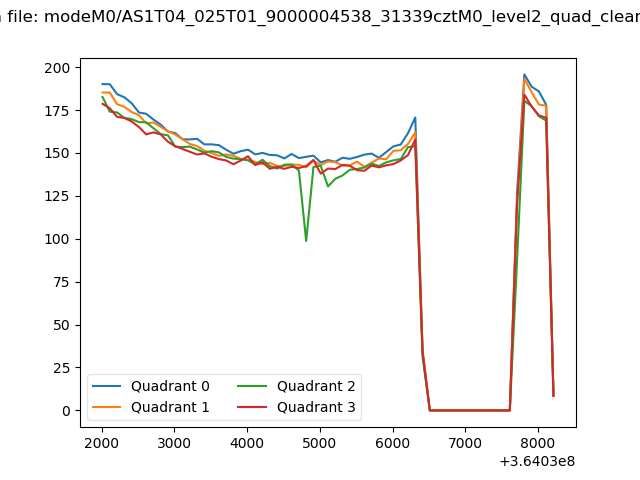
| Quadrant-wise count rates Data is divided into 100 sec bins |
 |
|
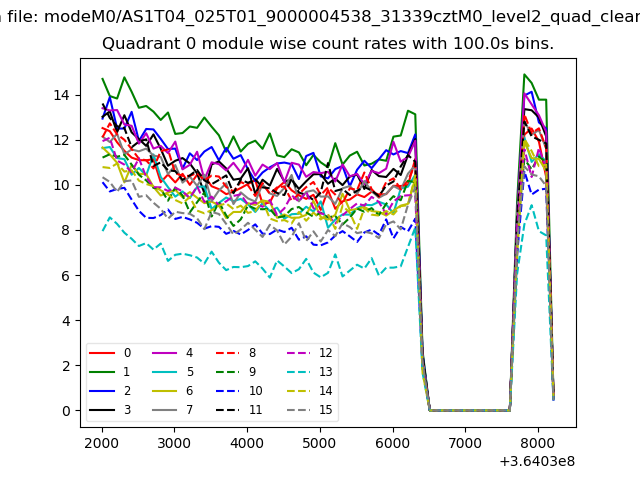
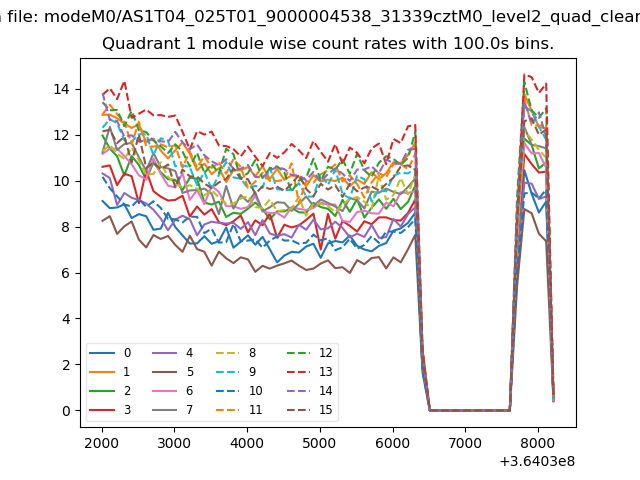
| Module-wise count rates for Quadrant A Data is divided into 100 sec bins |
 |
 |
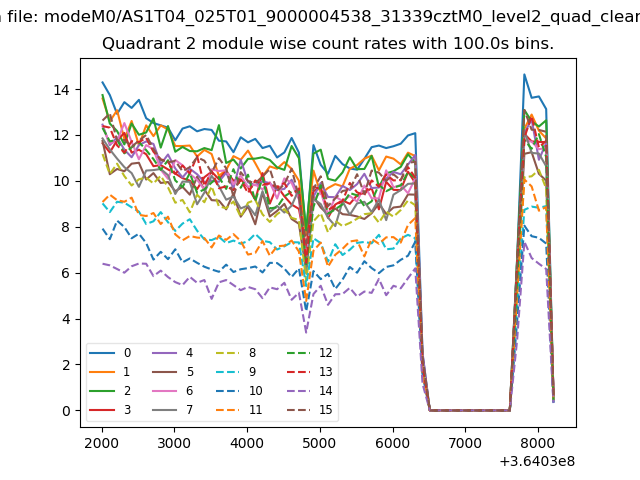
| Module-wise count rates for Quadrant B Data is divided into 100 sec bins |
 |
 |
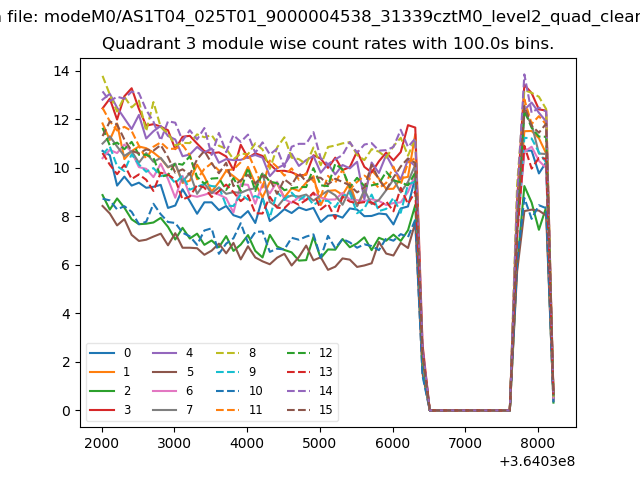
| Module-wise count rates for Quadrant C Data is divided into 100 sec bins |
 |
 |
| Module-wise count rates for Quadrant D Data is divided into 100 sec bins |
 |
 |
| Parameter | Plot |
|---|---|
| CZT HV Monitor | 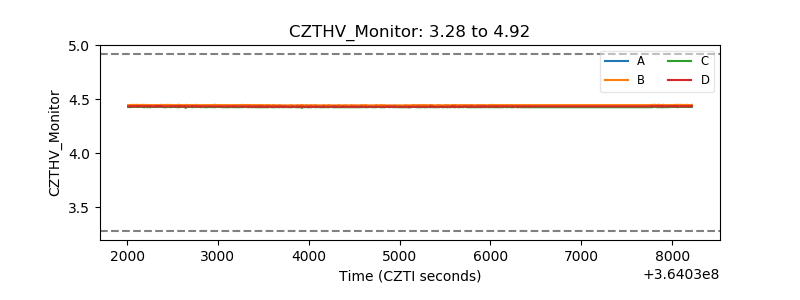 |
| D_VDD | 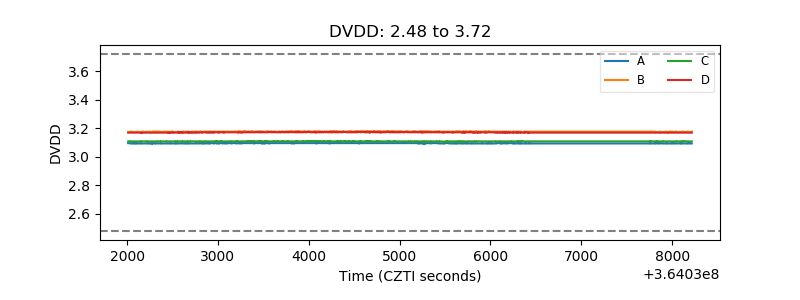 |
| Temperature 1 | 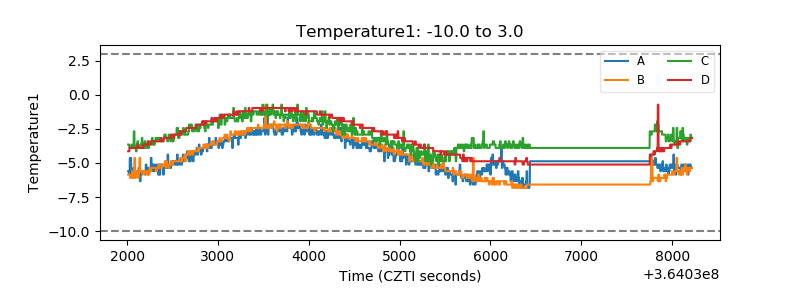 |
| Veto HV Monitor |  |
| Veto LLD | 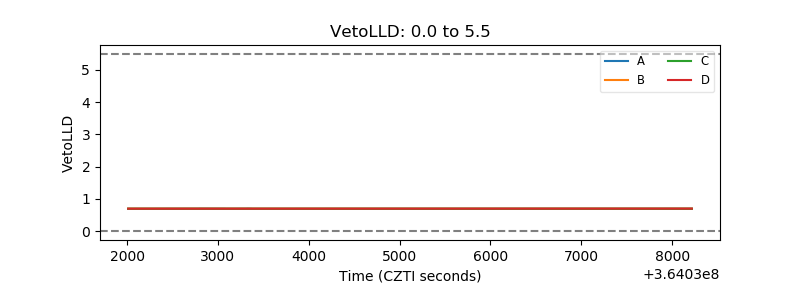 |
| Alpha Counter | 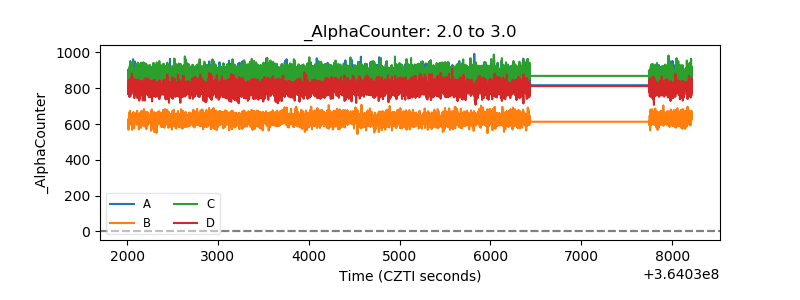 |
| _CPM_Rate | 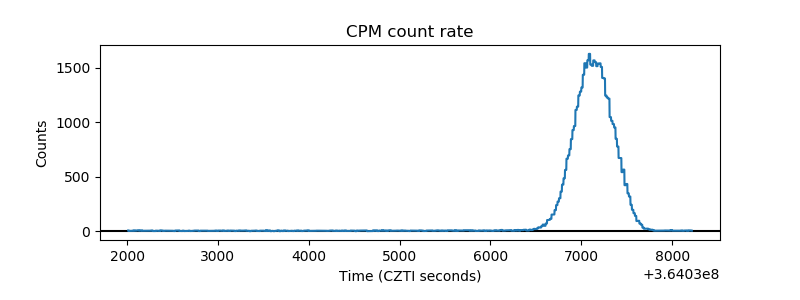 |
| CZT Counter | 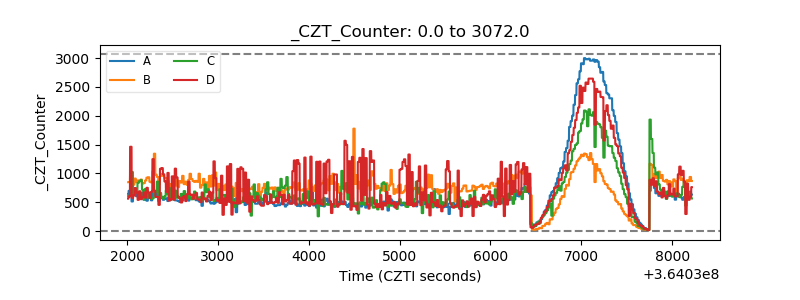 |
| +2.5 Volts monitor |  |
| +5 Volts monitor |  |
| _ROLL_ROT | 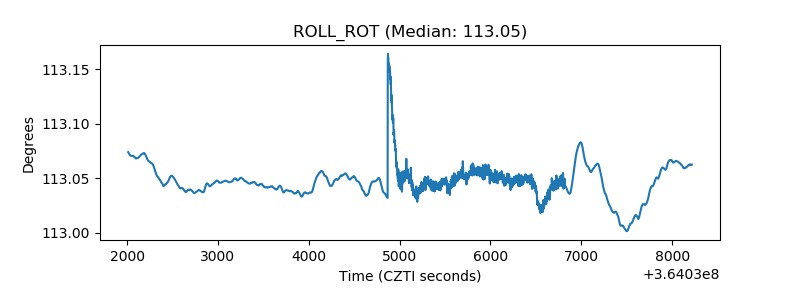 |
| _Roll_DEC | 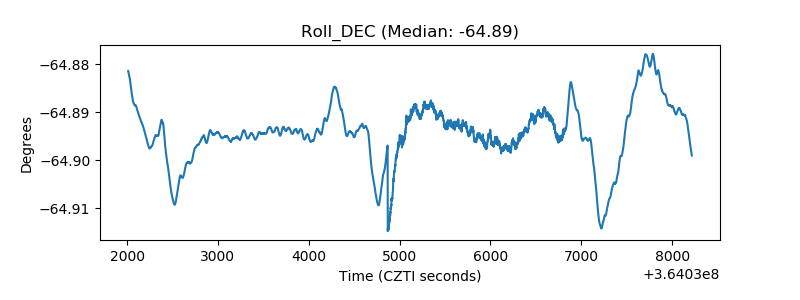 |
| _Roll_RA | 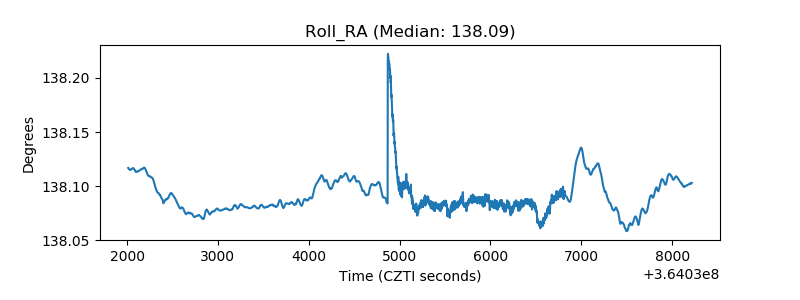 |
| Veto Counter | 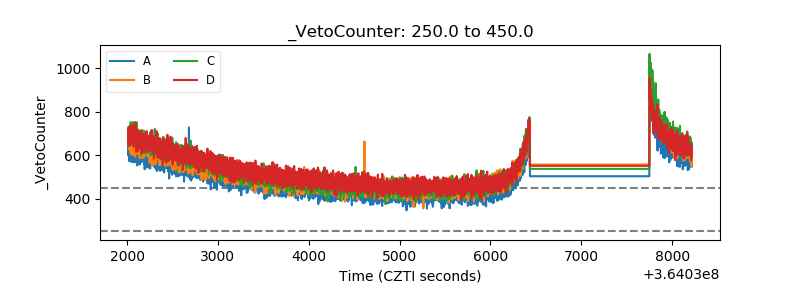 |