| Param | Original file | Final file |
|---|---|---|
| Filename | modeM0/AS1T04_025T01_9000004538_31517cztM0_level2.evt | modeM0/AS1T04_025T01_9000004538_31517cztM0_level2_quad_clean.evt |
| Size (bytes) | 94,821,120 | 20,707,200 |
| Size | 90.4 MB | 19.7 MB |
| Events in quadrant A | 647,652 | 135,243 |
| Events in quadrant B | 858,220 | 140,198 |
| Events in quadrant C | 565,929 | 137,699 |
| Events in quadrant D | 722,033 | 129,493 |
| Mode SS | |||
|---|---|---|---|
| Quadrant | BADHDUFLAG | Total packets | Discarded packets |
| A | 0 | 37 | 13 |
| B | 0 | 38 | 16 |
| C | 0 | 38 | 16 |
| D | 0 | 38 | 16 |
| Mode M0 | |||
|---|---|---|---|
| Quadrant | BADHDUFLAG | Total packets | Discarded packets |
| A | 0 | 4578 | 2012 |
| B | 0 | 5952 | 2660 |
| C | 0 | 4105 | 1840 |
| D | 0 | 4977 | 2165 |
| Mode M9 | |||
|---|---|---|---|
| Quadrant | BADHDUFLAG | Total packets | Discarded packets |
| A | 0 | 2 | 2 |
| B | 1 | 2 | 2 |
| C | 1 | -1 | -1 |
| D | 1 | -1 | -1 |
| Quadrant | Total seconds | Saturated seconds | Saturation percentage |
|---|---|---|---|
| A | 1099 | 44 | 4.003640% |
| B | 1090 | 15 | 1.376147% |
| C | 1109 | 3 | 0.270514% |
| D | 1105 | 37 | 3.348416% |
Noise dominated data is calculated using 1-second bins in cleaned event files. If a bin has >2000 counts, and if more than 50% of those come from <1% of pixels, then it is considered to be noise-dominated and hence unusable.
| Quadrant | # 1 sec bins | Bins with >0 counts | Bins with >2000 counts | High rate bins dominated by noise | Noise dominated (total time) | Noise dominated (detector-on time) | Marked lightcurve |
|---|---|---|---|---|---|---|---|
| A | 5687 | 1150 | 26 | 26 | 0.46% | 2.26% | 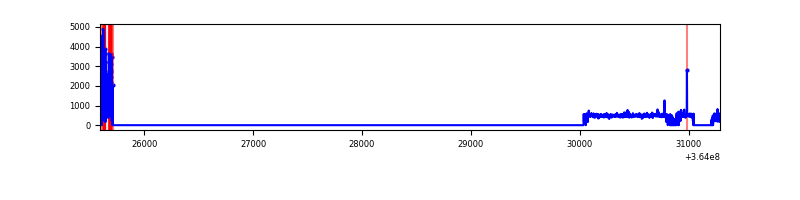 |
| B | 5690 | 1135 | 0 | 0 | 0.00% | 0.00% | 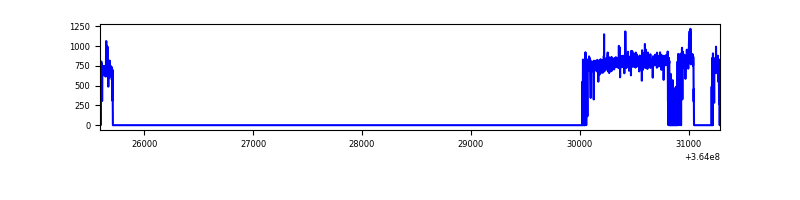 |
| C | 5691 | 1157 | 0 | 0 | 0.00% | 0.00% | 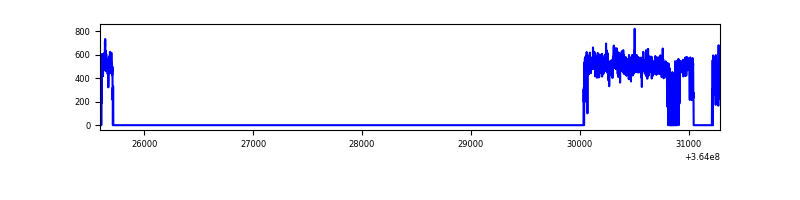 |
| D | 5694 | 1158 | 21 | 21 | 0.37% | 1.81% | 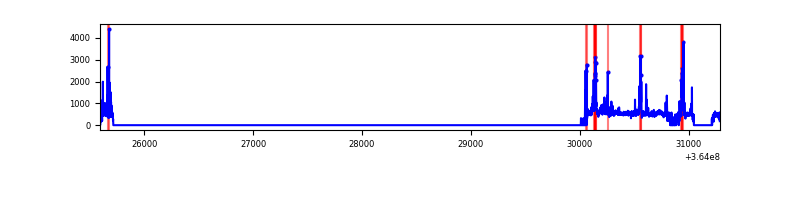 |
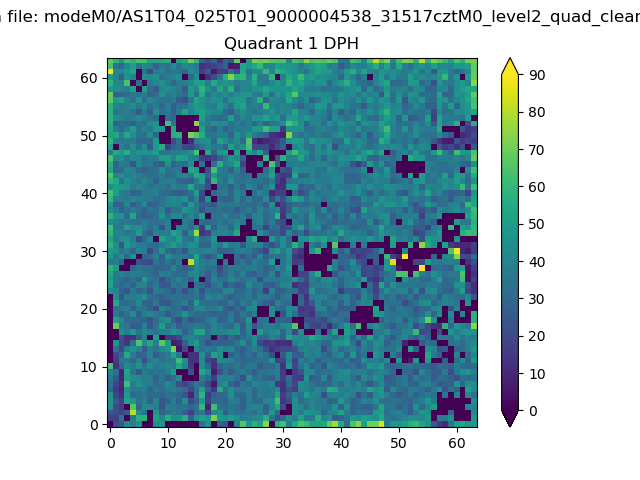
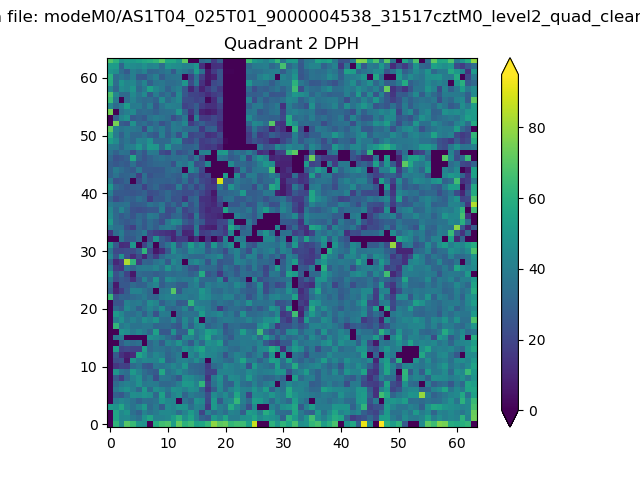
Top three noisy pixels from each quadrant. If the there are fewer than three noisy pixels in the level2.evt file, extra rows are filled as -1
| Pixel properties | Quadrant properties | ||||||
|---|---|---|---|---|---|---|---|
| Quadrant | DetID | PixID | Counts | Sigma | Mean | Median | Sigma |
| A | 0 | 13 | 130945 | 4542.98 | 133 | 130 | 28.8 |
| A | 13 | 254 | 2019 | 65.6 | 133 | 130 | 28.8 |
| A | 3 | 137 | 1455 | 46.01 | 133 | 130 | 28.8 |
| B | 6 | 159 | 310083 | 10809.04 | 134 | 130 | 28.7 |
| B | 0 | 190 | 8663 | 297.57 | 134 | 130 | 28.7 |
| B | 0 | 230 | 5768 | 196.61 | 134 | 130 | 28.7 |
| C | 14 | 238 | 21891 | 655.54 | 133 | 133 | 33.2 |
| C | 3 | 233 | 20279 | 606.97 | 133 | 133 | 33.2 |
| C | 2 | 114 | 2512 | 71.68 | 133 | 133 | 33.2 |
| D | 12 | 79 | 137725 | 4094.46 | 131 | 127 | 33.6 |
| D | 8 | 195 | 42715 | 1267.28 | 131 | 127 | 33.6 |
| D | 2 | 250 | 30207 | 895.08 | 131 | 127 | 33.6 |
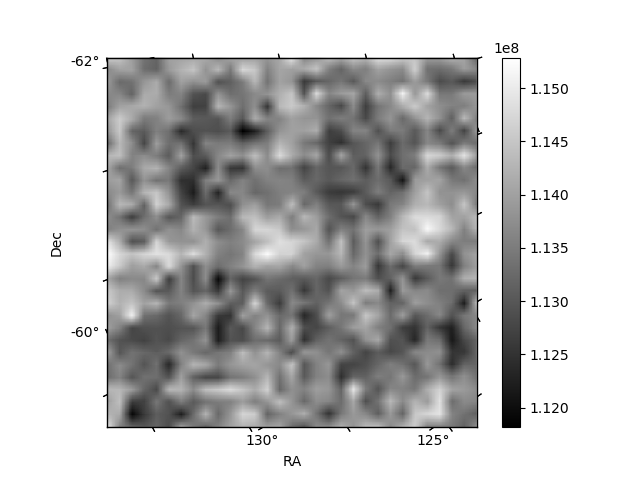
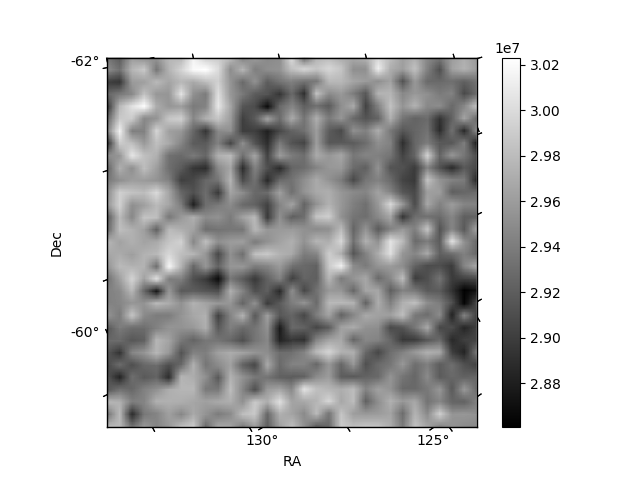
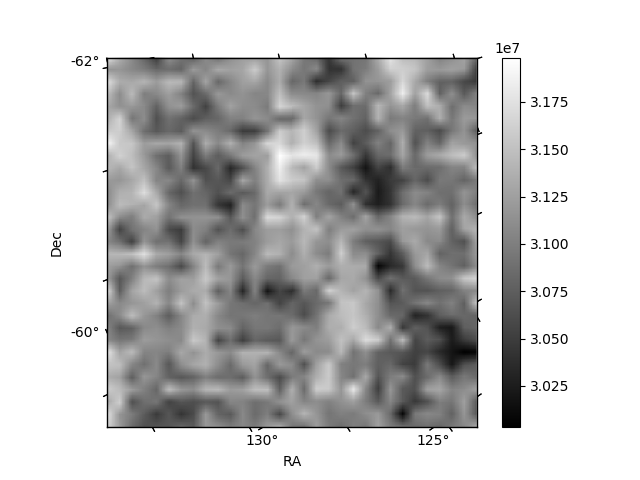
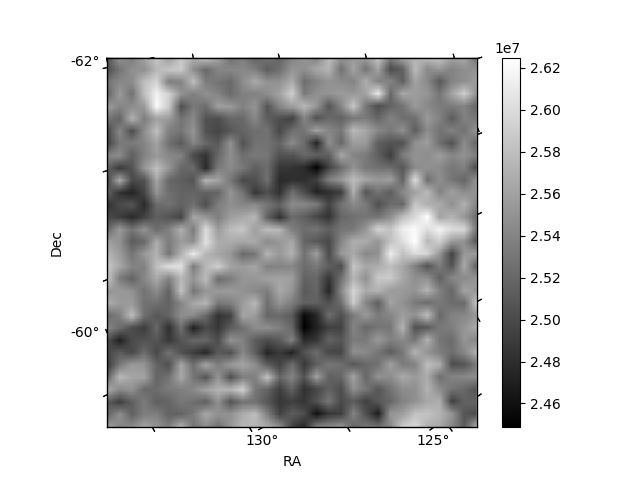
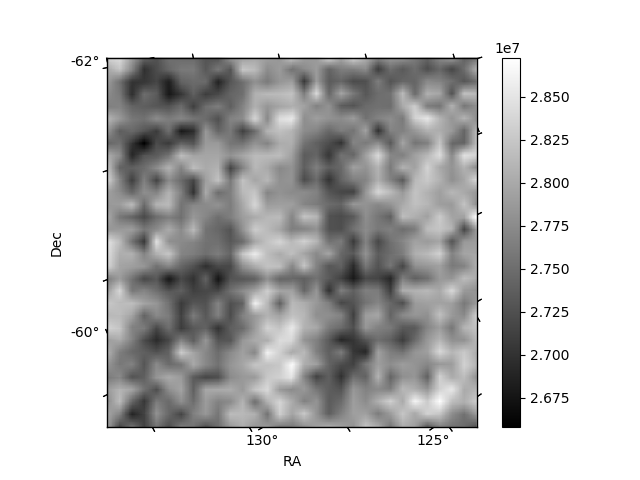
Histogram calculated using DETX and DETY for each event in the final _common_clean file
| Quadrant A | 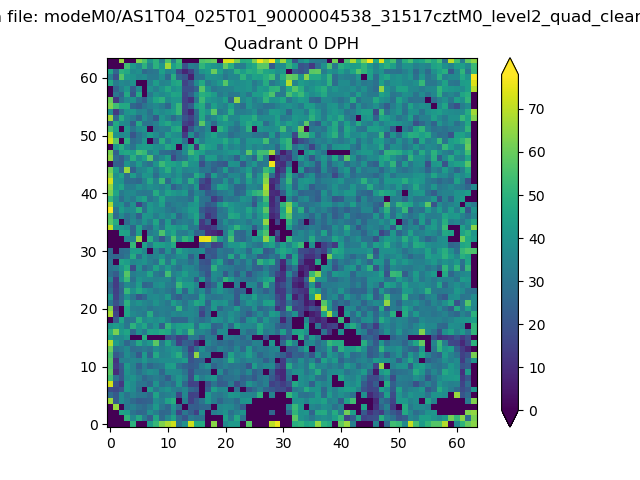 |
 |
Quadrant B |
|---|---|---|---|
| Quadrant D | 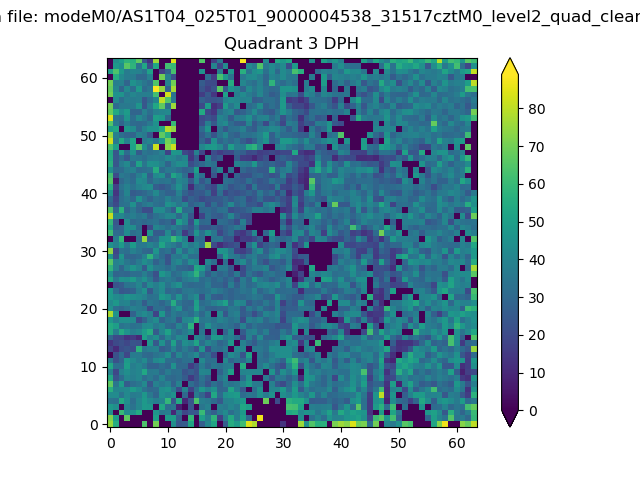 |
 |
Quadrant C |
| Plot type | Count rate plots | Images |
|---|---|---|
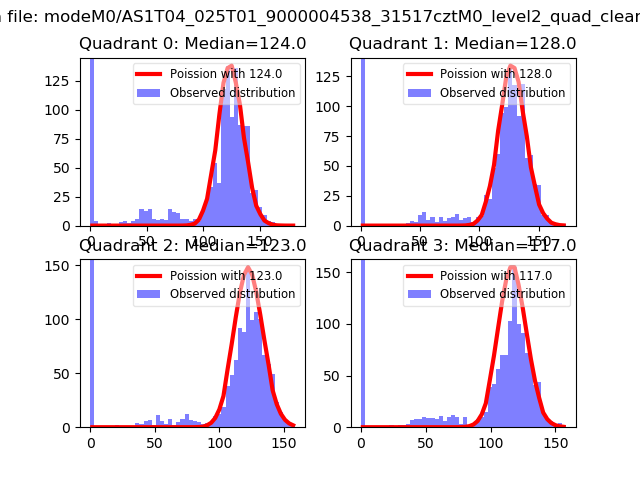
| Comparison with Poisson distribution Blue bars denote a histogram of data divided into 1 sec bins. Red curve is a Poisson curve with rate = median count rate of data. |
 |
 |
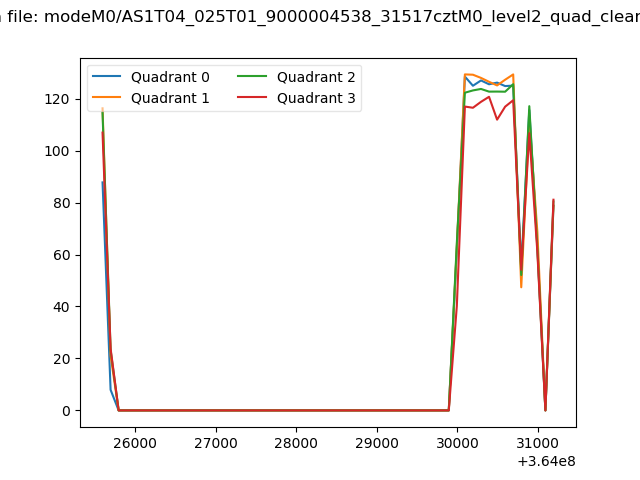
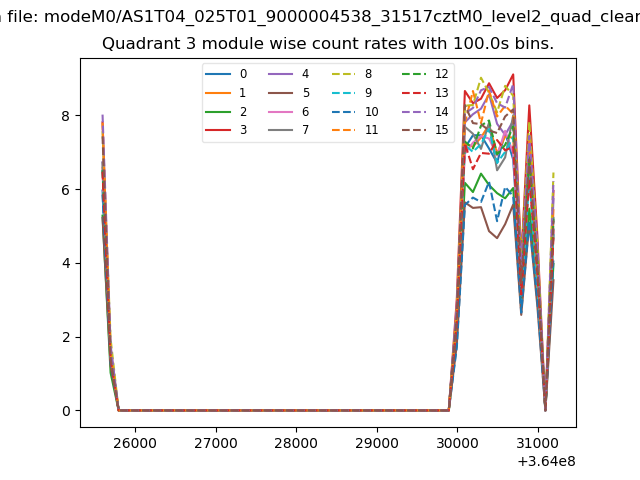
| Quadrant-wise count rates Data is divided into 100 sec bins |
 |
|
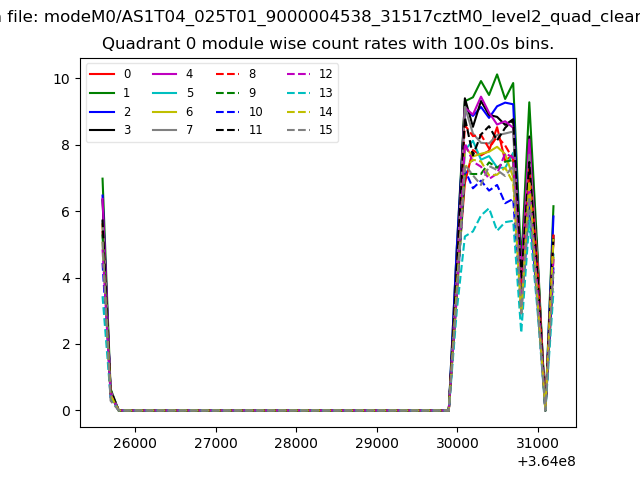
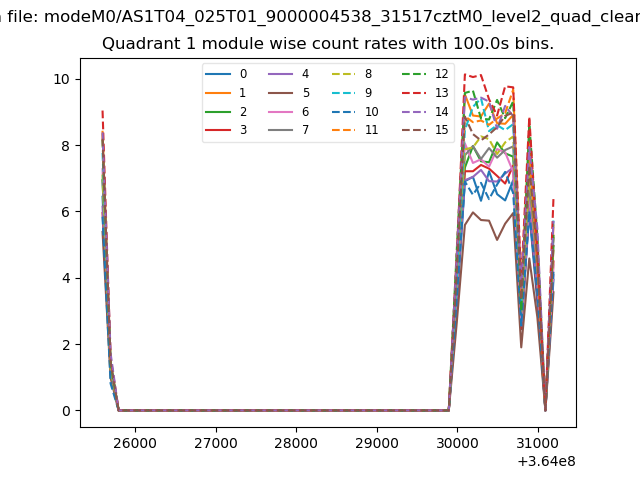
| Module-wise count rates for Quadrant A Data is divided into 100 sec bins |
 |
 |
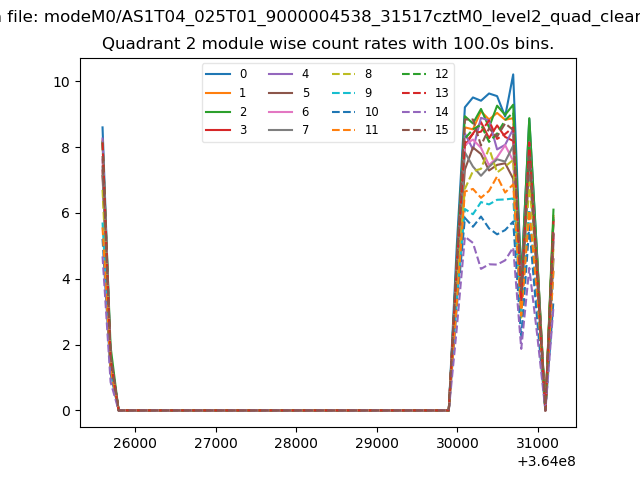
| Module-wise count rates for Quadrant B Data is divided into 100 sec bins |
 |
 |
| Module-wise count rates for Quadrant C Data is divided into 100 sec bins |
 |
 |
| Module-wise count rates for Quadrant D Data is divided into 100 sec bins |
 |
 |
| Parameter | Plot |
|---|---|
| CZT HV Monitor | 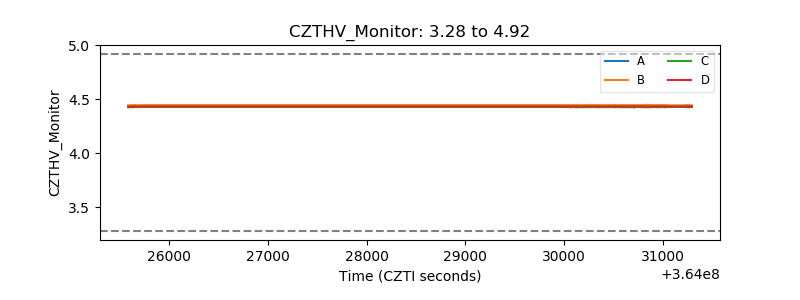 |
| D_VDD |  |
| Temperature 1 | 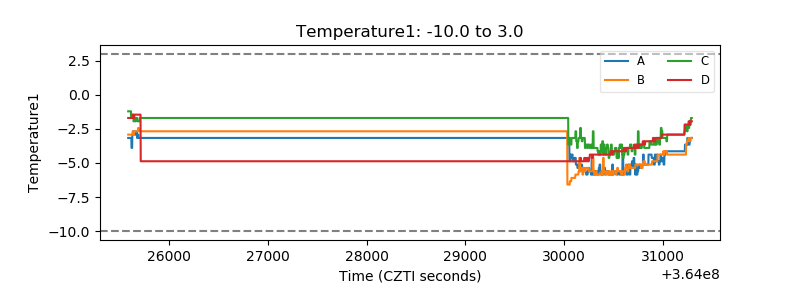 |
| Veto HV Monitor |  |
| Veto LLD | 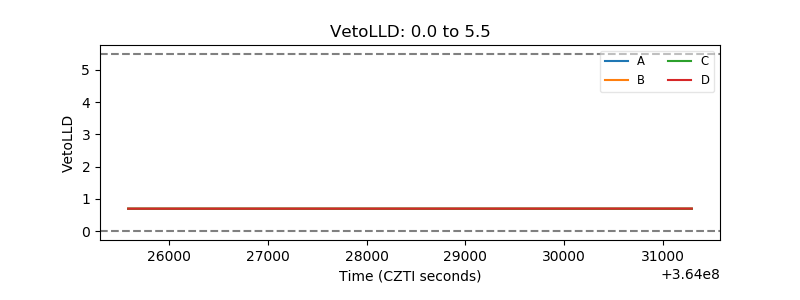 |
| Alpha Counter | 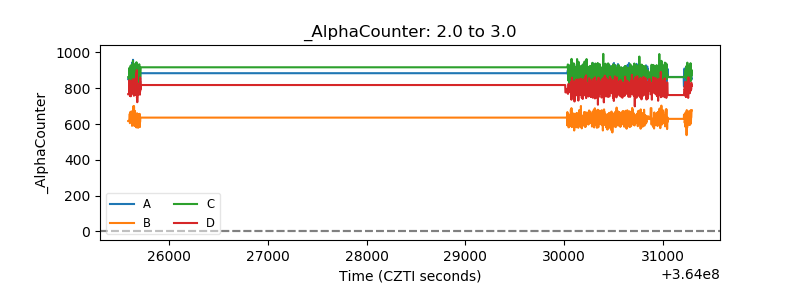 |
| _CPM_Rate | 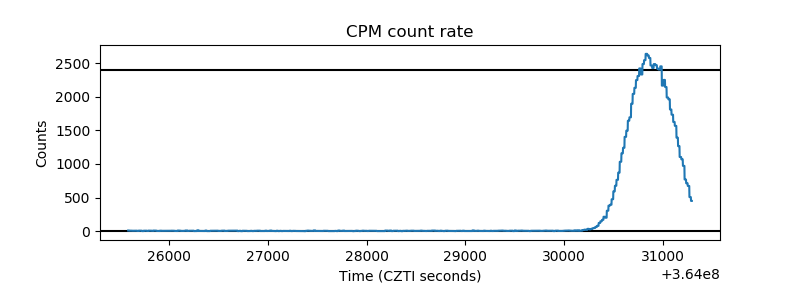 |
| CZT Counter | 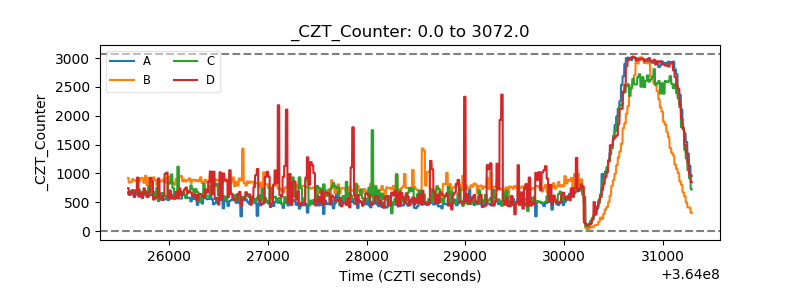 |
| +2.5 Volts monitor |  |
| +5 Volts monitor |  |
| _ROLL_ROT | 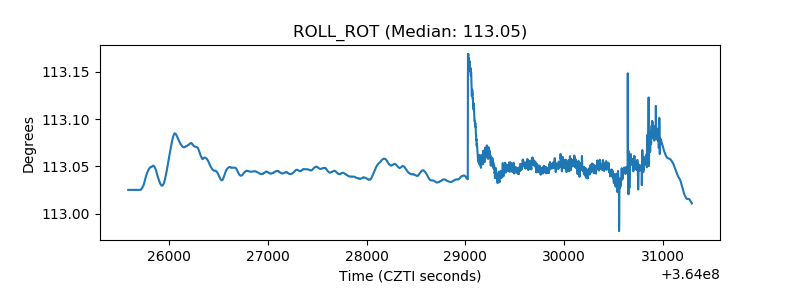 |
| _Roll_DEC | 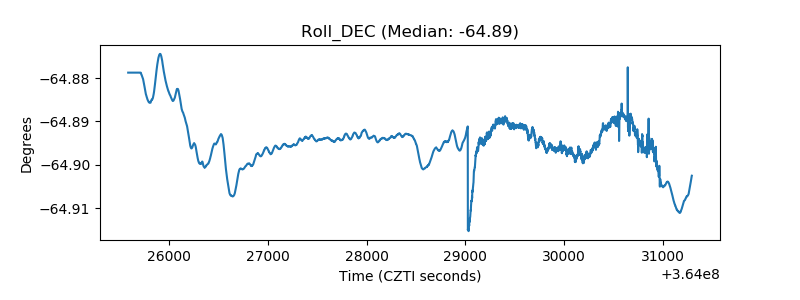 |
| _Roll_RA | 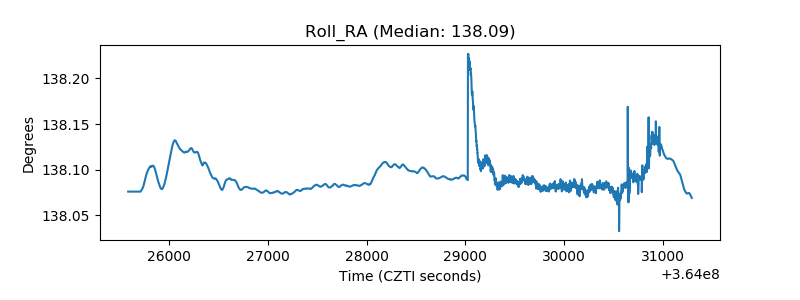 |
| Veto Counter | 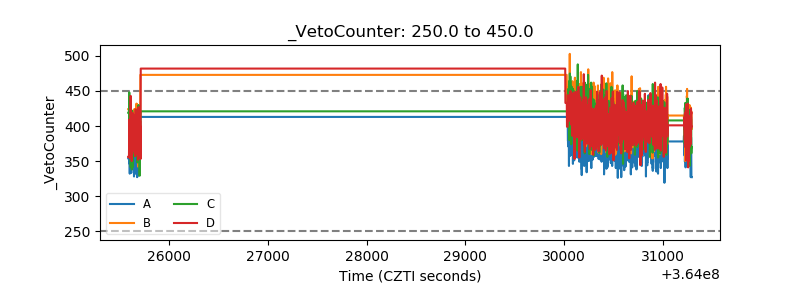 |